In statistics, the focused information criterion (FIC) is a method for selecting the most appropriate model among a set of competitors for a given data set. Unlike most other model selection strategies, like the Akaike information criterion (AIC), the Bayesian information criterion (BIC) and the deviance information criterion (DIC), the FIC does not attempt to assess the overall fit of candidate models but focuses attention directly on the parameter of primary interest with the statistical analysis, say , for which competing models lead to different estimates, say for model . The FIC method consists in first developing an exact or approximate expression for the precision or quality of each estimator, say for , and then use data to estimate these precision measures, say . In the end the model with best estimated precision is selected. The FIC methodology was developed by Gerda Claeskens and Nils Lid Hjort, first in two 2003 discussion articles in Journal of the American Statistical Association and later on in other papers and in their 2008 book.


Statistics is a branch of mathematics dealing with data collection, organization, analysis, interpretation and presentation. In applying statistics to, for example, a scientific, industrial, or social problem, it is conventional to begin with a statistical population or a statistical model process to be studied. Populations can be diverse topics such as "all people living in a country" or "every atom composing a crystal". Statistics deals with all aspects of data, including the planning of data collection in terms of the design of surveys and experiments. See glossary of probability and statistics.
Model selection is the task of selecting a statistical model from a set of candidate models, given data. In the simplest cases, a pre-existing set of data is considered. However, the task can also involve the design of experiments such that the data collected is well-suited to the problem of model selection. Given candidate models of similar predictive or explanatory power, the simplest model is most likely to be the best choice.
The Akaike information criterion (AIC) is an estimator of the relative quality of statistical models for a given set of data. Given a collection of models for the data, AIC estimates the quality of each model, relative to each of the other models. Thus, AIC provides a means for model selection.
Contents
The concrete formulae and implementation for FIC depend firstly on the particular parameter of interest, the choice of which does not depend on mathematics but on the scientific and statistical context. Thus the FIC apparatus may be selecting one model as most appropriate for estimating a quantile of a distribution but preferring another model as best for estimating the mean value. Secondly, the FIC formulae depend on the specifics of the models used for the observed data and also on how precision is to be measured. The clearest case is where precision is taken to be mean squared error, say in terms of squared bias and variance for the estimator associated with model . FIC formulae are then available in a variety of situations, both for handling parametric, semiparametric and nonparametric situations, involving separate estimation of squared bias and variance, leading to estimated precision . In the end the FIC selects the model with smallest estimated mean squared error.

In statistics, the mean squared error (MSE) or mean squared deviation (MSD) of an estimator measures the average of the squares of the errors—that is, the average squared difference between the estimated values and what is estimated. MSE is a risk function, corresponding to the expected value of the squared error loss. The fact that MSE is almost always strictly positive is because of randomness or because the estimator does not account for information that could produce a more accurate estimate.
In statistics, the bias of an estimator is the difference between this estimator's expected value and the true value of the parameter being estimated. An estimator or decision rule with zero bias is called unbiased. Otherwise the estimator is said to be biased. In statistics, "bias" is an objective property of an estimator, and while not a desired property, it is not pejorative, unlike the ordinary English use of the term "bias".

In probability theory and statistics, variance is the expectation of the squared deviation of a random variable from its mean. Informally, it measures how far a set of (random) numbers are spread out from their average value. Variance has a central role in statistics, where some ideas that use it include descriptive statistics, statistical inference, hypothesis testing, goodness of fit, and Monte Carlo sampling. Variance is an important tool in the sciences, where statistical analysis of data is common. The variance is the square of the standard deviation, the second central moment of a distribution, and the covariance of the random variable with itself, and it is often represented by , , or .
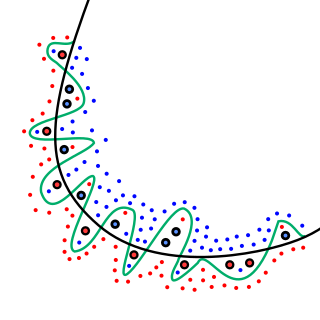
Associated with the use of the FIC for selecting a good model is the FIC plot, designed to give a clear and informative picture of all estimates, across all candidate models, and their merit. It displays estimates on the axis along with FIC scores on the axis; thus estimates found to the left in the plot are associated with the better models and those found in the middle and to the right stem from models less or not adequate for the purpose of estimating the focus parameter in question.


Generally speaking, complex models (with many parameters relative to sample size) tend to lead to estimators with small bias but high variance; more parsimonious models (with fewer parameters) typically yield estimators with larger bias but smaller variance. The FIC method balances the two desired data of having small bias and small variance in an optimal fashion. The main difficulty lies with the bias , as it involves the distance from the expected value of the estimator to the true underlying quantity to be estimated, and the true data generating mechanism may lie outside each of the candidate models.

In situations where there is not a unique focus parameter, but rather a family of such, there are versions of average FIC (AFIC or wFIC) that find the best model in terms of suitably weighted performance measures, e.g. when searching for a regression model to perform particularly well in a portion of the covariate space.

In statistical modeling, regression analysis is a set of statistical processes for estimating the relationships among variables. It includes many techniques for modeling and analyzing several variables, when the focus is on the relationship between a dependent variable and one or more independent variables. More specifically, regression analysis helps one understand how the typical value of the dependent variable changes when any one of the independent variables is varied, while the other independent variables are held fixed.
It is also possible to keep several of the best models on board, ending the statistical analysis with a data-dicated weighted average of the estimators of the best FIC scores, typically giving highest weight to estimators associated with the best FIC scores. Such schemes of model averaging extend the direct FIC selection method.
The FIC methodology applies in particular to selection of variables in different forms of regression analysis, including the framework of generalised linear models and the semiparametric proportional hazards models (i.e. Cox regression).
In statistics, the generalized linear model (GLM) is a flexible generalization of ordinary linear regression that allows for response variables that have error distribution models other than a normal distribution. The GLM generalizes linear regression by allowing the linear model to be related to the response variable via a link function and by allowing the magnitude of the variance of each measurement to be a function of its predicted value.