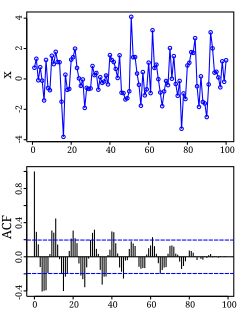
Autocorrelation, also known as serial correlation, is the correlation of a signal with a delayed copy of itself as a function of delay. Informally, it is the similarity between observations as a function of the time lag between them. The analysis of autocorrelation is a mathematical tool for finding repeating patterns, such as the presence of a periodic signal obscured by noise, or identifying the missing fundamental frequency in a signal implied by its harmonic frequencies. It is often used in signal processing for analyzing functions or series of values, such as time domain signals.

In mathematics convolution is a mathematical operation on two functions to produce a third function that expresses how the shape of one is modified by the other. The term convolution refers to both the result function and to the process of computing it. Some features of convolution are similar to cross-correlation: for real-valued functions, of a continuous or discrete variable, it differs from cross-correlation only in that either f (x) or g(x) is reflected about the y-axis; thus it is a cross-correlation of f (x) and g(−x), or f (−x) and g(x). For continuous functions, the cross-correlation operator is the adjoint of the convolution operator.
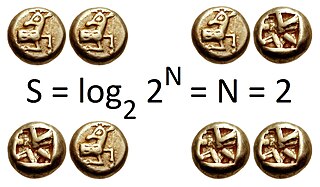
Information entropy is the average rate at which information is produced by a stochastic source of data.

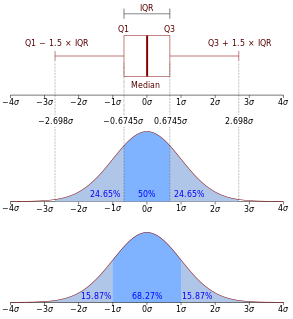
In probability theory, the normaldistribution is a very common continuous probability distribution. Normal distributions are important in statistics and are often used in the natural and social sciences to represent real-valued random variables whose distributions are not known. A random variable with a Gaussian distribution is said to be normally distributed and is called a normal deviate.

In probability theory and statistics, variance is the expectation of the squared deviation of a random variable from its mean. Informally, it measures how far a set of (random) numbers are spread out from their average value. Variance has a central role in statistics, where some ideas that use it include descriptive statistics, statistical inference, hypothesis testing, goodness of fit, and Monte Carlo sampling. Variance is an important tool in the sciences, where statistical analysis of data is common. The variance is the square of the standard deviation, the second central moment of a distribution, and the covariance of the random variable with itself, and it is often represented by , , or .
In probability theory and statistics, covariance is a measure of the joint variability of two random variables. If the greater values of one variable mainly correspond with the greater values of the other variable, and the same holds for the lesser values,, the covariance is positive. In the opposite case, when the greater values of one variable mainly correspond to the lesser values of the other,, the covariance is negative. The sign of the covariance therefore shows the tendency in the linear relationship between the variables. The magnitude of the covariance is not easy to interpret because it is not normalized and hence depends on the magnitudes of the variables. The normalized version of the covariance, the correlation coefficient, however, shows by its magnitude the strength of the linear relation.

In statistics and control theory, Kalman filtering, also known as linear quadratic estimation (LQE), is an algorithm that uses a series of measurements observed over time, containing statistical noise and other inaccuracies, and produces estimates of unknown variables that tend to be more accurate than those based on a single measurement alone, by estimating a joint probability distribution over the variables for each timeframe. The filter is named after Rudolf E. Kálmán, one of the primary developers of its theory.
Rate–distortion theory is a major branch of information theory which provides the theoretical foundations for lossy data compression; it addresses the problem of determining the minimal number of bits per symbol, as measured by the rate R, that should be communicated over a channel, so that the source can be approximately reconstructed at the receiver without exceeding a given distortion D.
In probability theory and statistics, the Bernoulli distribution, named after Swiss mathematician Jacob Bernoulli, is the discrete probability distribution of a random variable which takes the value 1 with probability and the value 0 with probability that is, the probability distribution of any single experiment that asks a yes–no question; the question results in a boolean-valued outcome, a single bit of information whose value is success/yes/true/one with probability p and failure/no/false/zero with probability q. It can be used to represent a coin toss where 1 and 0 would represent "heads" and "tails", respectively, and p would be the probability of the coin landing on heads or tails, respectively. In particular, unfair coins would have
In mathematics, a Gaussian function, often simply referred to as a Gaussian, is a function of the form:
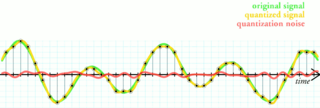
Quantization, in mathematics and digital signal processing, is the process of mapping input values from a large set to output values in a (countable) smaller set, often with a finite number of elements. Rounding and truncation are typical examples of quantization processes. Quantization is involved to some degree in nearly all digital signal processing, as the process of representing a signal in digital form ordinarily involves rounding. Quantization also forms the core of essentially all lossy compression algorithms.
In mathematical statistics, the Kullback–Leibler divergence is a measure of how one probability distribution is different from a second, reference probability distribution. Applications include characterizing the relative(Shannon) entropy in information systems, randomness in continuous time-series, and information gain when comparing statistical models of inference. In contrast to variation of information, it is a distribution-wise asymmetric measure and thus does not qualify as a statistical metric of spread. In the simple case, a Kullback–Leibler divergence of 0 indicates that the two distributions in question are identical. In simplified terms, it is a measure of surprise, with diverse applications such as applied statistics, fluid mechanics, neuroscience and machine learning.
Linear time-invariant theory, commonly known as LTI system theory, investigates the response of a linear and time-invariant system to an arbitrary input signal. Trajectories of these systems are commonly measured and tracked as they move through time, but in applications like image processing and field theory, the LTI systems also have trajectories in spatial dimensions. Thus, these systems are also called linear translation-invariant to give the theory the most general reach. In the case of generic discrete-time systems, linear shift-invariant is the corresponding term. A good example of LTI systems are electrical circuits that can be made up of resistors, capacitors, and inductors.. It has been used in applied mathematics and has direct applications in NMR spectroscopy, seismology, circuits, signal processing, control theory, and other technical areas.

In probability theory and statistics, the continuous uniform distribution or rectangular distribution is a family of symmetric probability distributions such that for each member of the family, all intervals of the same length on the distribution's support are equally probable. The support is defined by the two parameters, a and b, which are its minimum and maximum values. The distribution is often abbreviated U(a,b). It is the maximum entropy probability distribution for a random variable X under no constraint other than that it is contained in the distribution's support.
Signal-to-Quantization-Noise Ratio is widely used quality measure in analysing digitizing schemes such as PCM and multimedia codecs. The SQNR reflects the relationship between the maximum nominal signal strength and the quantization error introduced in the analog-to-digital conversion.
Differential entropy is a concept in information theory that began as an attempt by Shannon to extend the idea of (Shannon) entropy, a measure of average surprisal of a random variable, to continuous probability distributions. Unfortunately, Shannon did not derive this formula, and rather just assumed it was the correct continuous analogue of discrete entropy, but it is not. The actual continuous version of discrete entropy is the limiting density of discrete points (LDDP). Differential entropy is commonly encountered in the literature, but it is a limiting case of the LDDP, and one that loses its fundamental association with discrete entropy.
Pulse-density modulation, or PDM, is a form of modulation used to represent an analog signal with a binary signal. In a PDM signal, specific amplitude values are not encoded into codewords of pulses of different weight as they would be in pulse-code modulation (PCM); rather, the relative density of the pulses corresponds to the analog signal's amplitude. The output of a 1-bit DAC is the same as the PDM encoding of the signal. Pulse-width modulation (PWM) is a special case of PDM where the switching frequency is fixed and all the pulses corresponding to one sample are contiguous in the digital signal. For a 50% voltage with a resolution of 8-bits, a PWM waveform will turn on for 128 clock cycles and then off for the remaining 128 cycles. With PDM and the same clock rate the signal would alternate between on and off every other cycle. The average is 50% for both waveforms, but the PDM signal switches more often. For 100% or 0% level, they are the same.

In statistics and machine learning, the bias–variance tradeoff is the property of a set of predictive models whereby models with a lower bias in parameter estimation have a higher variance of the parameter estimates across samples, and vice versa. The bias–variance dilemma or problem is the conflict in trying to simultaneously minimize these two sources of error that prevent supervised learning algorithms from generalizing beyond their training set:
The separation principle is one of the fundamental principles of stochastic control theory, which states that the problems of optimal control and state estimation can be decoupled under certain conditions. In its most basic formulation it deals with a linear stochastic system