An OLAP cube is a multi-dimensional array of data. Online analytical processing (OLAP) is a computer-based technique of analyzing data to look for insights. The term cube here refers to a multi-dimensional dataset, which is also sometimes called a hypercube if the number of dimensions is greater than 3.
In statistics, econometrics, and related fields, multidimensional analysis (MDA) is a data analysis process that groups data into two categories: data dimensions and measurements. For example, a data set consisting of the number of wins for a single football team at each of several years is a single-dimensional data set. A data set consisting of the number of wins for several football teams in a single year is also a single-dimensional data set. A data set consisting of the number of wins for several football teams over several years is a two-dimensional data set.
In statistics and econometrics, and in particular in time series analysis, an autoregressive integrated moving average (ARIMA) model is a generalization of an autoregressive moving average (ARMA) model. Both of these models are fitted to time series data either to better understand the data or to predict future points in the series (forecasting). ARIMA models are applied in some cases where data show evidence of non-stationarity, where an initial differencing step can be applied one or more times to eliminate the non-stationarity.
Cointegration is a statistical property of a collection (X1, X2, ..., Xk) of time series variables. First, all of the series must be integrated of order d. Next, if a linear combination of this collection is integrated of order less than d, then the collection is said to be co-integrated. Formally, if (X,Y,Z) are each integrated of order d, and there exist coefficients a,b,c such that aX + bY + cZ is integrated of order less than d, then X, Y, and Z are cointegrated. Cointegration has become an important property in contemporary time series analysis. Time series often have trends—either deterministic or stochastic. In an influential paper, Charles Nelson and Charles Plosser (1982) provided statistical evidence that many US macroeconomic time series have stochastic trends—these are also called unit root processes, or processes integrated of order . They also showed that unit root processes have non-standard statistical properties, so that conventional econometric theory methods do not apply to them.
Panel (data) analysis is a statistical method, widely used in social science, epidemiology, and econometrics to analyze two-dimensional panel data. The data are usually collected over time and over the same individuals and then a regression is run over these two dimensions. Multidimensional analysis is an econometric method in which data are collected over more than two dimensions.
In econometrics and other applications of multivariate time series analysis, a variance decomposition or forecast error variance decomposition (FEVD) is used to aid in the interpretation of a vector autoregression (VAR) model once it has been fitted. The variance decomposition indicates the amount of information each variable contributes to the other variables in the autoregression. It determines how much of the forecast error variance of each of the variables can be explained by exogenous shocks to the other variables.
RATS, an abbreviation of Regression Analysis of Time Series, is a statistical package for time series analysis and econometrics. RATS is developed and sold by Estima, Inc., located in Evanston, IL.

In statistics, a random effects model, also called a variance components model, is a statistical model where the model parameters are random variables. It is a kind of hierarchical linear model, which assumes that the data being analysed are drawn from a hierarchy of different populations whose differences relate to that hierarchy. In econometrics, random effects models are used in the analysis of hierarchical or panel data when one assumes no fixed effects. The random effects model is a special case of the fixed effects model.

In econometrics and statistics, a structural break is an unexpected change over time in the parameters of regression models, which can lead to huge forecasting errors and unreliability of the model in general. This issue was popularised by David Hendry, who argued that lack of stability of coefficients frequently caused forecast failure, and therefore we must routinely test for structural stability. Structural stability − i.e., the time-invariance of regression coefficients − is a central issue in all applications of linear regression models.
In statistics, the Breusch–Godfrey test, named after Trevor S. Breusch and Leslie G. Godfrey, is used to assess the validity of some of the modelling assumptions inherent in applying regression-like models to observed data series. In particular, it tests for the presence of serial correlation that has not been included in a proposed model structure and which, if present, would mean that incorrect conclusions would be drawn from other tests, or that sub-optimal estimates of model parameters are obtained if it is not taken into account. The regression models to which the test can be applied include cases where lagged values of the dependent variables are used as independent variables in the model's representation for later observations. This type of structure is common in econometric models.
An error correction model belongs to a category of multiple time series models most commonly used for data where the underlying variables have a long-run stochastic trend, also known as cointegration. ECMs are a theoretically-driven approach useful for estimating both short-term and long-term effects of one time series on another. The term error-correction relates to the fact that last-period's deviation from a long-run equilibrium, the error, influences its short-run dynamics. Thus ECMs directly estimate the speed at which a dependent variable returns to equilibrium after a change in other variables.
A Newey–West estimator is used in statistics and econometrics to provide an estimate of the covariance matrix of the parameters of a regression-type model when this model is applied in situations where the standard assumptions of regression analysis do not apply. It was devised by Whitney K. Newey and Kenneth D. West in 1987, although there are a number of later variants. The estimator is used to try to overcome autocorrelation, and heteroskedasticity in the error terms in the models, often for regressions applied to time series data.
The methodology of econometrics is the study of the range of differing approaches to undertaking econometric analysis.

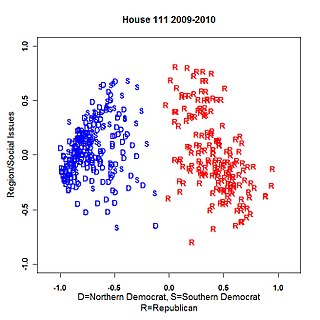
NOMINATE is a multidimensional scaling application developed by political scientists Keith T. Poole and Howard Rosenthal in the early 1980s to analyze preferential and choice data, such as legislative roll-call voting behavior. As computing capabilities grew, Poole and Rosenthal developed multiple iterations of their NOMINATE procedure: the original D-NOMINATE method, W-NOMINATE, and most recently DW-NOMINATE. In 2009, Poole and Rosenthal were named the first recipients of the Society for Political Methodology's Best Statistical Software Award for their development of NOMINATE, a recognition conferred to "individual(s) for developing statistical software that makes a significant research contribution". In 2016, Keith T. Poole was awarded the Society for Political Methodology's Career Achievement Award. The citation for this award reads, in part, "One can say perfectly correctly, and without any hyperbole: the modern study of the U.S. Congress would be simply unthinkable without NOMINATE legislative roll call voting scores. NOMINATE has produced data that entire bodies of our discipline—and many in the press—have relied on to understand the U.S. Congress."
Philip Hans B. F. Franses is a Dutch economist and Professor of Applied Econometrics and Marketing Research at the Erasmus University Rotterdam, and dean of the Erasmus School of Economics, especially known for his 1998 work on "Nonlinear Time Series Models in Empirical Finance."
In signal processing, multidimensional signal processing covers all signal processing done using multidimensional signals and systems. While multidimensional signal processing is a subset of signal processing, it is unique in the sense that it deals specifically with data that can only be adequately detailed using more than one dimension. In m-D digital signal processing, useful data is sampled in more than one dimension. Examples of this are image processing and multi-sensor radar detection. Both of these examples use multiple sensors to sample signals and form images based on the manipulation of these multiple signals. Processing in multi-dimension (m-D) requires more complex algorithms, compared to the 1-D case, to handle calculations such as the Fast Fourier Transform due to more degrees of freedom. In some cases, m-D signals and systems can be simplified into single dimension signal processing methods, if the considered systems are separable.

Antony Davies is an American economist, speaker, and author.


