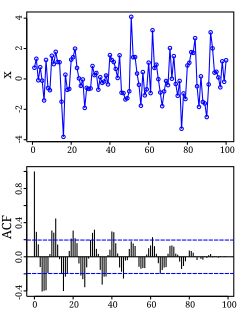
Autocorrelation, also known as serial correlation, is the correlation of a signal with a delayed copy of itself as a function of delay. Informally, it is the similarity between observations as a function of the time lag between them. The analysis of autocorrelation is a mathematical tool for finding repeating patterns, such as the presence of a periodic signal obscured by noise, or identifying the missing fundamental frequency in a signal implied by its harmonic frequencies. It is often used in signal processing for analyzing functions or series of values, such as time domain signals.
Studies that are in vivo are those in which the effects of various biological entities are tested on whole, living organisms or cells, usually animals, including humans, and plants, as opposed to a tissue extract or dead organism. This is not to be confused with experiments done in vitro, i.e., in a laboratory environment using test tubes, Petri dishes, etc. Examples of investigations in vivo include: the pathogenesis of disease by comparing the effects of bacterial infection with the effects of purified bacterial toxins; the development of non-antibiotics, antiviral drugs, and new drugs generally; and new surgical procedures. Consequently, animal testing and clinical trials are major elements of in vivo research. In vivo testing is often employed over in vitro because it is better suited for observing the overall effects of an experiment on a living subject. In drug discovery, for example, verification of efficacy in vivo is crucial, because in vitro assays can sometimes yield misleading results with drug candidate molecules that are irrelevant in vivo.

In statistics, dependence or association is any statistical relationship, whether causal or not, between two random variables or bivariate data. In the broadest sense correlation is any statistical association, though in common usage it most often refers to how close two variables are to having a linear relationship with each other. Familiar examples of dependent phenomena include the correlation between the physical statures of parents and their offspring, and the correlation between the demand for a limited supply product and its price.

In statistics, the Gauss–Markov theorem, named after Carl Friedrich Gauss and Andrey Markov, states that in a linear regression model in which the errors have expectation zero, are uncorrelated and have equal variances, the best linear unbiased estimator (BLUE) of the coefficients is given by the ordinary least squares (OLS) estimator, provided it exists. Here "best" means giving the lowest variance of the estimate, as compared to other unbiased, linear estimators. The errors do not need to be normal, nor do they need to be independent and identically distributed. The requirement that the estimator be unbiased cannot be dropped, since biased estimators exist with lower variance. See, for example, the James–Stein estimator or ridge regression.

In statistics, the Pearson correlation coefficient, also referred to as Pearson's r, the Pearson product-moment correlation coefficient (PPMCC) or the bivariate correlation, is a measure of the linear correlation between two variables X and Y. According to the Cauchy–Schwarz inequality it has a value between +1 and −1, where 1 is total positive linear correlation, 0 is no linear correlation, and −1 is total negative linear correlation. It is widely used in the sciences. It was developed by Karl Pearson from a related idea introduced by Francis Galton in the 1880s and for which the mathematical formula was derived and published by Auguste Bravais in 1844.. The naming of the coefficient is thus an example of Stigler's Law.

In statistics, the standard score is the signed fractional number of standard deviations by which the value of an observation or data point is above the mean value of what is being observed or measured. Observed values above the mean have positive standard scores, while values below the mean have negative standard scores.
In statistics, the logistic model is a widely used statistical model that, in its basic form, uses a logistic function to model a binary dependent variable; many more complex extensions exist. In regression analysis, logistic regression is estimating the parameters of a logistic model; it is a form of binomial regression. Mathematically, a binary logistic model has a dependent variable with two possible values, such as pass/fail, win/lose, alive/dead or healthy/sick; these are represented by an indicator variable, where the two values are labeled "0" and "1". In the logistic model, the log-odds for the value labeled "1" is a linear combination of one or more independent variables ("predictors"); the independent variables can each be a binary variable or a continuous variable. The corresponding probability of the value labeled "1" can vary between 0 and 1, hence the labeling; the function that converts log-odds to probability is the logistic function, hence the name. The unit of measurement for the log-odds scale is called a logit, from logistic unit, hence the alternative names. Analogous models with a different sigmoid function instead of the logistic function can also be used, such as the probit model; the defining characteristic of the logistic model is that increasing one of the independent variables multiplicatively scales the odds of the given outcome at a constant rate, with each dependent variable having its own parameter; for a binary independent variable this generalizes the odds ratio.

In statistics, Spearman's rank correlation coefficient or Spearman's rho, named after Charles Spearman and often denoted by the Greek letter (rho) or as , is a nonparametric measure of rank correlation. It assesses how well the relationship between two variables can be described using a monotonic function.

In statistics, canonical-correlation analysis is a way of inferring information from cross-covariance matrices. If we have two vectors X = (X1, ..., Xn) and Y = (Y1, ..., Ym) of random variables, and there are correlations among the variables, then canonical-correlation analysis will find linear combinations of X and Y which have maximum correlation with each other. T. R. Knapp notes that "virtually all of the commonly encountered parametric tests of significance can be treated as special cases of canonical-correlation analysis, which is the general procedure for investigating the relationships between two sets of variables." The method was first introduced by Harold Hotelling in 1936, although in the context of angles between flats the mathematical concept was published by Jordan in 1875.

Bioequivalence is a term in pharmacokinetics used to assess the expected in vivo biological equivalence of two proprietary preparations of a drug. If two products are said to be bioequivalent it means that they would be expected to be, for all intents and purposes, the same.

In statistics, the coefficient of determination, denoted R2 or r2 and pronounced "R squared", is the proportion of the variance in the dependent variable that is predictable from the independent variable(s).
In statistics, econometrics, epidemiology and related disciplines, the method of instrumental variables (IV) is used to estimate causal relationships when controlled experiments are not feasible or when a treatment is not successfully delivered to every unit in a randomized experiment. Intuitively, IVs are used when an explanatory variable of interest is correlated with the error term, in which case ordinary least squares and ANOVA give biased results. A valid instrument induces changes in the explanatory variable but has no independent effect on the dependent variable, allowing a researcher to uncover the causal effect of the explanatory variable on the dependent variable.
In statistics, ordinary least squares (OLS) is a type of linear least squares method for estimating the unknown parameters in a linear regression model. OLS chooses the parameters of a linear function of a set of explanatory variables by the principle of least squares: minimizing the sum of the squares of the differences between the observed dependent variable in the given dataset and those predicted by the linear function.
In statistics, simple linear regression is a linear regression model with a single explanatory variable. That is, it concerns two-dimensional sample points with one independent variable and one dependent variable and finds a linear function that, as accurately as possible, predicts the dependent variable values as a function of the independent variables. The adjective simple refers to the fact that the outcome variable is related to a single predictor.
The Biopharmaceutics Classification System is a system to differentiate the drugs on the basis of their solubility and permeability.

Wolfe Laboratories, Inc. (WLI) is a contract research organization (CRO) headquartered in Woburn, Massachusetts. It provides research and development services as well as GLP analytical services for products in late discovery phase through early clinical phases of drug development. It serves clients in New England, the US and internationally. Laboratory operations take place in a large 21,000-square-foot (2,000 m2) facility.
Simulations Plus, Inc. develops absorption, distribution, metabolism, excretion, and toxicity (ADMET) modeling and simulation software for the pharmaceutical and biotechnology, industrial chemicals, cosmetics, food ingredients, and herbicide industries. In September 2014, the company acquired Cognigen Corporation, a leading provider of clinical trial data analysis and consulting services.
In the field of pharmacokinetics, the area under the curve (AUC) is the definite integral in a plot of drug concentration in blood plasma vs. time. In practice, the drug concentration is measured at certain discrete points in time and the trapezoidal rule is used to estimate AUC.
Drug manufacturing is the process of industrial-scale synthesis of pharmaceutical drugs by pharmaceutical companies. The process of drug manufacturing can be broken down into a series of unit operations, such as milling, granulation, coating, tablet pressing, and others.
In robust statistics, repeated median regression, also known as the repeated median estimator, is a robust linear regression algorithm.

