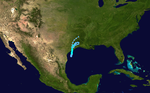
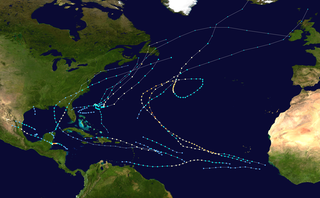
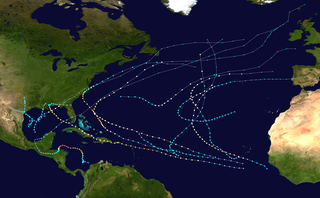
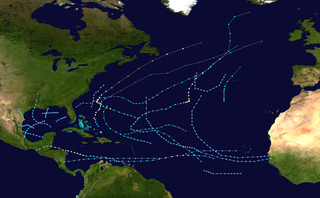
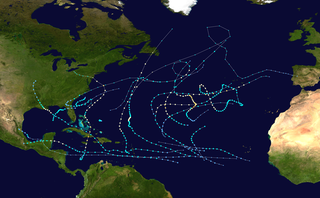
The 1989 Atlantic hurricane season was an average hurricane season with 11named storms. The season officially began on June1, and ended on November30.[1][2] The first tropical cyclone, Tropical Depression One, developed on June15, and dissipated two days later without any effects on land. Later that month, Tropical Storm Allison caused severe flooding, especially in Texas and Louisiana. Tropical Storm Barry, Tropical Depressions Six, Nine, and Thirteen, and Hurricanes Erin and Felix caused negligible impact. Hurricane Gabrielle and Tropical Storm Iris caused light effects on land, with the former resulting in nine fatalities from rip currents offshore the East Coast of the United States and Atlantic Canada, while the latter produced minor flooding in the United States Virgin Islands.
The most notable storm of the season was Hurricane Hugo, which became the costliest Atlantic hurricane on record at the time (surpassed by Hurricane Andrew in 1992), causing $9.47billion (1989USD)[nb 1] in damage and 88fatalities as it ravaged some of the Leeward Islands and the United States, especially the state of South Carolina as a Category4 hurricane.[3] Few other storms in 1989 caused significant damage; hurricanes Chantal and Jerry both resulted in flooding and wind impacts in Texas. Hurricane Dean also caused light damage in Bermuda and the Canadian province of Newfoundland. Tropical Storm Karen, the final storm of the season, brought heavy rainfall and a tornado to Cuba, before dissipating on December4. Overall, the storms of the season collectively caused 136fatalities and at least $10.2billion in damage.
Seasonal forecasts
Pre-season forecasts
Predictions of tropical activity in the 1989 season
Forecasts of hurricane activity are issued before each hurricane season by noted hurricane experts such as William M. Gray and his associates at Colorado State University (CSU). A normal season as defined by the National Oceanic and Atmospheric Administration (NOAA), has eleven named storms, of which six reach hurricane strength and two of those become major hurricanes.[nb 2][7] On May 31, 1989, the CSU forecast that there would be seven named storms, four of which would intensify into a hurricane; there was no prediction of the number of major hurricanes.[1] Prior to the season, the Weather Research Center (WRC) in Houston, Texas also issued a forecast, which called for ten named storms and six hurricanes.[4]
Season summary
The Atlantic hurricane season officially began on June 1, 1989.[1] It was an above average season in which 15 tropical depressions formed. Eleven depressions attained tropical storm status, and seven of these attained hurricane status. Two hurricanes further intensified into major hurricanes. The season was above average most likely because of relatively small amounts of dust within the Saharan Air Layer. Four hurricanes and one tropical storm made landfall during the season[8] and caused 124deaths and at least $10.2billion in damage.[9][10][11][12][13][14][15][16][17][18][19] The last storm of the season, Tropical Storm Karen, dissipated on December 4,[8] four days after the official end of the season on November 30.[2]
Tropical cyclogenesis in the 1989 Atlantic hurricane season began with a tropical depression developing on June 16. Later that month, another tropical depression developed, and intensified, eventually becoming Tropical Storm Allison. After June, the month of July was slightly more active with three tropical depressions developing; however, the latter two (Hurricane Chantal and Hurricane Dean) did not form until extremely late in the month. August was the most active month of the season, with a total of seven tropical cyclones either existing or developing in that period.[8] Although September is the climatological peak of hurricane season,[2] only two tropical cyclones developed in that month, which later become Hurricane Hugo and Tropical Storm Iris. Two tropical cyclones also developed in October, and the latter one in that month eventually became Hurricane Jerry. Finally, one tropical cyclone developed in November; it eventually became Tropical Storm Karen and lasted until December4.[8]
The season's activity was reflected with a cumulative accumulated cyclone energy (ACE) rating of 135,[6] which is classified as "above normal".[7] ACE is, broadly speaking, a measure of the power of the hurricane multiplied by the length of time it existed, so storms that last a long time, as well as particularly strong hurricanes, have high ACEs. It is only calculated for full advisories on tropical systems at or exceeding 39mph (63km/h), which is tropical storm intensity.[20]
A frontal system developed into Tropical Depression One at 1800UTC on June15,[21][22] while located about 160 miles (260km) northeast of Veracruz, Veracruz. The depression initially headed northeastward, before curving southward on June16. It peaked with winds of 30mph (50km/h). Early on June17, the depression dissipated about 85miles (140km) northeast of Coatzacoalcos, Veracruz.[21]
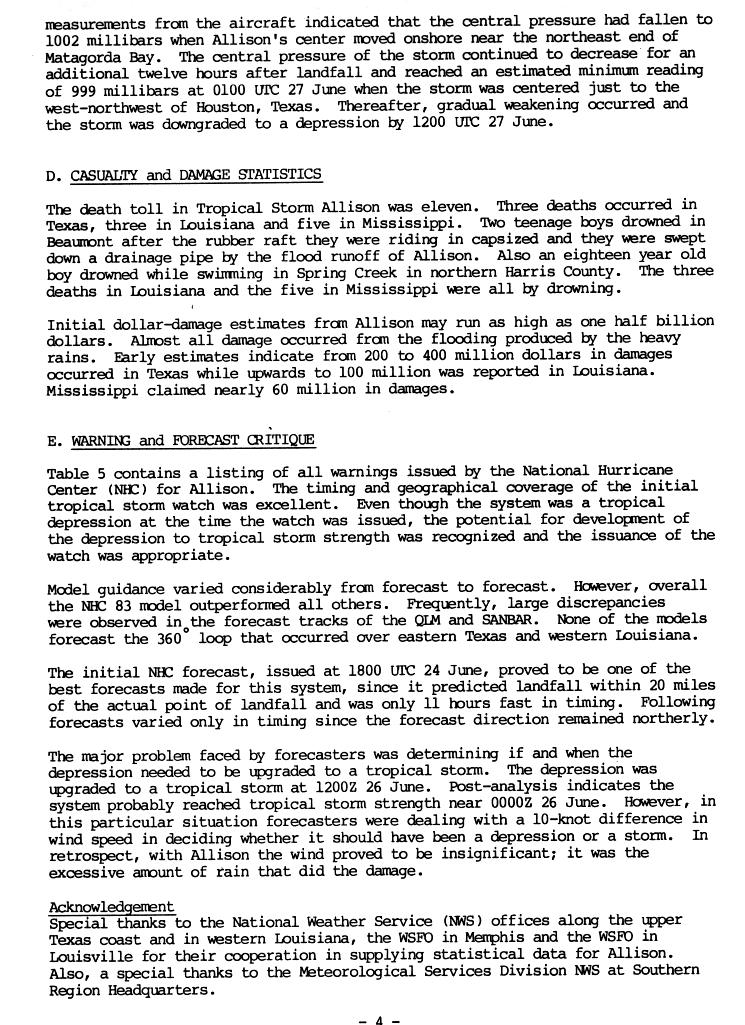
The second tropical depression developed on June24 in the northwestern Gulf of Mexico, from the interaction of a tropical wave and the remnants of eastern Pacific Hurricane Cosme. Heading northward, it slowly intensified, becoming Tropical Storm Allison early on June26.[23] Allison continued to slowly intensify, and made landfall near Freeport with winds of 50mph (80km/h) on the following day. Moving inland, Allison rapidly weakened over eastern Texas, and transitioned into an extratropical storm on June28. Although it rapidly became extratropical over land, the remnants of Allison meandered over the Southern United States and reached as far north as Indiana. The remnants turned south and then west-northwest after reaching Mississippi, before finally dissipating over Arkansas on July7.[24]
Allison caused significant flooding in several states, especially Louisiana and Texas. Precipitation from the storm peaked at 25.27 inches (642mm) in Winnfield, Louisiana.[25] As a result, more than 1,200structures in Louisiana were flooded and over 430,000acres of crops were ruined, mostly soybeans and cotton. Three drowning fatalities were also reported. Several tornadoes were spawned in the state, the worst occurred in Ouachita Parish. It destroyed 5homes, severely damaged 10others, and inflicted minor impact on 100houses. In Texas, flooding was more severe. More than 6,200homes received water damage, forcing hundreds of residents to evacuate and stranding thousands of other people.[26] Three deaths occurred in Texas, all of which were teenage boys that drowned. In Mississippi, the storm caused $60million in losses and five drowning deaths. Widespread, but mostly minor flooding was reported elsewhere in the Eastern United States. Overall, damage was estimated to have reached $360–560million and 11people were killed.[9]
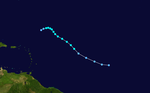
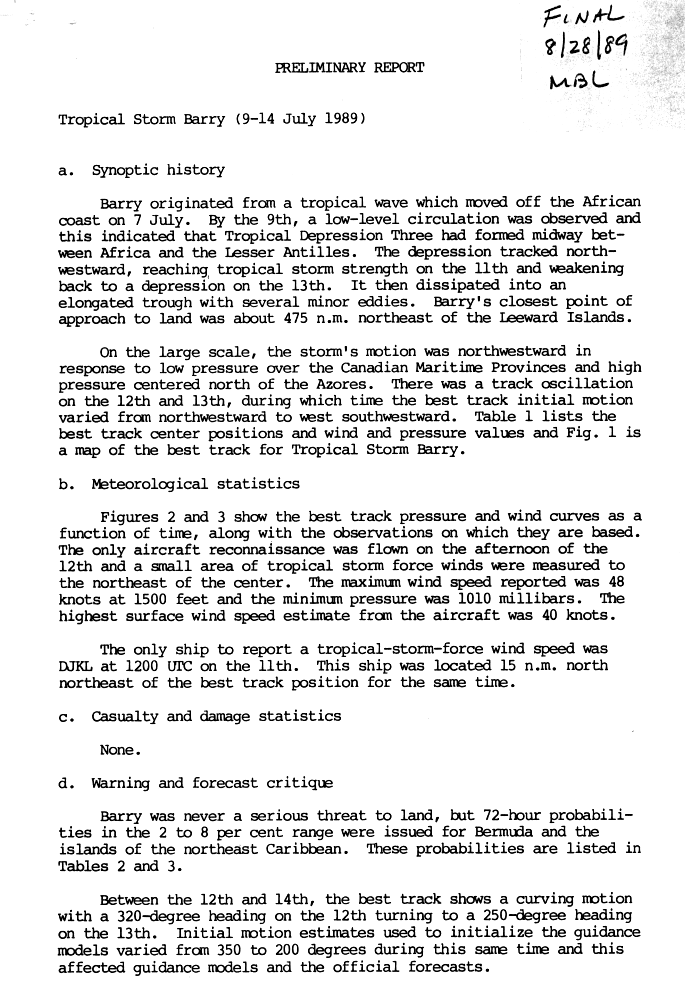
A tropical wave emerged into the Atlantic Ocean from the west coast of Africa on July7. The wave quickly developed a low-level circulation by July9 and was designated Tropical Depression Three at 1800UTC, while located about midway between Africa and the Lesser Antilles. The depression moved northwestward in response to an area of high pressure located north of the Azores. The depression strengthened and was upgraded to Tropical Storm Barry on July11. It slowly intensified and reached its peak intensity of 50mph (80km/h) the next day. By July13, Barry weakened back to a depression and dissipated shortly after while located 545miles (880km) northeast of the Lesser Antilles.[27]
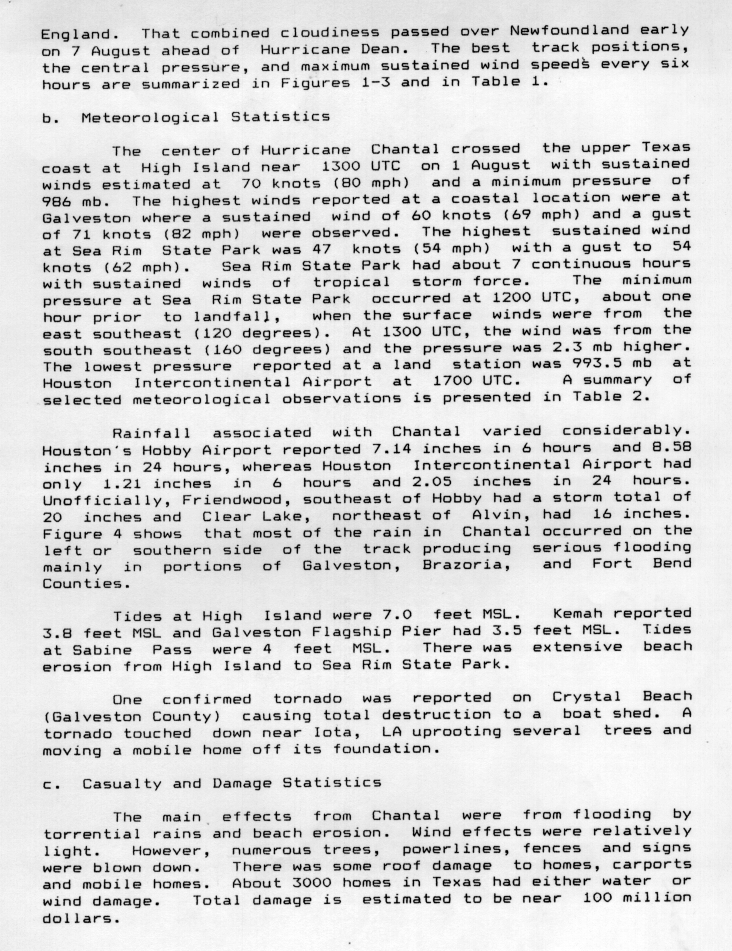
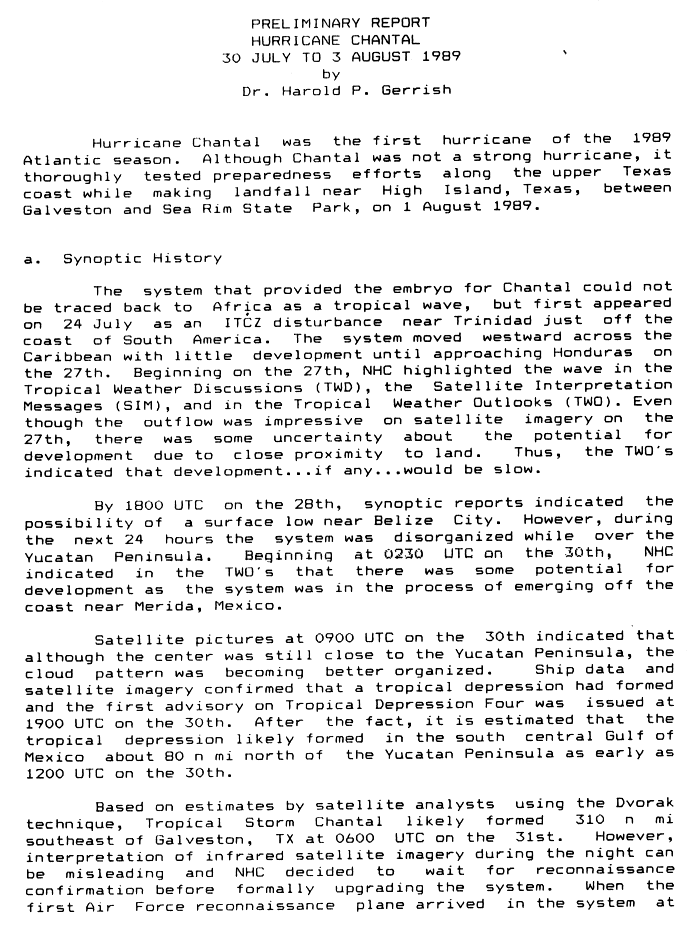
In late July, a tropical disturbance within the Intertropical Convergence Zone (ITCZ) was first observed near Trinidad and Tobago. The disturbance later reached the Gulf of Mexico and developed into a tropical depression on July30. While heading north-northwestward, the depression intensified and was upgraded to Tropical Storm Chantal on the following day. Thereafter, Chantal quickly strengthened and became a hurricane on August1. After intensifying slightly further, it made landfall near High Island, Texas later that day. The storm quickly weakened upon moving inland and fell to tropical storm intensity a few hours after landfall. Early on August 2, Chantal weakened to a tropical depression and dissipated over Oklahoma by August 4.[28]
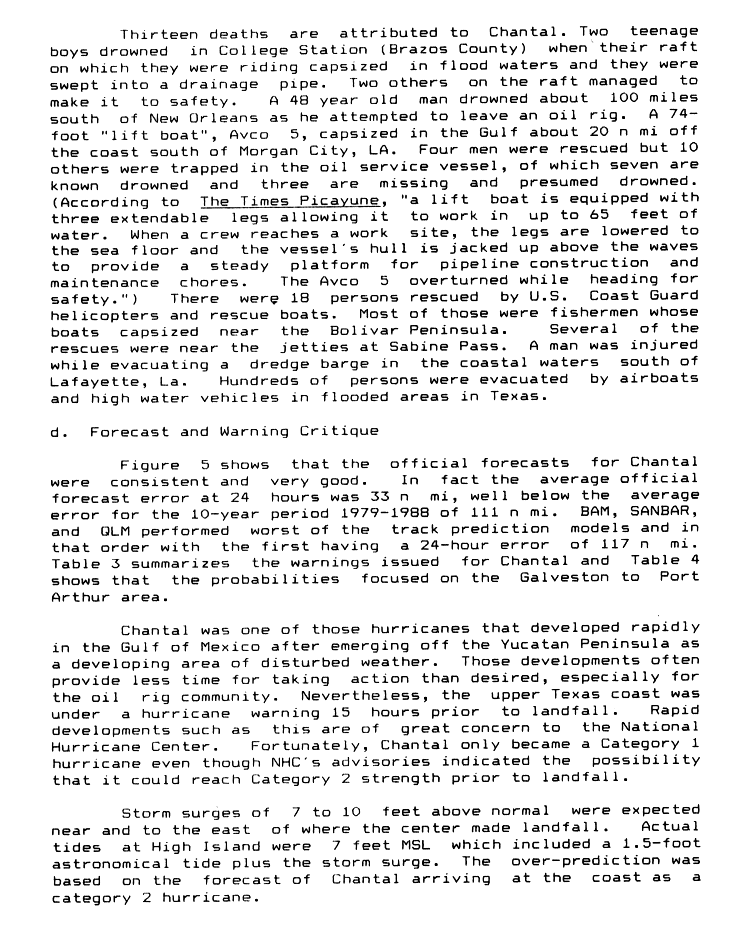
While making landfall in Texas, the storm produced relatively small tides, with most locations reporting waves less than 4feet (1.2m) in height. However, some locations experienced extensive beach erosion.[29] In addition, there were numerous rescues made by the U.S. Coast Guard.[30] Due to both rainfall and high winds at least 3,000homes were damaged, and numerous trees and sign were knocked down. Two tornadoes were reported, with one wrecking a shed in Crystal Beach, Texas, and the other knocking over several trees and mobile homes in Iota, Louisiana. Elsewhere, Chantal and its remnants brought light to moderate rainfall to several other states, although affects were minor in other states.[29] Overall, 13fatalities occurred, all of which due to drowning,[30] and at least $100million in damage was reported.[29]
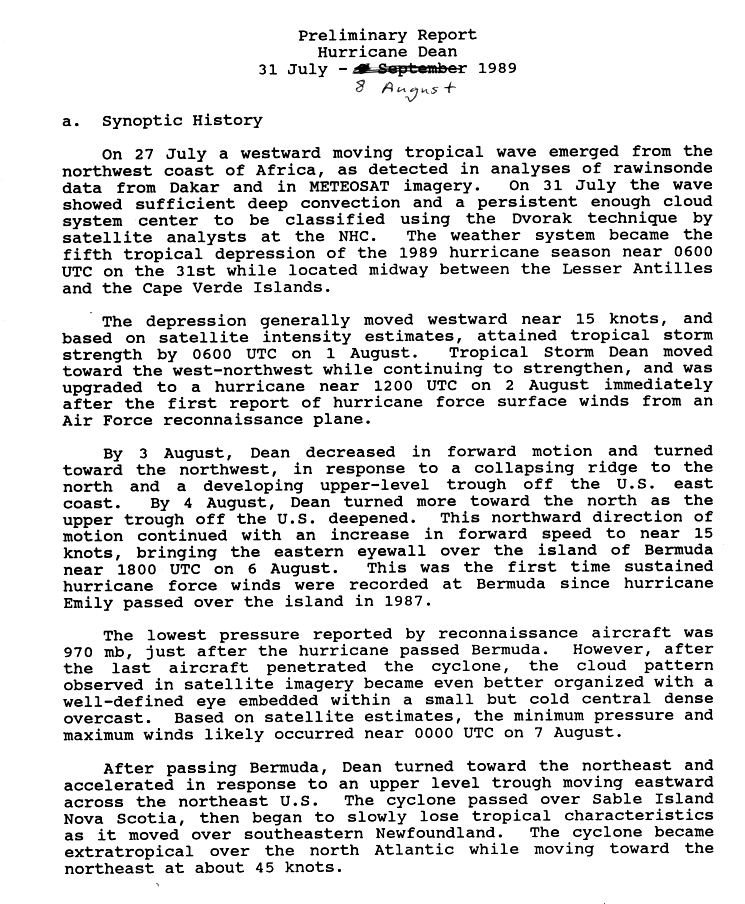
A tropical wave developed into Tropical Depression Five on July31, while situated about halfway between Cape Verde and the Lesser Antilles. The following day, the depression intensified into Tropical Storm Dean. Heading generally west-northwestward, Dean intensified into a hurricane on August2. The storm remained a Category1 hurricane as it curved northward, bypassing the Lesser Antilles. Tracking northward, Dean accelerated and intensified into a Category2 hurricane while bypassing Bermuda late on August6. Thereafter, Dean turned northeastward and weakened to a tropical storm, before making landfall in southern Newfoundland on August8. The storm continued in the northeast direction and lost tropical characteristics south of Greenland on the following day.[31]
As Dean approached the Lesser Antilles, heavy rainfall and strong winds were reported in Antigua and Barbuda. However, no damage was reported. In Bermuda, winds gusted up to 113mph (182km/h) and 3–5inches (76.2–127mm) of precipitation fell. Although Dean caused no fatalities, 16people were injured. According to insurance claims, the storm damaged 648buildings, 72boats, 36vehicles, and one pier. Additionally, strong winds downed power lines, leaving 65,000people without electricity. Overall, damage on the island was approximately $8.9million, with $3.9million incurred at the Naval Air Station Bermuda Annex. Storm surge up to 1.7 feet (0.52m) occurred in India, though no significant erosion was reported.[32] In Atlantic Canada, light to moderate rainfall was reported, and tropical storm force winds were observed in some areas.[33] Furthermore, waves at 26ft (7.92m) were reported on Sable Island.[34]
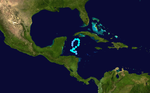
Tropical Depression Six
Tropical depression(SSHWS)
Duration
August 8– August 17
Peak intensity
35mph (55km/h) (1-min);
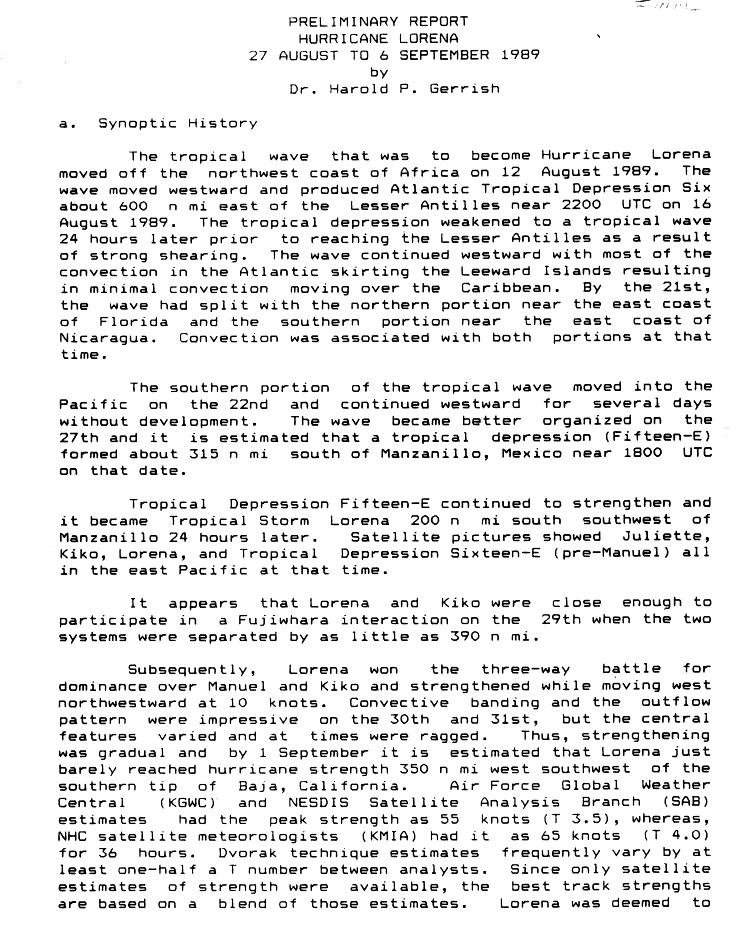
A tropical wave developed into Tropical Depression Six on August8, while located about 125miles (200km) east of easternmost islands of Cape Verde.[21] While approaching the Lesser Antilles, a tropical storm watch was issued. However, an upper-level low increased wind shear on the system.[22] As a result, the depression degenerated into a tropical wave on August17. The wave eventually split in two, with the southern part eventually becoming Hurricane Lorena in the eastern Pacific Ocean.[35]
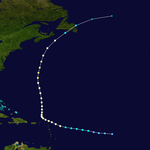
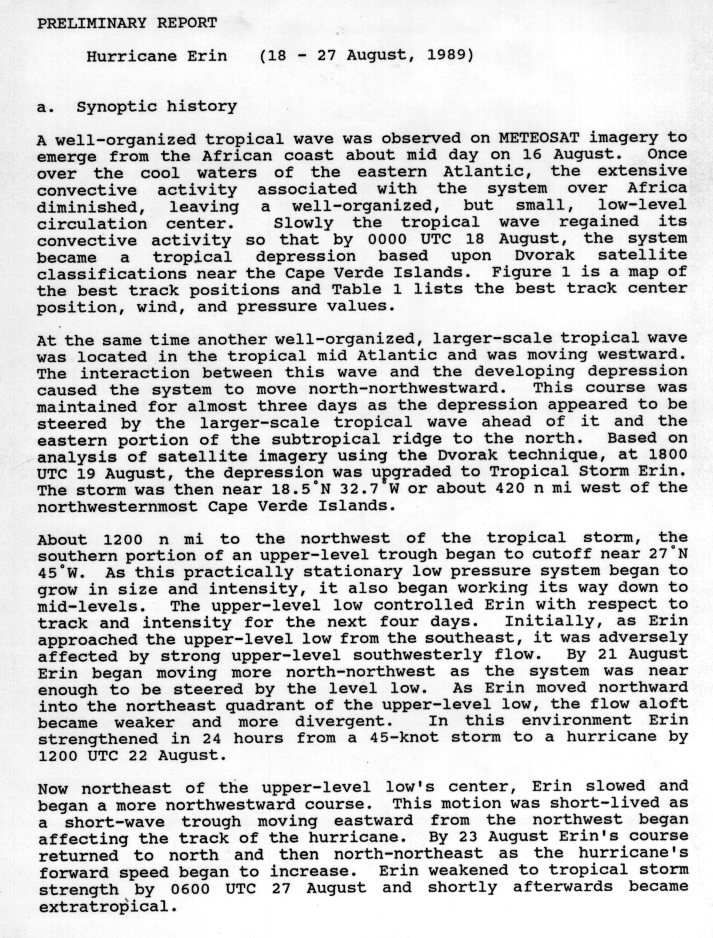
An organized tropical wave emerged into the Atlantic Ocean from the west coast of Africa on August16. Convection diminished due to cooler sea surface temperatures, but a small, well-defined low-level circulation remained. The convection later redeveloped, and the system became a tropical depression early on August18, while located just southeast of Cape Verde. Thereafter, the interaction between the tropical depression, a tropical wave, and a subtropical system caused it to move north-northwestward. The depression strengthened and was upgraded to Tropical Storm Erin at 1800UTC on August19.[36]
Erin continued to move north-northwestward, until curving northward on August21. The storm intensified into a hurricane on August22, after being in the northeastern quadrant of an upper-level low, which caused the flow aloft to become more divergent. It slowed and began to move northwestward while northeast of the upper-level low. However, shortly thereafter, a wave moving westward forced Erin to move north and eventually north-northeastward. Early on August24, the storm strengthened into a Category2 hurricane. Later that day, Erin peaked with sustained winds of 105mph (170km/h). The storm then began to weaken and degenerated into a tropical storm on August27. Shortly thereafter, Erin transitioned into an extratropical cyclone over the far northern Atlantic.[36]
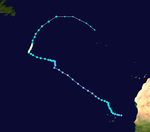
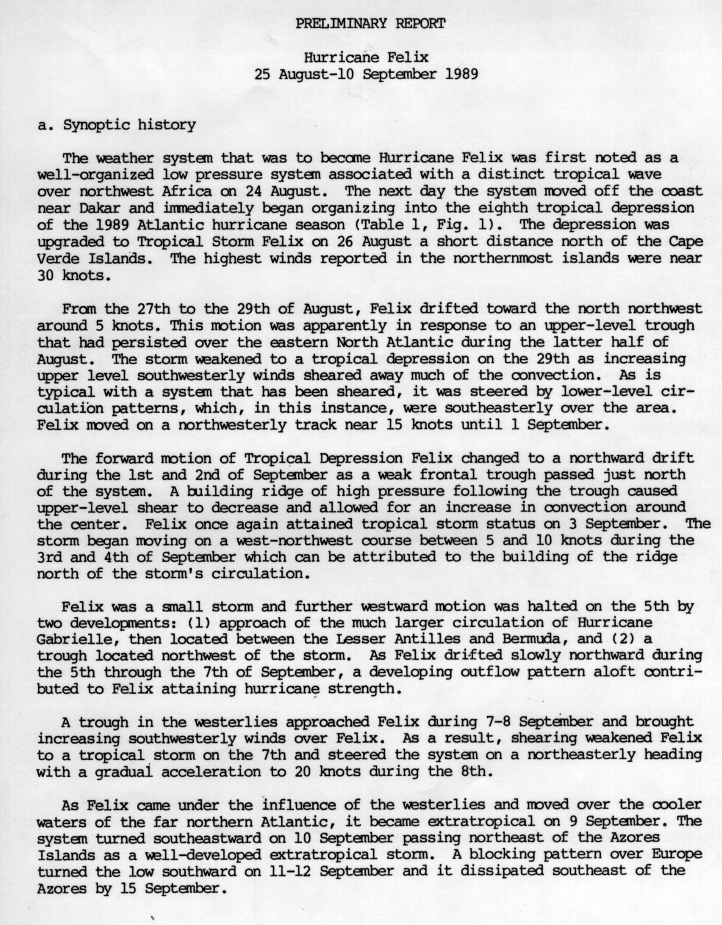
A tropical wave was observed over northwestern Africa on August24. By the following day, the system moved into the Atlantic Ocean near Dakar, Senegal. It immediately began organizing and became Tropical Depression Eight at 0000UTC on August26. The depression initially headed west-northwestward and strengthened into Tropical Storm Felix later that day. Shortly thereafter, the storm grazed Cape Verde, with some islands reporting sustained winds near 35mph (55km/h). Between August27 and August29, Felix drifted north-northwestward in response to a persistent upper-level trough. Southwesterly winds sheared away much of the deep convection, causing Felix to weaken back to a tropical depression on August29.[37]
The storm then headed northwestward, until a weak frontal trough turned Felix northward on September1. Wind shear decreased, allowing Felix to become a tropical storm again on September3. The storm continued to strengthen while moving west-northwestward and by early on September5, it became a hurricane. Later that day, Felix peaked with winds of 85mph (135km/h). Drifting north-northeastward, the storm eventually began to accelerate, after weakening back to a tropical storm on September7, due to colder sea surface temperatures and increasing wind shear. At 1200UTC on September9, Felix became extratropical while located well east of Cape Race, Newfoundland.[37] The remnants later curved east-southeastward and then dissipated on September10.[21]
Tropical Depression Nine
Tropical depression(SSHWS)
Duration
August 27– August 28
Peak intensity
30mph (45km/h) (1-min);
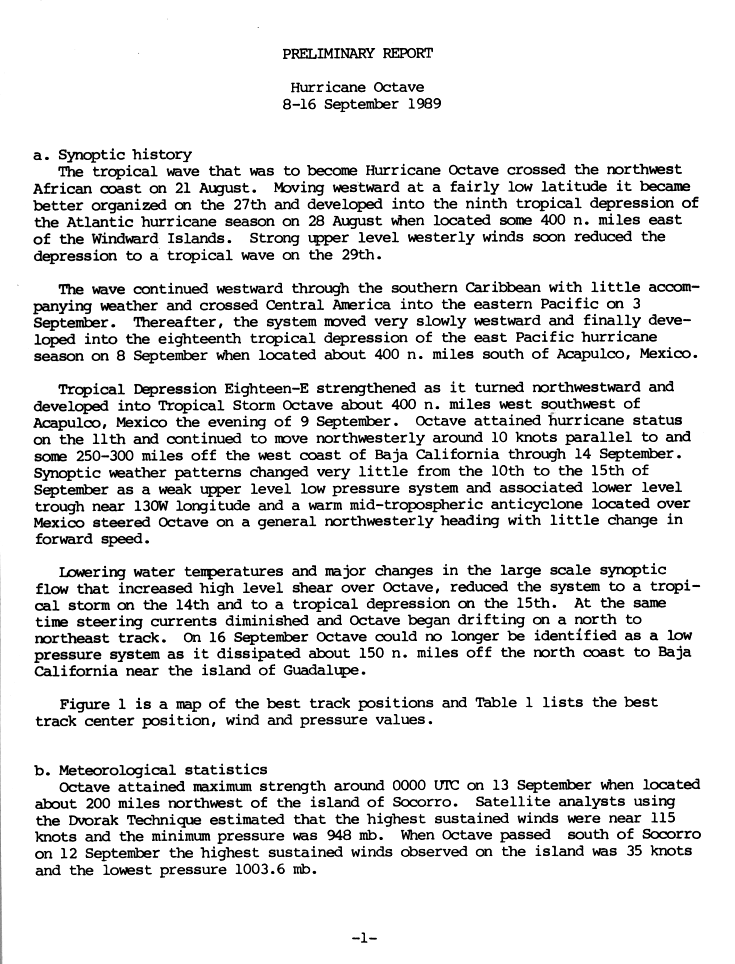
Tropical Depression Nine developed from a tropical wave 490mi (790km) east of Barbados on August27. However, on the following day, a reconnaissance aircraft did not indicate a low-level circulation. Thus, the depression degenerated back into a tropical wave.[22] Tropical Depression Nine did not re-develop in the Atlantic or the Caribbean Sea, although the remnants entered the Pacific and regenerated into Hurricane Octave on September8.[38]
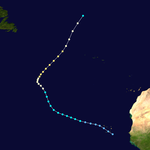
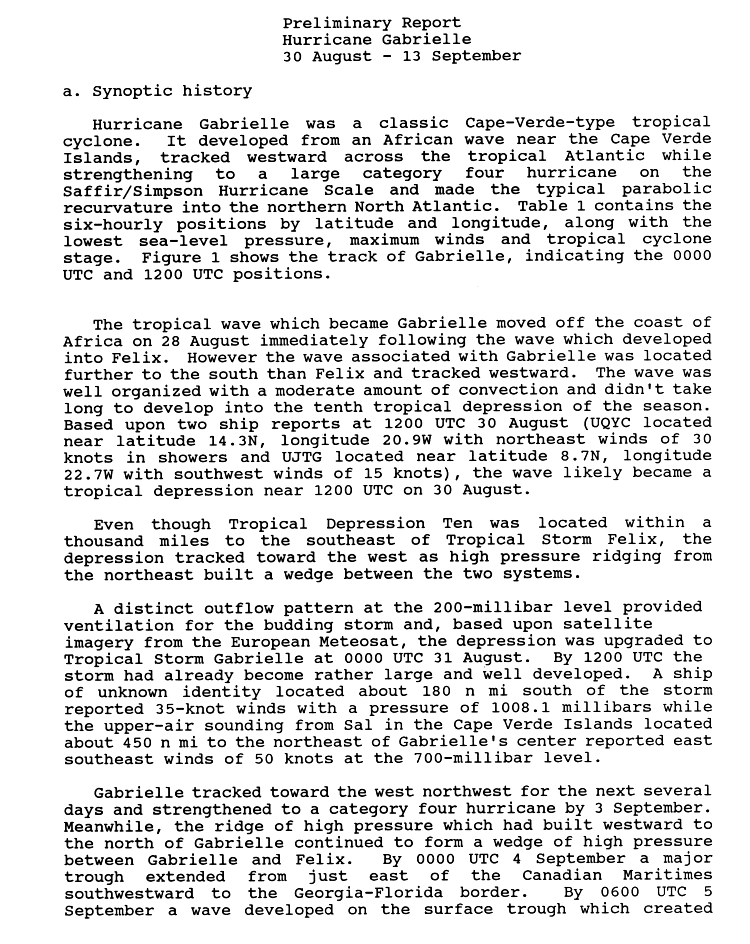
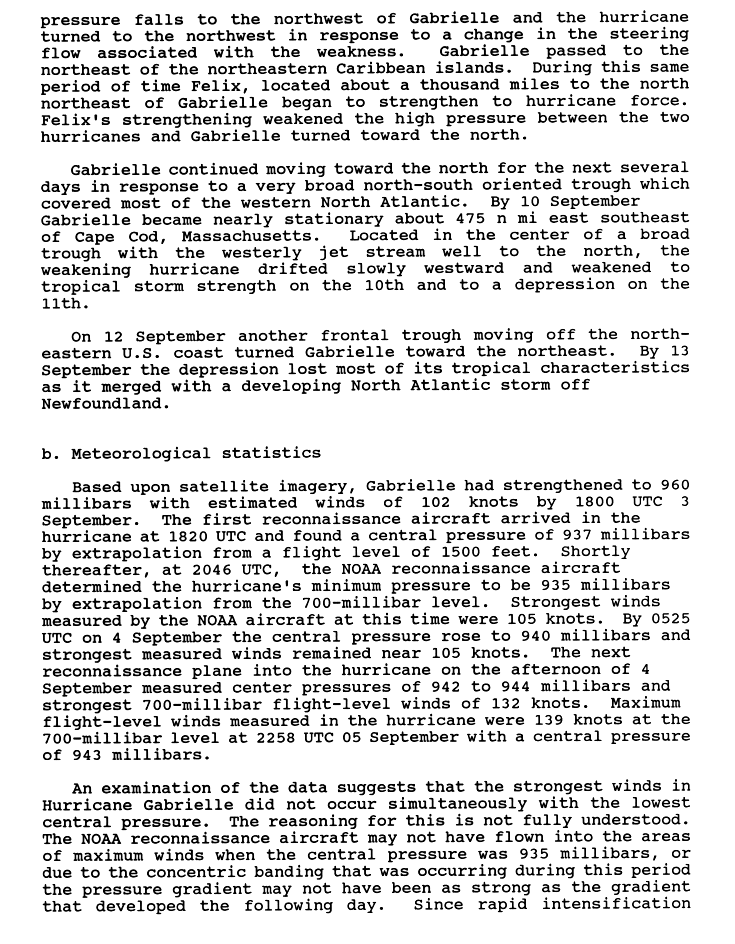
The tenth tropical depression of the season developed from a tropical wave on August30. The depression quickly intensified into Tropical Storm Gabrielle on the following day. Gabrielle moved generally westward, but curved slightly west-northwestward after intensifying into a hurricane on September1. Further intensification continued, and Gabrielle eventually peaked as a very strong Category4 hurricane on September5. After peaking with sustained winds of 145mph (235km/h), Gabrielle slowly curved nearly due north.[39] Gabrielle significantly weakened while heading northward, with sustained winds dropping from a high-end Category 4 hurricane to a strong Category3 hurricane within 12hours on September7. While weakening as it headed northward, Gabrielle bypassed the island of Bermuda early on September8.[40]
Gabrielle further weakened to a Category2 hurricane late on September8, and became nearly stationary roughly almost halfway between Bermuda and Cape Race, Newfoundland. Gabrielle then weakened to a tropical storm and headed due westward on September10. Thereafter, the storm made a sharp turn to the northeast on September11 and weakened to a tropical depression on the following day. By September13, the depression merged with a storm developing off Newfoundland.[40] Although it never approached land, Gabrielle was an extremely large and powerful storm that generated swells up to 20ft (6m) all the way from the Lesser Antilles to Canada.[41] On Dominica, severe erosion occurred on the east and north coasts.[42] Large waves responsible for eight deaths on the East Coast of the United States; almost all of the fatalities occurred in New England. In Nova Scotia, waves reached a height of 30ft (9m).[41] In addition, one fatality was reported in Canada, when a man drowned near Ketch Harbor, Nova Scotia.[43]
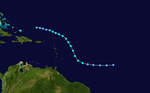
A westward moving tropical wave developed into Tropical Depression Eleven on September10, while located southeast of Cape Verde. It headed generally westward and intensified into Tropical Storm Hugo on September11. Hugo became a hurricane by September13. After becoming a major hurricane early on September15, rapid intensification commenced, and less than 24hours later, Hugo peaked as a Category5 hurricane as winds of 160mph (255km/h) and a minimum barometric pressure of 918mbar (27.1inHg). Six hours later, Hugo weakened back to a Category4 hurricane. After weakening on September17, Hugo entered the Caribbean Sea after passing between Guadeloupe and Montserrat with winds near 140mph (225km/h) and later made landfall on St. Croix at the same intensity. Hugo was further downgraded to a Category3 hurricane, before landfall on eastern Puerto Rico. The storm weakened to a Category2 hurricane on September18, after re-emerging into the Atlantic. As Hugo accelerated to the northwest, re-intensification occurred, and it eventually reached a secondary peak intensity as a low-end Category4 hurricane. Early on September22, Hugo made landfall near Charleston, South Carolina with winds of 140mph (225km/h). After landfall, Hugo rapidly weakened as it turned to the northeast, and transitioned into an extratropical cyclone in northwestern Pennsylvania on September23. The remnants continued rapidly northeastward, and dissipated on September25 near Greenland.[44]
The storm caused significant damage in Guadeloupe due to winds of 140mph (225km/h). Eleven fatalities and 107injuries were reported, while 10,000homes were destroyed, leaving 35,000people homeless. Crop losses were extreme, with the storm wiping out 100% of the banana crop, 50% of the sugar cane crop, and nearly all coconut crops. Ten people were killed on Montserrat, while 89others were injured. Damage on the island topped $260million. In Antigua, one person was killed and 30% of the homes damaged. Dominica suffered the loss of 80% of its banana crop, and landslides cut off many towns for days.[45] Two people were killed, 80were injured, and 90% of the buildings were damaged or destroyed on Saint Croix.[46] About 3,500people were left homeless.[47] Damage estimates for Saint Croix exceeded $1billion. Damage from erosion and crop losses in St. Kitts reached $43million and one fatality was reported. In Puerto Rico, the storm downed thousands of trees in the El Yunque National Forest and caused near complete destruction of coffee and damage crops.[46] Extreme damage also occurred at Ceiba, Culebra, Fajardo, and Luquillo.[47] Additionally, 28,000people were left homeless, 12deaths were reported, and losses exceeded $1billion.[46] In South Carolina alone, the Red Cross estimates that 3,307single family homes were destroyed, 18,171were inflicted major damage, and 56,580sustained minor impact. Additionally, more than 12,600mobile homes and 18,000multi-family houses were either damaged or destroyed.[48] There were 35deaths and about $5.9billion in damage in the state.[47][49] The most significant impact elsewhere in the United States occurred in North Carolina, where 205structure were destroyed, 1,149suffered major damage, and 2,638were inflicted minor impacts. There was one fatality and damages reached $1billion.[47] Overall, Hugo caused at least 88fatalities and $9.47billion in losses,[44][45][46][3][50] making it the costliest hurricane in the Atlantic basin, at the time.[47][50]
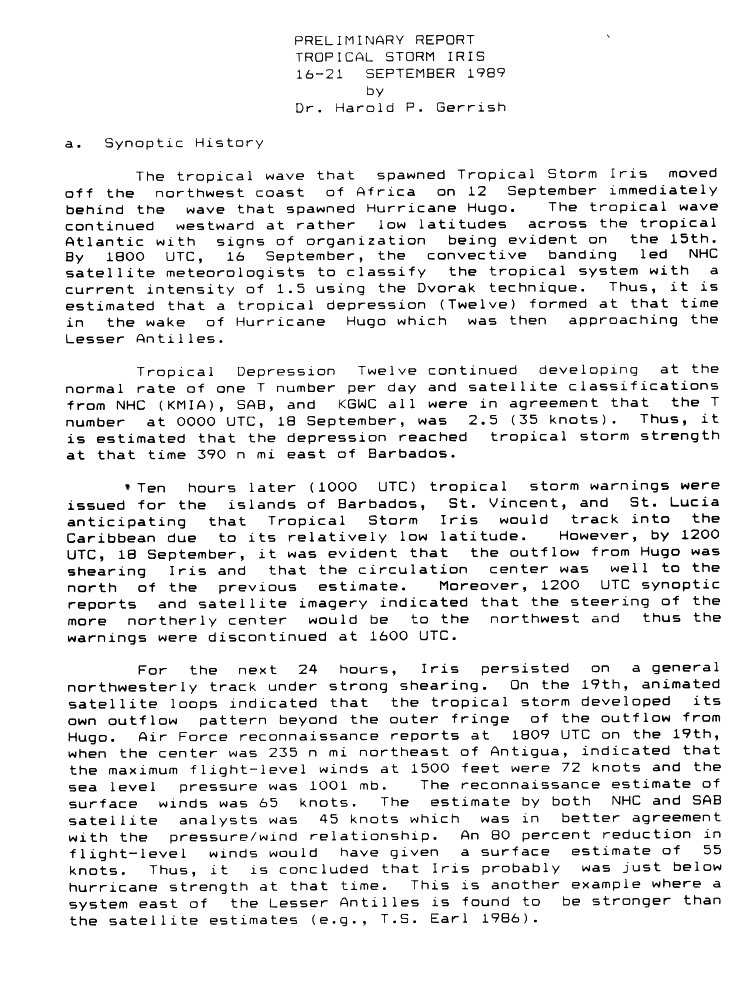
A tropical wave exited the west coast of Africa and entered the Atlantic Ocean on September12. After undergoing tropical cyclogenesis, a tropical depression developed around 18:00UTC on September16, while located about halfway between the Windward Islands and the Cape Verde islands. It slowly strengthened and intensified into Tropical Storm Iris early on September18. Thereafter, the storm turned north-northwestward and paralleled the Leeward Islands.[51] Initially, there was uncertainty in its path due to potential for a Fujiwhara interaction with Hugo.[52]
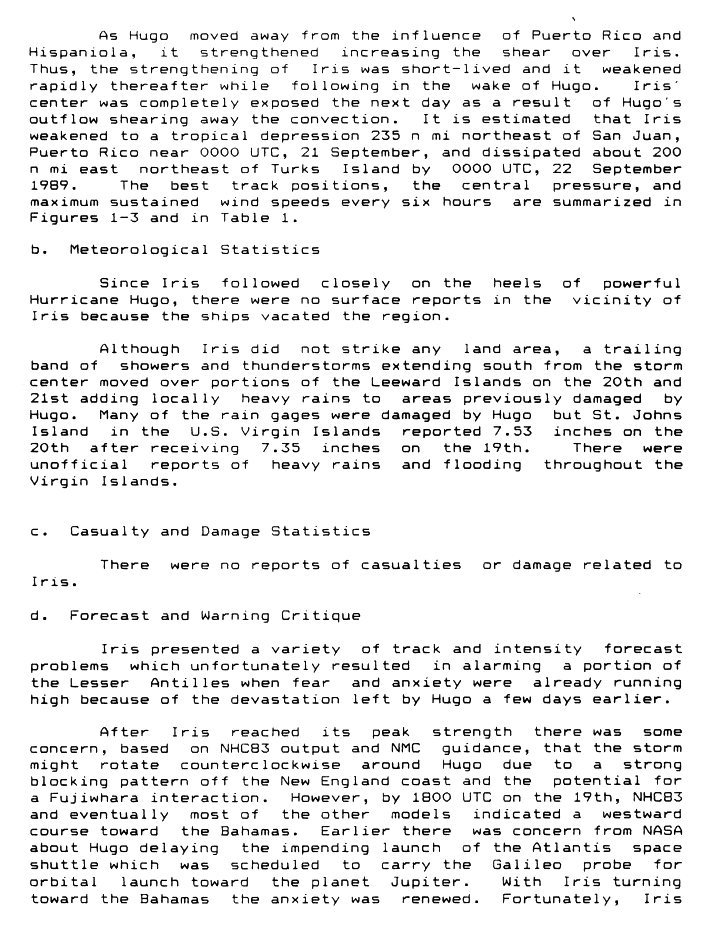
While passing east of the Lesser Antilles, Iris produced 7.53in (191mm) of rainfall on Saint John in the U.S. Virgin Islands, resulting in flooding. There were few reports of winds or precipitation on other islands, as Hugo destroyed observation stations a few days prior.[52] On September19, Iris attained its maximum sustained wind speed of 70mph (115km/h). Thereafter, the storm weakened due to increased wind shear from Hugo. On September21, the winds decreased below tropical storm force, after the center became exposed from the convection. The next day, Iris dissipated while approaching the Bahamas,[51] though a remnant circulation persisted and tracked toward southern Florida.[53]
Tropical Depression Thirteen
Tropical depression(SSHWS)
Duration
October 2– October 5
Peak intensity
35mph (55km/h) (1-min);
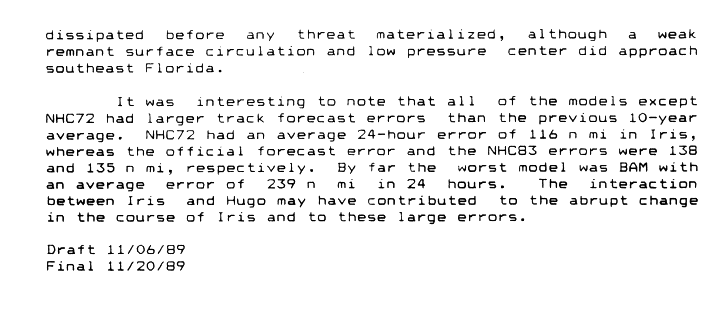
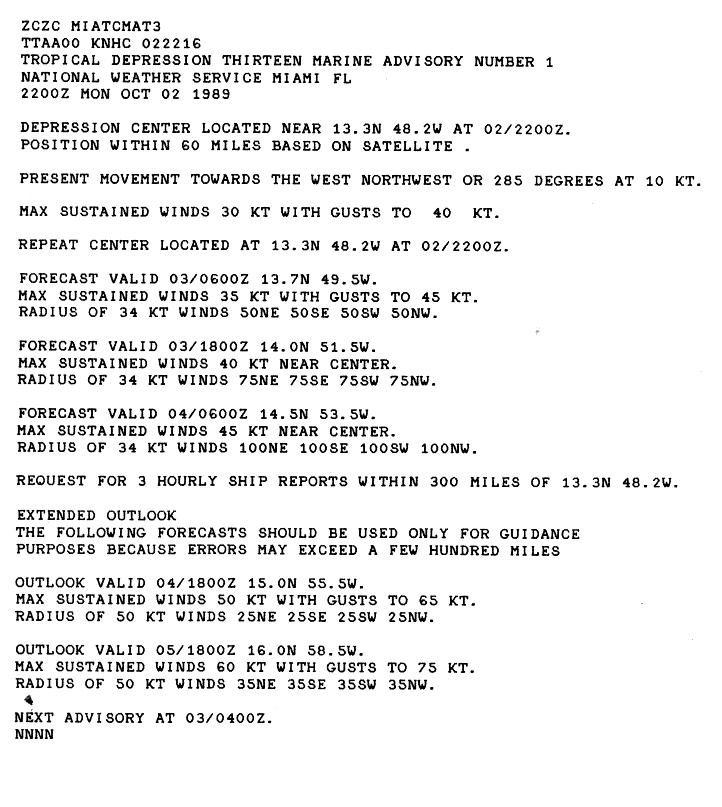
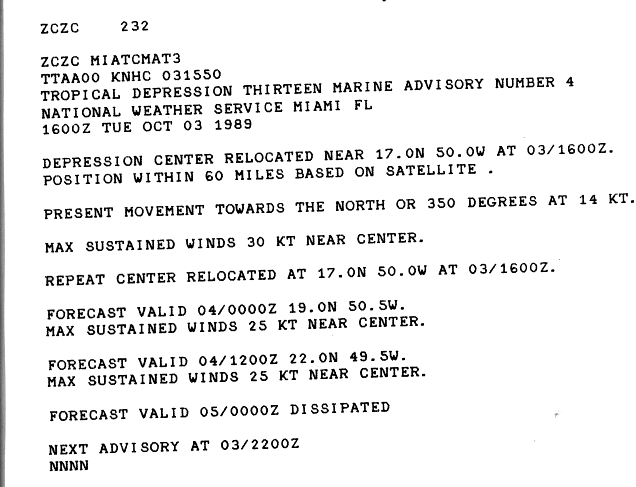
A tropical wave developed into Tropical Depression Thirteen on October2, while located a few hundred miles east of the Lesser Antilles.[22] Although the depression was predicted to intensify to near hurricane status by October5,[54] a mid-latitude trough increased wind shear, inducing weakening.[22] Later on October3, the National Hurricane Center began to forecast weakening of the depression.[55] The depression continued weakening and dissipated on October5.[21]
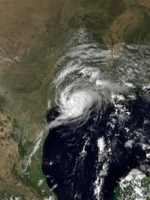
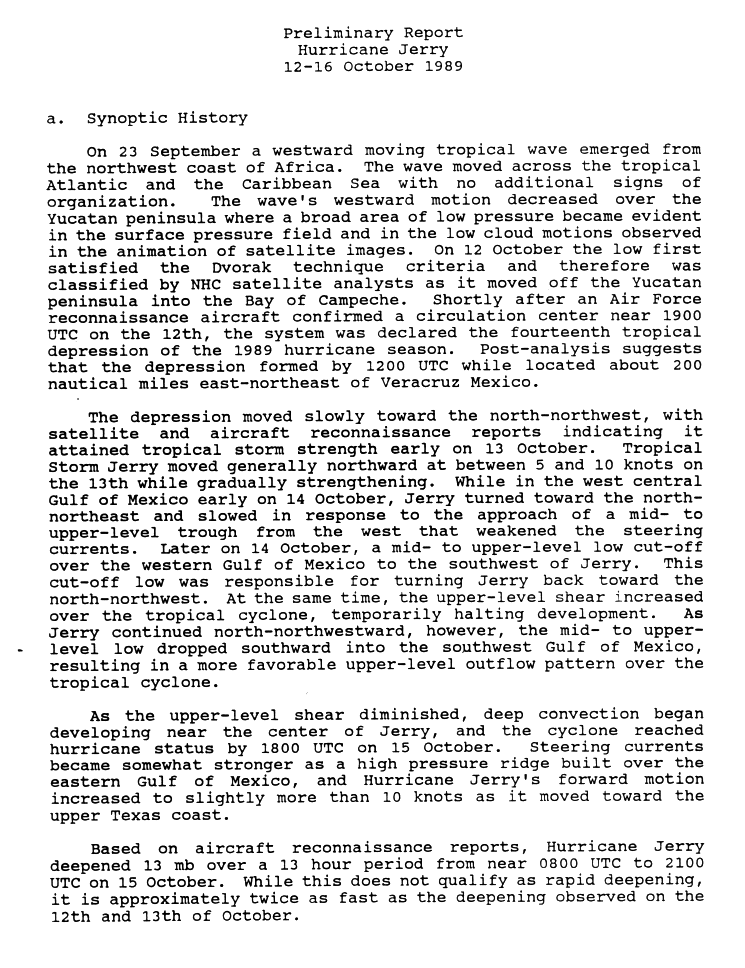
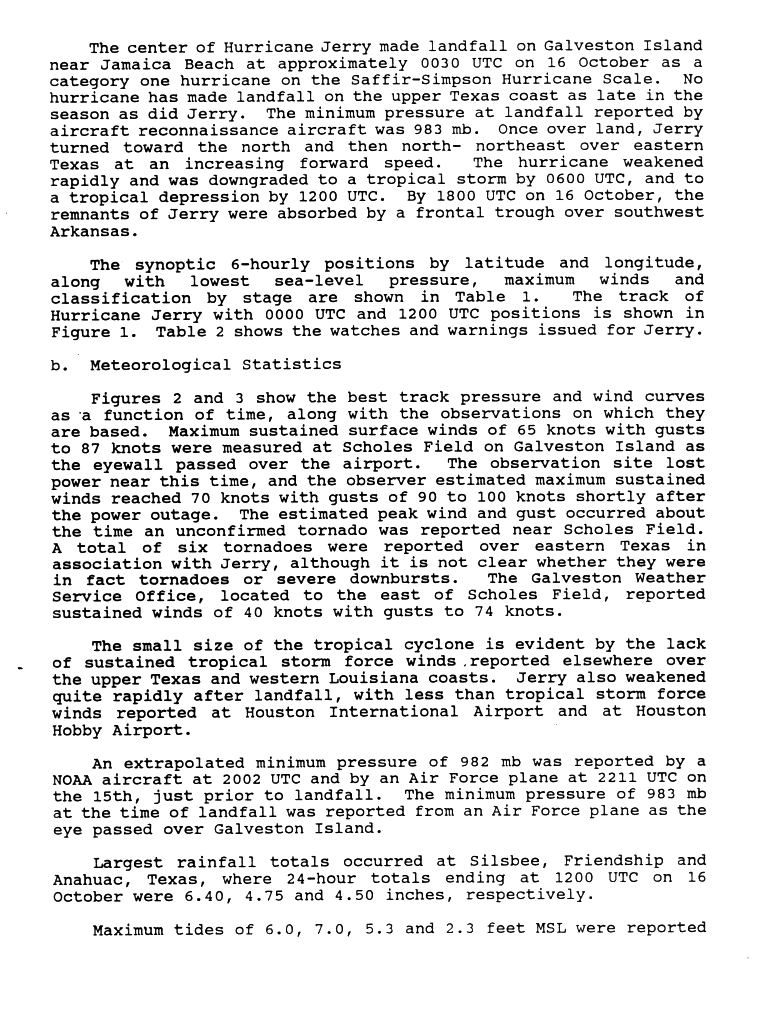
A tropical wave emerged into the Atlantic Ocean from the west coast of Africa on September23. Only minimal development occurred as the wave crossed the Atlantic and Caribbean Sea. However, after crossing the Yucatán Peninsula and emerging into the Bay of Campeche on October12, it developed into a tropical depression. The system quickly intensified into Tropical Storm Jerry on the following day. Jerry tracked generally northward while intensifying and reached hurricane status on October15.[56] After intensifying slightly more, Jerry made landfall near Jamaica Beach, Texas with winds of 85mph (135km/h). Jerry rapidly weakened after moving inland, and dissipated by October16. The remnants moved through the Tennessee Valley ahead of a frontal zone and eventually offshore the coast of the Mid-Atlantic states.[57]
Storm surge and rough surf along the coast of Texas destroyed a 20-mile (32km) section of Texas State Highway 87,[58] which was never repaired.[59] Due to strong winds, about 52,000homes and businesses were left without electricity, most of them in the Galveston area.[60] Many homes, businesses, and buildings were inflicted damage because of strong winds and three tornadoes spawned by the storm.[61] Despite the issuance of a hurricane warning just eight hours prior to landfall, Jerry caused only three fatalities in Texas, possibly due to the storm's small size; a car fell over the Galveston Seawall, killing its three occupants.[58] Minor wind and coastal flood damage was reported in Louisiana.[61] Jerry and its remnants brought flash flooding to portions of the Upland South, particularly in the states of Kentucky, Virginia, and West Virginia.[61] In eastern Kentucky, hundreds of homes were flooded and many bridges, culverts, and roads were washed out; this left hundreds of residents stranded.[62] Damage in Kentucky reached at least $5million. Similar impact occurred in Virginia, with $3.4million in damage in Buchanan County.[61] In West Virginia, overflowing rivers in the western portions of the state forced hundreds to evacuate.[63] Throughout the United States, Jerry resulted in about $70million in damage.[58]
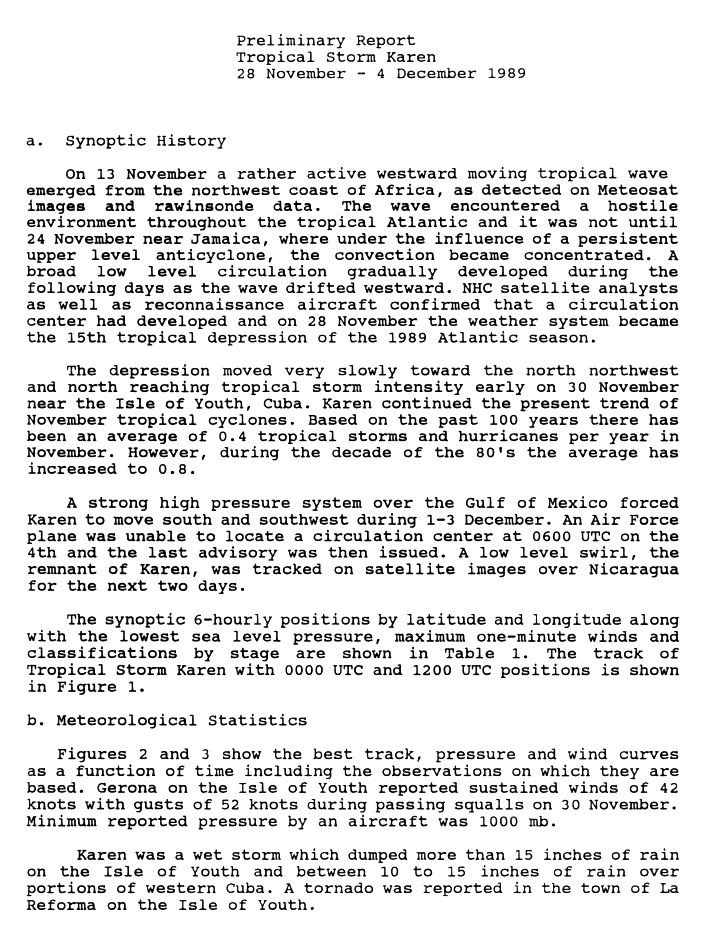
A tropical wave moved off the coast of Africa on November13 and failed to organize until reaching the western Caribbean Sea. Favorable conditions allowed convection to concentrate around a developing low-level circulation. On November28, satellite imagery and reconnaissance aircraft indicated the development of a tropical depression just north of Honduras. The depression moved northwestward then northeastward, intensifying into Tropical Storm Karen on November30, while located southwest of Isla de la Juventud, Cuba. Within 12hours of reaching tropical storm intensity, Karen peaked with maximum sustained winds of 60mph (95km/h). Around that time, a building ridge in the Gulf of Mexico forced the storm southeastward.[64]
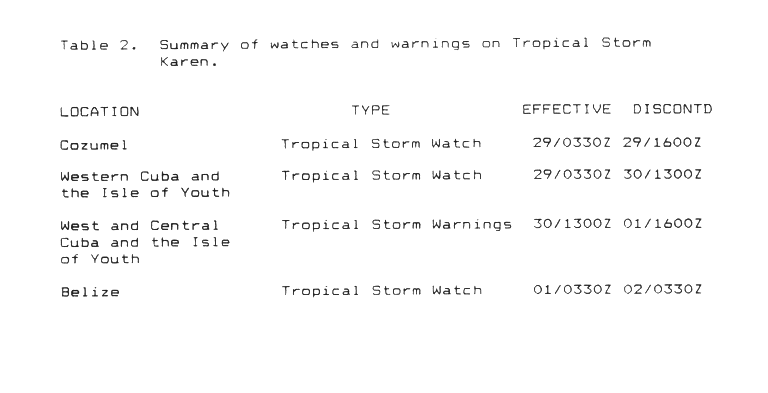
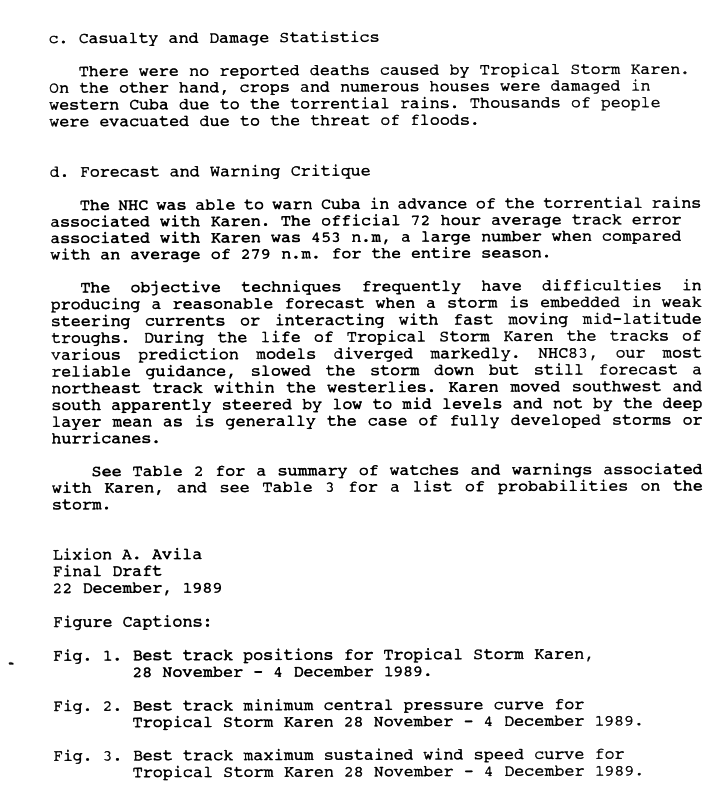
While Karen was threatening landmasses in the northwestern Caribbean Sea, tropical storm watches and warnings were issued for Cozumel on the Yucatán Peninsula, Isle de la Juventud, and western Cuba.[65] The storm dropped heavy rainfall in Cuba, reaching over 15in (380mm) on Isle de la Juventud. Wind gusts reached 60mph (97km/h), and there were reports of a tornado, but no damage or fatalities were reported.[66] After affecting Cuba, Karen turned to the southwest while steadily weakening.[64] It briefly threatened Belize, prompting a tropical storm watch,[65] but the storm turned to the southeast and dissipated on December4; its remnants later moved over Nicaragua.[64]
The following list of names was used for named storms that formed in the north Atlantic in 1989.[67] This was the same list used for the 1983 season,[68] except for Allison, which replaced Alicia.[1] Storms were named Allison, Erin, Felix, Gabrielle, Hugo, Iris, Jerry, and Karen for the first time in 1989.
The World Meteorological Organization retired Hugo from the Atlantic hurricane name lists after the 1989 season on account of its devastating impact. It was replaced with Humberto for the 1995 season.[69][70]
Season effects
This is a table of all of the storms that formed in the 1989 Atlantic hurricane season. It includes their name, duration, peak classification and intensities, areas affected, damage, and death totals. Deaths in parentheses are additional and indirect (an example of an indirect death would be a traffic accident), but were still related to that storm. Damage and deaths include totals while the storm was extratropical, a wave, or a low, and all of the damage figures are in 1989 USD.
The 1995 Atlantic hurricane season was a very active Atlantic hurricane season, and is considered to be the start of an ongoing era of high-activity tropical cyclone formation. The season produced twenty-one tropical cyclones, nineteen named storms, as well as eleven hurricanes and five major hurricanes. The season officially began on June 1 and ended on November 30, dates which conventionally delimit the period of each year when most tropical cyclones develop in the Atlantic basin. The first tropical cyclone, Hurricane Allison, developed on June 2, while the season's final storm, Hurricane Tanya, transitioned into an extratropical cyclone on November 1. The very active Atlantic hurricane activity in 1995 was caused by La Niña conditions, which also influenced an inactive Pacific hurricane season. It was tied with 1887 Atlantic hurricane season with 19 named storms, which was later equalled by the 2010, 2011, and 2012 seasons.
The 2004 Atlantic hurricane season was a very deadly, destructive, and active Atlantic hurricane season, with over 3,200 deaths and more than $61 billion in damage. More than half of the 16 tropical cyclones brushed or struck the United States. Due to the development of a Modoki El Niño – a rare type of El Niño in which unfavorable conditions are produced over the eastern Pacific instead of the Atlantic basin due to warmer sea surface temperatures farther west along the equatorial Pacific – activity was above average. The season officially began on June 1 and ended on November 30, though the season's last storm, Otto, dissipated on December 3, extending the season beyond its traditional boundaries. The first storm, Alex, developed offshore of the Southeastern United States on July 31, one of the latest dates on record to see the formation of the first system in an Atlantic hurricane season. It brushed the Carolinas and the Mid-Atlantic, causing one death and $7.5 million (2004 USD) in damage. Several storms caused only minor damage, including tropical storms Bonnie, Earl, Hermine, and Matthew. In addition, hurricanes Danielle, Karl, and Lisa, Tropical Depression Ten, Subtropical Storm Nicole and Tropical Storm Otto had no effect on land while tropical cyclones. The season was the first to exceed 200 units in accumulated cyclone energy (ACE) since 1995, mostly from Hurricane Ivan, the storm produced the highest ACE. Ivan generated the second-highest ACE in the Atlantic, only behind 1899 San Ciriaco Hurricane.
The 2000 Atlantic hurricane season was a fairly active hurricane season, but featured the latest first named storm in a hurricane season since 1992. The hurricane season officially began on June 1, and ended on November 30. It was slightly above average due to a La Niña weather pattern although most of the storms were weak. It was also the only season to have two of the storms affect Ireland. The first cyclone, Tropical Depression One, developed in the southern Gulf of Mexico on June 7 and dissipated after an uneventful duration. However, it would be almost two months before the first named storm, Alberto, formed near Cape Verde; Alberto also dissipated with no effects on land. Several other tropical cyclones—Tropical Depression Two, Tropical Depression Four, Chris, Ernesto, Nadine, and an unnamed subtropical storm—did not impact land. Five additional storms—Tropical Depression Nine, Florence, Isaac, Joyce, and Leslie—minimally affected land areas.
The 1999 Atlantic hurricane season was a fairly active season, mostly due to a persistent La Niña that developed in the latter half of 1998. It had five Category 4 hurricanes – the highest number recorded in a single season in the Atlantic basin, previously tied in 1933 and 1961, and later tied in 2005 and 2020. The season officially began on June 1, and ended on November 30. These dates conventionally delimit the period of each year when most tropical cyclones form in the Atlantic basin. The first storm, Arlene, formed on June 11 to the southeast of Bermuda. It meandered slowly for a week and caused no impact on land. Other tropical cyclones that did not affect land were Hurricane Cindy, Tropical Storm Emily, and Tropical Depression Twelve. Localized or otherwise minor damage occurred from Hurricanes Bret, Gert, and Jose, and tropical storms Harvey and Katrina.
The 1998 Atlantic hurricane season was a catastrophic and deadly Atlantic hurricane season, featuring the highest number of storm-related fatalities in over 218 years and some of the costliest ever at the time. The season had above average activity, due to the dissipation of an El Niño event and transition to La Niña conditions. It officially began on June 1 and ended on November 30, dates which conventionally delimit the period during which most tropical cyclones form in the Atlantic Ocean. The season had a rather slow start, with no tropical cyclones forming in June. The first tropical cyclone, Tropical Storm Alex, developed on July 27, and the season's final storm, Hurricane Nicole, became extratropical on December 1.
The 1961 Atlantic hurricane season was a very active Atlantic hurricane season, with an accumulated cyclone energy (ACE) total of 189. The season, however, was an average one in terms of named storms. The season featured eight hurricanes and a well above average number of five major hurricanes. It was previously thought that the season had a record-tying seven major hurricanes, before the Atlantic hurricane reanalysis project downgraded two storms in 2019. Two Category 5 hurricanes were seen in 1961, making it one of only seven Atlantic hurricane seasons to feature multiple Category 5 hurricanes in one season. The season started on June 15, and ended on November 15. These dates conventionally delimit the period of each year when most tropical cyclones form in the Atlantic basin. The first system, an operationally unclassified tropical depression, formed offshore east Central Florida on June 10, but dissipated a few days later. Next, Hurricane Anna developed in the eastern Caribbean Sea near the Windward Islands on July 20. It brought minor damage to the islands, as well as wind and flood impacts to Central America after striking Belize as a hurricane. Anna caused one death and about $300,000 (1961 USD) in damage. Activity went dormant for nearly a month and a half, until Hurricane Betsy developed on September 2. Betsy peaked as a Category 4 hurricane, but remained at sea and caused no impact.
The 1964 Atlantic hurricane season featured the highest number of U.S.-landfalling hurricanes since 1933. The season officially began on June 15, and lasted until November 30. These dates conventionally delimit the period of each year when most tropical cyclones form in the Atlantic basin. The season was above average, with thirteen named storms, seven hurricanes, and five major hurricanes. The first system, an unnamed tropical storm, developed on June 2, almost two weeks before the official start of the season. Striking Florida on June 6, the storm brought localized flooding to portions of Cuba and the Southeastern United States, leaving about $1 million in damage. The next storm, also unnamed, developed near the end of July; it did not impact land.
The 1966 Atlantic hurricane season saw the Weather Bureau office in Miami, Florida, be designated as the National Hurricane Center (NHC) and assume responsibility of tropical cyclone forecasting in the basin. The season officially began on June 1, and lasted until November 30. These dates conventionally delimit the period of each year when most tropical cyclones form in the Atlantic basin. It was an above-average season in terms of tropical storms, with a total of 15. The first system, Hurricane Alma, developed over eastern Nicaragua on June 4 and became the most recent major hurricane in the month of June. Alma brought severe flooding to Honduras and later to Cuba, but caused relatively minor impact in the Southeastern United States. Alma resulted in 90 deaths and about $210.1 million (1966 USD) in damage.
The 1968 Atlantic hurricane season was a below average hurricane season during which only nine nameable storms developed. The season officially began on June 1 and lasted until November 30, dates which conventionally delimit the period of each year when most tropical cyclones form in the Atlantic basin. Of the named storms, five strengthened into hurricanes; none however intensified into a major hurricane. Only four other seasons since the start of the satellite era—1972, 1986, 1994, and 2013—did not feature a major hurricane. The first system, Hurricane Abby, developed in the northwestern Caribbean on June 1. Abby moved northward and struck Cuba, bringing heavy rainfall and flooding to western portions of the island. Making landfall in Florida on June 4, Abby caused flooding and spawned four tornadoes, but left behind little damage. Overall, the hurricane resulted in six deaths and about $450,000 (1968 USD) in damage. In late June, Tropical Storm Candy brought minor flooding and spawned several tornadoes across portions of the Southern United States. Overall damage from the cyclone reached approximately $2.7 million. 1968 featured two simultaneously active tropical storms during the month of June, a phenomenon that would not occur again until 2023.
The 1969 Atlantic hurricane season was the most active Atlantic hurricane season since the 1933 season, and was the final year of the most recent positive ("high-quality") Atlantic multidecadal oscillation (AMO) era. The hurricane season officially began on June 1, and lasted until November 30. Altogether, 12 tropical cyclones reached hurricane strength, the highest number on record at the time; a mark not surpassed until 2005. The season was above-average despite an El Niño, which typically suppresses activity in the Atlantic Ocean, while increasing tropical cyclone activity in the Pacific Ocean. Activity began with a tropical depression that caused extensive flooding in Cuba and Jamaica in early June. On July 25, Tropical Storm Anna developed, the first named storm of the season. Later in the season, Tropical Depression Twenty-Nine caused severe local flooding in the Florida Panhandle and southwestern Georgia in September.
The 1978 Atlantic hurricane season was a slightly above average hurricane season in terms of number of named storms. Eleven tropical cyclones were named in all, and five of these became hurricanes; two of the five became a major hurricane. This was also the last Atlantic hurricane season to use an all-female naming list. The season officially began on June 1, 1978, and ended on November 30, 1978. These dates, adopted by convention, denote the period in each year when most tropical cyclogenesis occurs in the Atlantic basin. However, the formation of subtropical or tropical cyclones is possible at any time of the year, as shown by the formation of an unnamed subtropical storm on January 18.
The 1979 Atlantic hurricane season was the first Atlantic hurricane season to include both male and female names on its list of tropical cyclone names. The season officially began on June 1, and lasted until November 30. These dates conventionally delimit the period of each year when most tropical cyclones form in the Atlantic basin. It was slightly below average, with nine systems reaching tropical storm intensity. The first system, an unnumbered tropical depression, developed north of Puerto Rico on June 9. Two days later, Tropical Depression One formed and produced severe flooding in Jamaica, with 40 deaths and about $27 million (1979 USD) in damage. Tropical Storm Ana caused minimal impact in the Lesser Antilles. Hurricane Bob spawned tornadoes and produced minor wind damage along the Gulf Coast of the United States, primarily in Louisiana, while the remnants caused flooding, especially in Indiana. Tropical Storm Claudette caused extensive flooding in Texas due to torrential rainfall, resulting in two deaths and about $750 million in damage.
The 1985 Atlantic hurricane season had six United States landfalling hurricanes, tied with 1886 and 2020 for the highest number on record. The season officially began on June 1 and lasted until November 30. It was an average season, with 11 named storms developing. This was partially attributed to a La Niña – a meteorological phenomenon that produces favorable conditions across the Atlantic basin, such as lower wind shear and higher sea surface temperatures. The first storm, Ana, developed on July 15 near Bermuda and caused minor effects in Canada while transitioning into an extratropical cyclone. Three other tropical cyclones – Claudette, Henri, and Isabel – did not significantly affect land. Claudette developed offshore of the Southeastern United States and brushed Bermuda and the Azores. Henri and Isabel were dissipating as they approached land. However, the precursor of the latter caused a severe flood in Puerto Rico that killed 180 people. Additionally, Tropical Storm Fabian and three tropical depressions did not have any known impact on land.
The 1930 Atlantic hurricane season was the second least active Atlantic hurricane season on record in terms of tropical storms formed, only behind 1914, with only three systems reaching tropical storm intensity. Of those three, two reached hurricane status, both of which also became major hurricanes, Category 3 or higher storms on the Saffir–Simpson hurricane wind scale. The first system developed in the central Atlantic Ocean on August 21. Later that month, a second storm, the Dominican Republic hurricane, formed on August 29. It peaked as a Category 4 hurricane with winds of 155 mph (250 km/h). The third and final storm dissipated on October 21.
The 1929 Atlantic hurricane season was among the least active Atlantic hurricane seasons on record, with only five tropical cyclones forming. Three of them intensified into a hurricane, with one strengthening further into a major hurricane. The first tropical cyclone of the season developed in the Gulf of Mexico on June 27. Becoming a hurricane on June 28, the storm struck Texas, bringing strong winds to a large area. Three fatalities were reported, while damage was conservatively estimated at $675,000 (1929 USD).
The 1920 Atlantic hurricane season featured tropical storms and hurricanes only in the month of September. The first system, a hurricane, developed on September 7 while the last, a tropical depression, transitioned into an extratropical cyclone on October 27. Of note, four of the six cyclones co-existed with another tropical cyclone during the season.
The 1919 Atlantic hurricane season was among the least active hurricane seasons in the Atlantic on record, featuring only five tropical storms. Of those five tropical cyclones, two of them intensified into a hurricane, with one strengthening into a major hurricane Two tropical depressions developed in the month of June, both of which caused negligible damage. A tropical storm in July brought minor damage to Pensacola, Florida, but devastated a fleet of ships. Another two tropical depressions formed in August, the first of which brought rainfall to the Lesser Antilles.
Hurricane Gabrielle was a powerful tropical cyclone that caused nine fatalities in the United States and Canada, despite remaining hundreds of miles offshore. The tenth tropical cyclone, seventh named storm, fifth hurricane, and first major hurricane of the 1989 Atlantic hurricane season, Gabrielle developed on August 30 from a tropical wave near the west coast of Africa. Under favorable conditions, the depression intensified and became Tropical Storm Gabrielle early on the following day. Rapid strengthening occurred thereafter, with Gabrielle reaching hurricane intensity early on September 1. After becoming a hurricane, further intensification was steady, though by September 5, Gabrielle peaked as a moderate Category 4 hurricane. On the following day, Gabrielle began to slowly level-off in intensity, while gradually curving northward. After weakening to a Category 2 hurricane, the storm passed east of Bermuda on September 8.
The 2014 Pacific hurricane season was the fifth-busiest season since reliable records began in 1949, alongside the 2016 season. The season officially started on May 15 in the East Pacific Ocean, and on June 1 in the Central Pacific; they both ended on November 30. These dates conventionally delimit the period of each year when most tropical cyclones form in the Pacific basin.
The 2012 Atlantic hurricane season was the final year in a string of three consecutive very active seasons since 2010, with 19 tropical storms. The 2012 season was also a costly one in terms of property damage, mostly due to Hurricane Sandy. The season officially began on June 1 and ended on November 30, dates that conventionally delimit the period during each year in which most tropical cyclones form in the Atlantic Ocean. However, Alberto, the first named system of the year, developed on May 19 – the earliest date of formation since Subtropical Storm Andrea in 2007. A second tropical cyclone, Beryl, developed later that month. This was the first occurrence of two pre-season named storms in the Atlantic basin since 1951. It moved ashore in North Florida on May 29 with winds of 65 mph (105 km/h), making it the strongest pre-season storm to make landfall in the Atlantic basin. This season marked the first time since 2009 where no tropical cyclones formed in July. Another record was set by Hurricane Nadine later in the season; the system became the fourth-longest-lived tropical cyclone ever recorded in the Atlantic, with a total duration of 22.25 days. The final storm to form, Tony, dissipated on October 25 – however, Hurricane Sandy, which formed before Tony, became extratropical on October 29.
1 2 Atlantic basin Comparison of Original and Revised HURDAT. Hurricane Research Division (Report). Miami, Florida: Atlantic Oceanographic and Meteorological Laboratory; National Oceanic and Atmospheric Administration. March 2011. Retrieved May 10, 2014.
1 2 Robert A. Case (August 16, 1989). D. Casualty and Damage Statistics. National Hurricane Center (Report). National Oceanic and Atmospheric Administration. p.4. Retrieved January 28, 2013.
↑ Harold P. Gerrish (November 22, 1989). Meteorological Statistics. National Hurricane Center (Report). Miami, Florida: National Oceanic and Atmospheric Administration. p.3. Retrieved March 1, 2014.
↑ B. Max Mayfield (October 22, 1989). Casualty and Damage Statistics. National Hurricane Center (Report). National Oceanic and Atmospheric Administration. p.2. Retrieved March 1, 2014.
↑ Robert A. Case (November 23, 1989). Casualty and damage statistics. National Hurricane Center (Report). Miami, Florida: National Oceanic and Atmospheric Administration. p.3. Retrieved May 9, 2014.
↑ Miles B. Lawrence (November 15, 1989). Preliminary Report Hurricane Hugo 10–22 September 1989(PDF). National Hurricane Center (Report). Miami, Florida: National Oceanic and Atmospheric Administration. Archived from the original(PDF) on September 6, 2017. Retrieved May 10, 2014.
↑ B. Max Mayfield (November 21, 1989). Casualty and Damage Statistics. National Hurricane Center (Report). Miami, Florida: National Oceanic and Atmospheric Administration. p.3. Retrieved May 9, 2014.
↑ Jay Hollifield; S. C. Lackey (1990). Storm Data and Unusual Weather Phenomena: October 1989(PDF). National Climatic Data Center (Report). Asheville, North Carolina: National Oceanic and Atmospheric Administration. p.21. Archived from the original(PDF) on May 9, 2014. Retrieved December 4, 2013.
↑ David Levinson (August 20, 2008). 2005 Atlantic Ocean Tropical Cyclones. National Climatic Data Center (Report). Asheville, North Carolina: National Oceanic and Atmospheric Administration. Archived from the original on December 1, 2005. Retrieved July 23, 2011.
↑ Jay Hollifield; S. C. Lackey. Storm Data and Unusual Weather Phenomena: June 1989(PDF). National Climatic Data Center (Report). Asheville, North Carolina: National Oceanic and Atmospheric Administration. pp.46, 85–86. Archived from the original(PDF) on February 28, 2014. Retrieved January 28, 2013.
1 2 3 Harold P. Gerrish (November 22, 1989). Meteorological Statistics. National Hurricane Center (Report). Miami, Florida: National Oceanic and Atmospheric Administration. p.3. Retrieved March 1, 2014.
1 2 Harold P. Gerrish (November 22, 1989). Meteorological Statistics. National Hurricane Center (Report). Miami, Florida: National Oceanic and Atmospheric Administration. p.4. Retrieved May 21, 2014.
↑ B. Max Mayfield (October 22, 1989). Casualty and Damage Statistics. National Hurricane Center (Report). National Oceanic and Atmospheric Administration. p.2. Retrieved March 1, 2014.
1 2 Robert A. Case (November 23, 1989). Casualty and damage statistics. National Hurricane Center (Report). Miami, Florida: National Oceanic and Atmospheric Administration. p.3. Retrieved May 9, 2014.
1 2 3 B. Max Mayfield (November 21, 1989). Casualty and Damage Statistics. National Hurricane Center (Report). Miami, Florida: National Oceanic and Atmospheric Administration. p.3. Retrieved May 9, 2014.
1 2 3 4 Jay Hollifield; S. C. Lackey (1990). Storm Data and Unusual Weather Phenomena: October 1989(PDF). National Climatic Data Center (Report). Asheville, North Carolina: National Oceanic and Atmospheric Administration. p.21. Archived from the original(PDF) on May 9, 2014. Retrieved December 4, 2013.
↑ Lixion A. Avila (December 22, 1989). Casualty and Damage Statistics. National Hurricane Center (Report). Miami, Florida: National Oceanic and Atmospheric Administration. p.2. Retrieved May 10, 2014.
↑ National Hurricane Operations Plan(PDF) (Report). Washington, D.C.: NOAA Office of the Federal Coordinator for Meteorological Services and Supporting Research. April 1989. p.3-7. Retrieved January 17, 2024.
↑ National Hurricane Operations Plan(PDF) (Report). Washington, D.C.: NOAA Office of the Federal Coordinator for Meteorological Services and Supporting Research. May 1983. p.3-8. Retrieved January 17, 2024.
↑ National Hurricane Operations Plan(PDF) (Report). Washington, D.C.: NOAA Office of the Federal Coordinator for Meteorological Services and Supporting Research. May 1995. p.3-7. Retrieved January 17, 2024.
This page is based on this Wikipedia article Text is available under the CC BY-SA 4.0 license; additional terms may apply. Images, videos and audio are available under their respective licenses.


