The achievement gap in the United States is the observed, persistent disparity in measures of educational performance among subgroups of U.S. students, especially groups defined by socioeconomic status (SES), race/ethnicity and gender. The achievement gap can be observed on a variety of measures, including standardized test scores, grade point average, dropout rates, and college enrollment and completion rates. While this article focuses on the achievement gap in the United States, the gap in achievement between lower income students and higher income students exists in all nations[1] and it has been studied extensively in the U.S. and other countries, including the U.K.[2] Various other gaps between groups exist around the globe as well.
Socioeconomic status (SES) is an economic and sociological combined total measure of a person's work experience and of an individual's or family's economic and social position in relation to others, based on household income, earners' education, and occupation are examined, as well as combined income, whereas for an individual's SES only their own attributes are assessed. However, SES is more commonly used to depict an economic difference in society as a whole.
Gender is the range of characteristics pertaining to, and differentiating between, masculinity and femininity. Depending on the context, these characteristics may include biological sex, sex-based social structures, or gender identity. Most cultures use a gender binary, having two genders ; those who exist outside these groups fall under the umbrella term non-binary or genderqueer. Some societies have specific genders besides "man" and "woman", such as the hijras of South Asia; these are often referred to as third genders.
A standardized test is a test that is administered and scored in a consistent, or "standard", manner. Standardized tests are designed in such a way that the questions, conditions for administering, scoring procedures, and interpretations are consistent and are administered and scored in a predetermined, standard manner.
Research into the causes of the disparity in academic achievement between students from different socioeconomic and racial backgrounds has been ongoing since the 1966 publication of the Coleman Report (officially titled "Equality of Educational Opportunity"), commissioned by the U.S. Department of Education, which found that a combination of home, community, and in-school factors affect academic performance and contribute to the achievement gap. According to American educational psychologist David Berliner, home and community environments have a stronger impact on school achievement than in-school factors, in part, because students spend more time outside of school than in school. In addition, the out-of-school factors influencing academic performance differ significantly between children living in poverty and children from middle-income households.[3][4]
David C. Berliner is an educational psychologist. He was professor and dean of the Mary Lou Fulton Institute and Graduate School of Education.
The achievement gap, as reported in trend data collected by the National Assessment of Educational Progress (NAEP), has become a focal point of education reform efforts by a number of nonprofit organizations and advocacy groups. Attempts to minimize the achievement gap by improving equality of access to educational opportunities have been numerous but fragmented, such as affirmative action, multicultural education, finance equalization,[clarification needed] and interventions to improve school testing, teacher quality and accountability.
The National Assessment of Educational Progress (NAEP) is the largest continuing and nationally representative assessment of what U.S. students know and can do in various subjects. NAEP is a congressionally mandated project administered by the National Center for Education Statistics (NCES), within the Institute of Education Sciences (IES) of the U.S. Department of Education. The first national administration of NAEP occurred in 1969. The National Assessment Governing Board (NAGB) is an independent, bipartisan board that sets policy for NAEP and is responsible for developing the framework and test specifications.The National Assessment Governing Board, whose members are appointed by the U.S. Secretary of Education, includes governors, state legislators, local and state school officials, educators, business representatives, and members of the general public. Congress created the 26-member Governing Board in 1988.
Education reform is the name given to the goal of changing public education. Historically, reforms have taken different forms because the motivations of reformers have differed. However, since the 1980s, education reform has been focused on changing the existing system from one focused on inputs to one focused on outputs. In the United States, education reform acknowledges and encourages public education as the primary source of K-12 education for American youth. Education reformers desire to make public education into a market, where accountability creates high-stakes from curriculum standards tied to standardized tests. As a result of this input-output system, equality has been conceptualized as an end point, which is often evidenced by an achievement gap among diverse populations. This conceptualization of education reform is based on the market-logic of competition. As a consequence, competition creates inequality which has continued to drive the market-logic of equality at an end point by reproduce the achievement gap among diverse youth. The one constant for all forms of education reform includes the idea that small changes in education will have large social returns in citizen health, wealth and well-being. For example, a stated motivation has been to reduce cost to students and society. From ancient times until the 1800s, one goal was to reduce the expense of a classical education. Ideally, classical education is undertaken with a highly educated full-time personal tutor. Historically, this was available only to the most wealthy. Encyclopedias, public libraries and grammar schools are examples of innovations intended to lower the cost of a classical education.
Affirmative action describes policies that support members of a disadvantaged group through education, employment, or housing that have suffered past discrimination. Historically and internationally, support for affirmative action has sought to achieve goals such as bridging inequalities in employment and pay, increasing access to education, promoting diversity, and redressing apparent past wrongs, harms, or hindrances.
The education of African Americans and some other minorities lags behind those of other U.S. ethnic groups, such as Whites and Asian Americans, as reflected by test scores, grades, urban high school graduation rates, rates of disciplinary action, and rates of conferral of undergraduate degrees. Indeed, high school graduation rates and college enrollment rates are comparable to those of whites 25 or 30 years ago. It should also be noted that the category of African immigrant population (excluding Haitians and other foreign-born blacks born outside of Africa) has the highest educational attainment of any group in the United States, but they represent a small group within the larger African American population.[5]
The United States of America (USA), commonly known as the United States or America, is a country comprising 50 states, a federal district, five major self-governing territories, and various possessions. At 3.8 million square miles, the United States is the world's third or fourth largest country by total area and is slightly smaller than the entire continent of Europe's 3.9 million square miles. With a population of over 327 million people, the U.S. is the third most populous country. The capital is Washington, D.C., and the most populous city is New York City. Most of the country is located contiguously in North America between Canada and Mexico.
White people is a racial classification specifier, used mostly and often exclusively for people of European descent; depending on context, nationality, and point of view. The term has at times been expanded to encompass persons of Middle Eastern and North African descent, persons who are often considered non-white in other contexts. The usage of "white people" or a "white race" for a large group of mainly or exclusively European populations, defined by their light skin, among other physical characteristics, and contrasting with "black people", Amerindians, and other "colored" people or "persons of color", originated in the 17th century. It was only during the 19th century that this vague category was transformed in a quasi-scientific system of race and skin color relations. The term "Caucasian" is sometimes used as a synonym for "white" in its racial sense and sometimes to refer to a larger racial category that includes white people among other groups.
Asian Americans are Americans of Asian ancestry. The term refers to a panethnic group that includes diverse populations, which have ancestral origins in East Asia, South Asia, or Southeast Asia, as defined by the U.S. Census Bureau. This includes people who indicate their race(s) on the census as "Asian" or reported entries such as "Chinese, Filipino, Indian, Korean, Japanese, Vietnamese, and Other Asian". In 2017, Asian Americans comprised 5.6% of the U.S. population; including multiracial Asian Americans, that percentage increases to 6.9%.
East Asian Americans of Taiwanese, Japanese, Chinese, and Korean descent score the highest, with thousands of East Asians scoring perfect scores, in all scholastic standardized tests such as the SAT, GRE, MCAT, USMLE exams and IQ tests followed by caucasianWhite people who score in the intermediate range followed by African-American and Hispanic students who tend to score in the lower ranges. U.S. students as whole have in general attained average scores on the International PISA test while other wealthy industrializeddevelopedEast Asian countries, such as Taiwan, Japan, Singapore and South Korea have the highest top scores. However, compared with children in some less developed countries like Benin where some children, especially girls, end their education after the elementary level, education in the United States is compulsory to age 16 regardless of race or class. It is expected that over half of public education students will be required to pass standards-based assessments which expect that all students to be at least exposed to algebra by high school and exit prepared for college. In many other nations, such as Germany and Japan, those with lower test scores may be tracked as skilled tradepersons or unskilled laborers.
East Asia is the eastern subregion of Asia, defined in both geographical and ethno-cultural terms. The region includes China, Hong Kong, Macau, Japan, North Korea, South Korea, Mongolia and Taiwan. People indigenous to the region are called East Asians. China, Japan, Korea, and Vietnam belong to the East Asian cultural sphere.
Taiwan, officially the Republic of China (ROC), is a state in East Asia. Neighbouring states include the People's Republic of China (PRC) to the west, Japan to the north-east, and the Philippines to the south. The island of Taiwan has an area of 35,808 square kilometres (13,826 sq mi), with mountain ranges dominating the eastern two thirds and plains in the western third, where its highly urbanised population is concentrated. Taipei is the capital and largest metropolitan area. Other major cities include Kaohsiung, Taichung, Tainan and Taoyuan. With 23.7 million inhabitants, Taiwan is among the most densely populated states, and is the most populous state and largest economy that is not a member of the United Nations (UN).
Japanese people are an ethnic group that is native to the Japanese archipelago and modern country of Japan, where they constitute 98.5% of the total population. Worldwide, approximately 129 million people are of Japanese descent; of these, approximately 125 million are residents of Japan. People of Japanese ancestry who live outside Japan are referred to as nikkeijin(日系人), the Japanese diaspora. The term ethnic Japanese is often used to refer to mainland Japanese people, specifically Yamato people. Japanese people are one of the largest ethnic groups in the world.
Nowadays, there's a gaining population of students who use online education, and the number of institutions which offering fully online degrees is also increasing. According to several studies, online education probably could create an environment where there is less cultural division and negative stereotypes of African Americans, thus protecting those students who have had bad experiences. In addition, the influence technology and user skills and so as economics and academic influences are tightly bonded, that may have positively contributed to African American online learners experience. However, it appears African American male students are less likely to enroll in online classes.
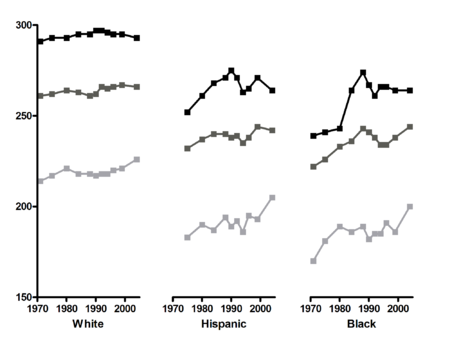
Evidence of the racial achievement gap: National Assessment of Educational Progress (United States)
Evidence of the achievement gap can be found using various measures, but one assessment used nationwide is the National Assessment of Educational Progress (NAEP). The graphs below show the achievement gap on this assessment between black and white students and between Hispanic and white students in the U.S. over time. Although the gaps have generally narrowed in recent years according to this particular measure, there are clearly still large disparities between groups.
Debate on the origins of the racial achievement gap
Researchers have not reached consensus about the causes of the academic achievement gap; instead, there exists a wide range of studies that cite an array of factors, both cultural and structural, that influence student performance in school. Annette Lareau suggested that students who lack middle-class cultural capital and have limited parental involvement are likely to have lower academic achievement than their better resourced peers.[6] Other researchers suggest that academic achievement is more closely tied to race and socioeconomic status and have tried to pinpoint why.[7]
Economic factors were identified as lack of online course access (McCoy, 2012)[8] and online course attrition which indicated before (Liu et al., 2007).[9] Based on the National Center for Educational Statistic (2015),[10] about half of African American male students grew up in single-parent households. They are associated with higher incidences of poverty, which leads to poorer educational outcomes (Child Trends Databank, 2015). Low-income households tend to have fewer home computers and less access to the Internet (Zickuhr & Smith, 2012).[11]
For example, being raised in a low-income family often means having fewer educational resources in addition to poor nutrition and limited access to health care, all of which could contribute to lower academic performance. Researchers concerned with the achievement gap between genders cite biological differences, such as brain structure and development, as a possible reason why one gender outperforms the other in certain subjects. For example, a Virginia Tech Study conducted in 2000 examined the brains of 508 children and found that different areas of the brain develop in a different sequence in girls compared to boys.[12]
The differing maturation speed of the brain between boys and girls affects how each gender processes information and could have implications for how they perform in school.[13]
Hernstein and Murray's 1994 book The Bell Curve[14] controversially claimed that genetic variation in average levels of intelligence (IQ) may explain some portion of the racial disparities in achievement. The book also claimed that breeding by less gifted people would have a dysgenic effect on society.[15] The book was politically influential and revived public debate on the role of genetics in race. It has been described by many academics as a restatement of previously debunked scientific racism, and was condemned by both literary reviewers and academics within related fields.[16][15][17] Other academics have argued that there is no significant difference in inherent cognitive ability between different races that could help to explain the achievement gap, and that environment is at the root of the issue.[18][19][20]
The racial achievement gap in early childhood
Research shows that the achievement gap, which often is first measured (by standardized tests) in elementary school, actually begins well before students reach kindergarten as a “school readiness” gap.[21] One study claims that about half the test score gap between black and white high school students is already evident when children start school.[22]
A variety of different tests at kindergarten entry have provided evidence of such a gap, including the U.S. Department of Education's Early Childhood Longitudinal Survey of Kindergarten children (ECLS-K). While results differ depending on the instrument, estimates of the black-white gap range from slightly less than half a standard deviation to slightly more than 1 standard deviation.[23]
This early disparity in performance is critical, as research shows that once students are behind, they do not catch up. Children who score poorly on tests of cognitive skills before starting kindergarten are highly likely to be low performers throughout their school careers.[24] The evidence of the early appearance of the gap has led to efforts focused on early childhood interventions (see “Narrowing the achievement gap” below).
Achievement gaps between African American students and White students in online classes tend to be greater than regular class. Expanding from 14% in 1995 to 22% in 2015 (National Center for Education Statistics, 2016).[25] Possible cause might be the differences in socio-economic status (Palmer et al., 2013),[26] academic performance differences (Osborne, 2001),[27] unable to access technology (Fairlie, 2012),[28] no online technical support (Rovai & Gallien, 2005),[29] and anxious towards racial stereotyping (Osborne, 2001).[27]
The culture and environment in which children are raised may play a role in the achievement gap. Jencks and Phillips argue that African American parents may not encourage early education in toddlers because they do not see the personal benefits of having exceptional academic skills. As a result of cultural differences, African American students tend to begin school with smaller vocabularies than their white classmates.[30] Hart and Risley calculated a "30 million word gap" between children of high school dropouts and those of professionals who are college educated. The differences are qualitative as well as quantitative, with differences in "unique" words, complexity, and "conversational turns."[31]
However, poverty often acts as a confounding factor and differences that are assumed to arise from racial/cultural factors may be socioeconomically driven. Many children who are poor, regardless of race, come from homes that lack stability, continuity of care, adequate nutrition, and medical care creating a level of environmental stress that can affect the young child's development. As a result, these children enter school with decreased word knowledge that can affect their language skills, influence their experience with books, and create different perceptions and expectations in the classroom context.[32]
Studies show that when students have parental assistance with homework, they perform better in school.[33] This is a problem for many minority students due to the large number of single-parent households (67% of African-American children are in a single-parent household)[34] and the increase in non-English speaking parents. Students from single-parent homes often find it difficult to find time to receive help from their parent. Similarly, some Hispanic students have difficulty getting help with their homework because there is not an English speaker at home to offer assistance.[33]
Hispanic views toward education
Disadvantages in a child's early life can cultivate into achievement gaps in their education. Poverty, coupled with the environment they are raised in, can lead to shortcomings in educational achievement. Despite strong standards and beliefs in education, Hispanic children consistently perform poorly, reflected by a low average of math and reading scores, as compared to other groups except African American.[35] Hispanic and African American children have been shown to be more likely to be raised in poverty, with 33% of Hispanic families living below the economic poverty level, compared to African American (39%), Asian (14%) and White (13%) counterparts.[35] Children who are raised in poverty are less likely to be enrolled in nursery or preschool. Though researchers are seeing improvements in achievement levels, such as a decrease in high school dropout rates (from 24% to 17%) and a steady increase in math and reading scores over the past 10 years,[35] there are still issues that must be addressed.
There is a common misconception that Hispanic parents are not involved in their child's education and fail to transmit strong educational values to their children. However, there is evidence that Hispanic parents actually hold their children's education in high value. The majority of Hispanic children are affected by immigration. It affects recent immigrants as well as the children of immigrants.[36] Both recent immigrants and the children of immigrants are faced with language barriers and other migration obstacles. A study explored the unique situation and stressors recent Latin American immigrants face. Hispanic students showed lower academic achievement, more absences, and more life stressors than their counterparts.[37] In 2014-2015, 77.8% of Hispanic children were English Language learners. This can be problematic because children may not have parents who speak English at home to help with language acquisition. Immigration struggles can be used as a motivator for students. Immigrant parents appeal to their children and hold high expectations because of the “gift” they are bestowing on them. They immigrated and sacrificed their lives so their children can succeed, and this framework is salient in encouraging children to pursue their education. Parents use their struggles and occupation to encourage a better life.[38]
Parental involvement has been shown to increase educational success and attainment for students. For example, parental involvement in elementary school has been shown to lower high school dropout rates and improved on time completion of high school.[39] A common misconception is that Latino parents don’t hold their children's education in high regards (Valencia, 2002), but this has been debunked. Parents show their values in education by holding high academic expectations and giving “consejos” or advice. In 2012, 97% of families reported teaching their children letters, words or numbers.[35] A study reported that parent involvement during adolescence continues to be as influential as in early childhood.[38]
Motivation gap
Another explanation that has been suggested for racial and ethnic differences in standardized test performance is that some minority children may not be motivated to do their best on these assessments. Many argue that standardized IQ tests and other testing procedures are culturally biased toward the knowledge and experiences of the European-American middle class.[40][41]
Claude M. Steele suggested that minority children and adolescents may also experience stereotype threat—the fear that they will be judged to have traits associated with negative appraisals and/or stereotypes of their race or ethnic group. According to this theory, this produces test anxiety and keeps them from doing as well as they could on tests. According to Steele, minority test takers experience anxiety, believing that if they do poorly on their test they will confirm the stereotypes about inferior intellectual performance of their minority group. As a result, a self-fulfilling prophecy begins, and the child performs at a level beneath his or her inherent abilities.
Some researchers[42] also hypothesize that in some cases, minorities, especially African American students, may stop trying in school because they do not want to be accused of “acting white” by their peers,[43] or that some minority students simply stop trying because they do not believe they will ever see the true or deserved benefits of their hard work. As some researchers point out, minority students may feel little motivation to do well in school because they do not believe it will pay off in the form of a better job or upward social mobility.[30][44] By not trying to do well in school, such students engage in a rejection of the achievement ideology– that is, the idea that working hard and studying long hours will pay off for students in the form of higher wages or upward social mobility.
Structural and institutional factors
Different schools have different effects on similar students. Children of color tend to be concentrated in low-achieving, highly segregated schools. In general, minority students are more likely to come from low-income households, meaning minority students are more likely to attend poorly funded schools based on the districting patterns within the school system. Schools in lower-income districts tend to employ less qualified teachers and have fewer educational resources.[45] Research shows that teacher effectiveness is the most important in-school factor affecting student learning. Good teachers can actually close or eliminate the gaps in achievement on the standardized tests that separate white and minority students.[46]
Schools also tend to place students in tracking groups as a means of tailoring lesson plans for different types of learners. However, as a result of schools placing emphasis on socioeconomic status and cultural capital, minority students are vastly over-represented in lower educational tracks.[47] Similarly, Hispanic and African American students are often wrongly placed into lower tracks based on teachers’ and administrators’ expectations for minority students. Such expectations of a race within school systems are a form of institutional racism. Some researchers compare the tracking system to a modern form of racial segregation within the schools.[48]
Studies on tracking groups within schools have also proven to be detrimental for minority students.[49] Once students are in these lower tracks, they tend to have less-qualified teachers, a less challenging curriculum, and few opportunities to advance into higher tracks.[50] There is also some research that suggests students in lower tracks suffer from social psychological consequences of being labeled as a slower learner, which often leads children to stop trying in school.[7] In fact, many sociologists argue that tracking in schools does not provide any lasting benefits to any group of students.[51]
The practice of awarding low grades and test scores to children who struggle causes low-performing children to experience anxiety, demoralization, and a loss of control.[52][53] This undermines performance.[52][53] The effect increases across the elementary and secondary school years.[53] The effect explains why the achievement gap increases over the school years.[54] The effect may explain why the achievement gap has resisted solution.[54]
Preschool education
Additionally, poor and minority students have disproportionately less access to high-quality early childhood education, which has been shown to have a strong impact on early learning and development. One study found that although black children are more likely to attend preschool than white children, they may experience lower-quality care.[55] The same study also found that Hispanic children in the U.S. are much less likely to attend preschool than white children. Another study conducted in Illinois in 2010[56] found that only one in three Latino parents could find a preschool slot for his or her child, compared to almost two thirds of other families.
Finally, according to the National Institute for Early Education Research (NIEER), families with modest incomes (less than $60,000) have the least access to preschool education.[57] Research suggests that dramatic increases in both enrollment and quality of prekindergarten programs would help to alleviate the school readiness gap and ensure that low-income and minority children begin school on even footing with their peers.[55]
Economic implications of the racial achievement gap
In addition to the moral and social justice arguments for closing the achievement gap, there are strong economic arguments for doing so. A 2009 report by the management consulting firm McKinsey & Company asserts that the persistence of the achievement gap in the U.S. has the economic effect of a “permanent national recession."[58] The report claims that if the achievement gap between black and Latino performance and white student performance had been narrowed, GDP in 2008 would have been $310 billion to $525 billion higher (2–4 percent).[58]
If the gap between low-income students and their peers had been narrowed, GDP in the same year would have been $400 billion to $670 billion higher (3–5 percent). In addition to the potential increase in GDP, the report projects that closing the achievement gap would lead to cost savings in areas outside of education, such as incarceration and healthcare. The link between low school performance and crime, low earnings and poor health has been echoed in academic research.[59][60]
Influences of technical difficulties and technology support
Students who have problems with technology interfered are more likely to withdraw from their online courses (Bambara et al., 2009).[61] Also, there's no sufficient technology support which will also leads students to drop the class since their problems could not be solved quickly (Palmer & Holt, 2010; Yang & Cornelius, 2004).[62]
Influences of technology experience, skills, and self-efficacy
Students who were more focused and engaged themselves to the class will tend to receive higher grade, their self-confidence can be gained through daily life use of Internet (Sahin & Shelley, 2008).[63] Male online learners had higher Internet self-efficacy than female, while they participated less in discussions (Chang et al., 2014; Ong & Lai, 2006).[64]
Factors contributing to onsite academic success for African American males
As Fletcher (2015)[65] indicated, possible factors that helped African American college students to gain academic success via online education might be: positive pre-college educational experiences, supportive environments in college campus, involving in campus activities, positive faculty interactions and support, same race/gender relationships with peers, family support, self-confidence, future career ambitions and the ability to face racism.
African American male online learners as college students
Students of color like African American students need a color-blind environment to support them reaching towards academic success better. In this way they are more likely to gain self-confidence and educational resilience (Tucker, 2014).[66]
Attempts at narrowing the racial achievement gap
Explanations for the achievement gap and concerns over its effects and even the existence of such a gap are widely contested. These explanations are also the source of much controversy, especially since efforts to "close the gap" have become some of the more politically prominent education reform issues. The issues that the achievement gap perpetuate also hold politically charged issues. For example, the cause of the Latino education crisis is not attributable to any single factor. It is likely the result of multiple variables—all of which can have an effect on one another—ranging from social, economic, and educational conditions to inadequate social services and families with exceptionally low human and social capital. The effects of the achievement gap in school can be seen later in life for students. For example, since schools often lack the resources to meet many students' most basic educational needs and since there are few entry level jobs that provide a living wage and benefits available to those without higher education or special skills in the economy, many are left at a disadvantage.[67] The following attempts have all been made in order to counteract the effects of the achievement gap at schools. They range from nationwide, government-led initiatives to smaller school-based initiatives.
Standards-based reform and No Child Left Behind
The federal No Child Left Behind Act of 2002 (NCLB) focuses on standardized test scores and school accountability to ensure that all students have the same educational opportunities. As written, the legislation incentivizes that schools show continual improvement toward this goal (otherwise known as "Adequate Yearly Progress," or AYP) otherwise schools face punishments, such as sanctions. This system has been criticized by some for being unfair toward schools that have the highest population of minority and poor students, as it is harder for these schools to meet the standards set by the No Child Left Behind Act, due to insufficient funding from either local, district, or state actors. This in turn leads to a cycle of underperformance and sanctions within these areas which furthers the problems that the Act meant to fix.[68]
In 2010, the Obama Administration instituted the Race to the Top (RTTT) program which provides financial incentives to states to produce measurable student gains. RTTT's primary goals are to improve student achievement, close achievement gaps, and improve high school graduation rates.[69] The goals of both programs has been to close the achievement gap, but the RTTT has been more focused on closing the gap between higher and lower performing schools rather than focusing on a national approach.[70] The major difference between the two educational reform programs is that RTTT is a competitive grant program that provides incentives for schools to change, while the NCLB Act mandated various changes in state and local education systems.[70] The RTTT's approach is more adaptable and focused as it allows for individual actions between schools, and is meant to encourage reform within schools without resorting to punishments, whereas the No Child Left Behind Act relies on punishments as its main form of promoting reform in schools.
Another attempt to standardize the education of students is the Common Core State Standards Initiative, also known as Common Core. The Common Core, created in 2009 and 2010, sets benchmarks for the skills that students should have by certain grade levels in subjects such as Math and Language Arts and the system itself is to meant to be a national baseline for how students are achieving. This baseline is meant to help establish what students need in order to achieve in higher education.[71] While the standards are meant to be nationwide, they have only been adopted by 35 states as it is not mandatory for states to subscribe to the Common Core unless they desire federal grants.[71][72] The Common Core Initiative has been criticized as it has not yielded any noticeable improvement in what has almost 10 years since it has been implemented, due to a multiple reasons, from incorrect implementation to content as the idea of a centralized system for education has been criticized for not taking the dynamic differences in learning-style into consideration.[73]
The newest addition to the growing list of government-led initiatives has been the Every Student Succeeds Act, or ESSA. The ESSA, enacted in December 2015, is Congress's replacement for the NCLB. The ESSA takes notes from both the RTTT and the NCLB, by keeping the standardized testing of the NCLB while allowing for the flexibility of the RTTT. The ESSA gives states more say in how schools are held accountable, and how states can act to fix issues at their schools, and as such, states can set long-term goals instead of having to worry about year-to-year performance issues as with the NCLB.[74] States must still identify low performing schools and provide additional support, but now states can focus on long-term solutions. The new bill also focuses more on academic growth, which is subjective and does not always line up with a student's grade level, whereas the NCLB only cared whether students were performing to grade level.[75] By combining the standardized test requirements of the NCLB while allowing for more state control like in the RTTT, the ESSA hopes to achieve long-lasting success and reform.
School-based reform
Initiatives to close the achievement gap have been implemented at the school, district and state level in order to better address the issue. These include investments in pre-kindergarten programs, class size reduction, small schools, curricular reform, alignment of pre-kindergarten through college standards and expectations, and improved teacher education programs.[76] Many schools have started implementing after-school activities such as tutoring sessions, remedial programs, and rapid assessment programs. These programs are meant to help minority students learn at a more accelerated rate in order to help them catch up to their peers. Other schools have started de-tracking their students in order to provide the same quality education for all students, regardless of race. De-tracking not only allows for all students to be taught in the same way, but it also opens up new opportunities for students who would be put on a certain career path by their education.
Teacher-focused reform
Another focus of reform directed toward the achievement gap has been on teacher development, as research shows that since teachers are responsible for almost every aspect of a child's education within the bounds of a classroom. Therefore, in order to best address the achievement gap, reform efforts based on improved teaching are one of the main strategies used to address the gap. This reform effort has been both top-down, in the form of higher state standards for teacher education and preparation,[77] as well as bottom-up, through programs like Teach for America and AmeriCorps that aim to address educational inequity by recruiting and training teachers specifically to work in high-needs schools.[78][79]
Investment in early childhood
One strategy being used to address the achievement gap has been focusing on early childhood development. Economic research shows that investment at this stage is both more effective and cost effective than interventions later in a child's life.[80] By helping develop critical skills early on, these programs cut out the need for such intervention later on. Head Start and various state-funded pre-kindergarten programs target students from low-income families in an attempt to level the playing field for these children before school begins. In addition to increased access, there has also an increased national focus on raising quality standards for Head Start and state-funded pre-K programs, and in improving training and professional development for early care providers.[81]
There is substantial evidence pointing to early childhood development playing a huge role in closing the achievement gap: various studies, including the Carolina Abecedarian study, Child-Parent Center study, and HighScope Perry Preschool study, have shown that pre-K programs can have a positive and long-lasting impact on academic achievement of low-income and minority students.[82][83][84] Furthermore, the role of early childhood education and development has been tied to success even out of the classroom. Pre-K programs help students develop social, emotional, and critical thinking skills at a young age, and while none of this prevents the effects of poverty, it does help in dampening the effects while also better preparing student for their future.[85]
Effects of narrowing the racial achievement gap
Sociologists Christopher Jencks and Meredith Phillips have argued that narrowing the black-white test score gap "would do more to move [the United States] toward racial equality than any politically plausible alternative".[30] As already discussed, there is also strong evidence that narrowing the gap would have a significant positive economic and social impact.[58][86]
Narrowing the achievement gap through technology
Computer and technology use have been linked to increased student achievement. “When teachers and administrators make a sustained commitment to the use of computers in the classroom, student achievement increases (Mann & Shafer, 1997).[87] Randomized experiments demonstrate that the performance of low-achieving students can be improved by using technology that adjusts the level of difficulty of the books and math problems that are presented to each student, raises the probability that each student will achieve high scores on end-of-book reading comprehension quizzes and high accuracy scores on daily math assignments, raises the probability that each student can earn high letter grades, and creates a structured environment where each student is likely to receive regular, objective, positive feedback signaling that he or she is advancing on a daily basis, promoting high self-efficacy and a strong sense of control over academic outcomes.[88][89][90] This demonstrates that it is possible to increase engagement, effort and performance, even when the tasks presented to each student become progressively more difficult, if technology is used to individualize task difficulty and create a structure where it is possible for all students to achieve high reading comprehension and math accuracy scores on a regular basis.[54] A comparison of the cost-effectiveness of this approach indicates that it is more efficient than 22 other strategies for raising student achievement.[91]
Generally, those students who enrolled and finished online courses were older college students (Fetzner, 2013; James, Swan, & Daston., 2016; Newell, 2007; Romero & Usart, 2014 ).[92] Also, these students have better chance to perform higher self-efficacy scores (Xie & Huang, 2014) [93] and future career ambitions or higher incomes (Carr, 2000; Park & Choi, 2009).[94] Studies shows that online learners are tend to less likely to make friends and become socialized (Varela et al., 2012),[95] while there's possible cause for example the experience of disappointing relationships in the context of education (Romero & Usart, 2014).[96]
As Friedman (2007)[97] claimed that the world is flat, online education has made the education becomes more accessible for a wider range of students. But there's also some counter points of online education for example: lack of technical support (Palmer & Holt, 2010; Yang & Cornelius, 2014);[98] inadequate teacher support (Palmer & Holt, 2010);[99] feeling of isolation (Reilly, Gallagher-Lepak, & Killion, 2012; Tucker, 2014; Yang & Cornelius, 2004).[100]
Using technology as a tool for narrowing the achievement gap begins with a purpose, communication, listening, and collaboration. These skills can be achieved through the use of weblogs, social networking sites, feeds, and myriad other multimedia. In classrooms, students can communicate internally, or they can work side by side with others who are located thousands of miles away. Through the use of technology, presentations can be archived so that the material can be reviewed at any time. “All teachers could record important parts of what they do in the classroom that can then be archived to the class Weblog and used by students who may have missed the class or just want a refresher on what happened.” (Richardson, p.117)[101]
Having access to information on the web gives students an advantage to learning. “Students at all levels show more interest in their work and their ability to locate and reflect upon their work is greatly enhanced as are the opportunities for collaborative learning” (Richardson, p.28).[101] Weblogs are different from posts or comments; they require students to analyze and synthesize the content and communicate their understanding with the audience responses in mind.
Technology has been incorporated into the Standards. Even though the NCLB Act holds school districts accountable for student achievement, there are still many students who do not have the resources at home to fully take part in these excellent educational tools. Some teachers feel that technology is not the solution and see it as a risk. Therefore, technology is not always being used to its fullest potential by teachers and students do not gain the advantages technology offers. “Given the fact that the amount of information going online shows no sign of slowing, if they are unable to consistently collect potentially relevant information for their lives and careers and quickly discern what of that information is most useful, they will be at a disadvantage.” (Richardson, p.73).[101]
According to the U.S. Census, by 2012, it is estimated that 70% of homes will have broadband access. While this is a large percentage, it still leaves 30% of households without internet access. The government has lent its hand in closing the Global Achievement Gap by granting funding for low-income school districts for programs such as one-on-one computing, however, the fact that many of these students do not have online capability at home is still a main issue. This digital divide may cause the achievement gap to increase as technology continues to become heavily integrated in the daily coursework for school children. Students need to have Internet access outside of school on a regular basis to successfully complete challenging courswork.
According to National Center for Education Statistics, it noted that African American 12th grade male students had the lowest reading scores among other racial and ethnic group. Reading gaps between African Americans and Whites have increased from 1992 to present (National Center for Education Statistics, 2016).[25] Tonsing-Meyer (2013)[102] claimed that the reading and writing practice was specified and emphasized in 85% of online course assignment, with activities attached, which might improve this situation.
High-performing high-poverty and high-minority schools
Exceptions to the achievement gap exist. Schools that are majority black, even poor, can perform well above national norms, with Davidson Magnet School[citation needed] in Augusta, Georgia being a prominent example. Another school with remarkable gains for students of color is Amistad Academy in New Haven, Connecticut.Additionally North Star Academy has been awarded the National Blue Ribbon School for two years in a row. These schools offer more rigorous, traditional modes of instruction, including Direct Instruction. In one study, Direct Instruction was found to be the single most effective pedagogical method for raising the skill levels of inner-city students (Project Follow Through).[103]
High performing Black schools are not unique to the twentieth century. In Washington, DC in the late 19th century, a predominantly low income Black school performed higher than three White schools in yearly testing. This trend continued until the mid 20th century, and during that time the M Street School exceeded national norms on standardized tests.[104]
Education attainment
(Issued August 2003) Educational attainment by race and gender: 2000[105] Census 2000 Brief Percent of Adults 25 and over in group Ranked by advanced degree HS SC BA AD Asian alone . .. . . . . . . . . . . . . . 80.4 64.6 44.1 17.4 Men . . . . . . . . . . . . . 80.1 52.5 26.1 10.0 White alone, not Hispanic or Latino.. . . . 85.5 55.4 27.0 9.8 White alone... . . . . . . . . . . . . . . 83.6 54.1 26.1 9.5 Women. . . . . . . . . . . . . . . . . . 80.7 51.1 22.8 7.8 Two or more races. . . . . . . . . . . . 73.3 48.1 19.6 7.0 Black or African American alone . . . . . 72.3 42.5 14.3 4.8 Native Hawaiian and Other Pacific Islander 78.3 44.6 13.8 4.1 American Indian and Alaska Native alone . . 70.9 41.7 11.5 3.9 Hispanic or Latino (of any race).. . . . . 52.4 30.3 10.4 3.8 Some other race alone . . . . . . . . . . . 46.8 25.0 7.3 2.3 HS = high school completed SC = some college BA = bachelor's degree AD = advanced degree
African Americans lagged behind whites in 2000 by nearly a factor of two. However, it is less frequently observed[citation needed] that whites lag behind Asians by nearly as large a ratio. The group with the least education is not the African Americans, but the American Indians, Hispanic or Latino or other groups who have quite a different legacy of discrimination.[citation needed] The African-American community is behind the curve in education but statistics show 9 out of 10 young black adults ages 25 to 29 have completed high school or its equivalent.
In 2008, over three million degrees were awarded throughout the United States. Half of all degrees earned were bachelor's degrees. The bachelor's degree is one of the most awarded degrees for all ethnicities and races. Asians obtained bachelor's degrees more than any other race, followed by Whites. Despite high educational expectations, Hispanics are among the least educated group in the United States: 11 percent of those over age 25 have earned a bachelor's degree or higher compared with 17 percent of blacks, 30 percent of whites, and 49 percent of Asian Americans in the same age group (U.S. Census Bureau, 2003).[106] Asians obtain more first professional degrees than any other race. A high percentage[clarification needed] of Hispanics and American Indians/Alaska Natives own an associate's degree compared with other races. About 1–2% doctorate degrees are awarded to all races. The table below shows the number of degrees awarded for each group.
Status and Trends in the Education of Racial and Ethnic Groups (Source: United States Department of Education - 2008)[107]
Race
Associate's degree
Bachelor's degree
Master's degree
First professional degree
Cumulative %
Asians
6.9%
31.6%
14.0%
6.4%
58.9%
Whites
9.3%
21.1%
8.4%
3.1%
41.9%
Blacks
8.9%
13.6%
4.9%
1.3%
28.7%
American Indians/Alaska Natives
8.4%
9.8%
3.6%
1.4%
23.2%
Hispanics
6.1%
9.4%
2.9%
1.0%
19.4%
College and university enrollment
Between 1978 and 2008, college enrollment rates increased for all races. The college enrollment rate is determined by the percentage of high school students who enroll in two-year or four-year college and universities immediately after high school. In 2008, the college enrollment rate for all races was 69%. Although the college rate increased for each racial and ethnic group between 1980 and 2007, the enrollment rates for Blacks and Hispanics did not increase, and the college enrollment rate for Blacks increased from 44% to 56%.[clarification needed] Between 1980 and 2007, the college enrollment rates for Hispanics have increased from 50% to 62%. In comparison, the same rate increased from 49.8% to 77.7% for Whites. There are no data for Asians or American Indians/Alaska Natives regarding enrollment rates from the 1980s to 2007.[108]
In 2009, the enrollment rate of high school graduates reached a historical high of 70.1% (see above for statistics on the racial gap in graduation rates). Asian Americans have the highest enrollment rate (92.2%), followed by Whites (69.2%), Blacks (68.7%), and Hispanics (59.3%).[109]
Parenting influence
Parenting methods are different across cultures, thus can have dramatic influence on educational outcomes.[citation needed] For instance, Asian parents often apply strict rules and parental authoritarianism to their children while many white American parents deem creativity and self-sufficiency to be more valuable.[citation needed]Battle Hymn of the Tiger Mother by Yale Professor Amy Chua highlights some of the very important aspects in Asian parenting method in comparison to the “American way”. Chua's book has generated interests and controversies in the “Tiger Mom” parenting method and its role in determining children's education outcomes.[110] Many Hispanic parents and their children believe that a college degree is necessary for obtaining stable and meaningful work.[111] This attitude is reflected in the educational expectations parents hold for their children and in the expectations that young people have for themselves (U.S. Department of Education, 1995b, p.88).[106] High educational expectations can be found among all racial and ethnic groups regardless of their economic and social resources (p.73). Although parents and children share high educational aims, their aspirations do not necessarily translate into postsecondary matriculation. This is especially the case for Hispanic high school students, particularly those whose parents have not attended college.[112][113]
Parental involvement in children's education is influential to children's success at school.[114] Teachers often view low parental involvement as a barrier to student success. Collaboration between teachers and parents is necessary when working to help a child; parents have the necessary knowledge of what is best for their child's situation.[115] However, the student body in schools is diverse, and although teachers make an effort to try and understand each child's unique cultural beliefs, it is important that they are meeting with parents to get a clear understanding of what needs should be met in order for the student to succeed. School administrators must accommodate and account for family differences and also be supportive by promoting ways families can get involved. For example, schools can provide support by accommodating the needs of the family who have do not have transportation, schools may do so by providing external resources that may benefit the family.[116] As referenced by Feliciano et al. (2016), educators can also account for culture by providing education about the diversity at the school. This can be achieved by creating an environment where both teachers and students learn about cultures represented among the student population.
Larocquem et al. (2011) stated that family involvement may include visiting their children's class, being involved with a parent teacher organization, attending school activities, speaking to the child's class, and volunteering at school events. It is also important for families to be involved with the child's school assignments, especially by holding them accountable for completion and discussion of the work assigned.[115] Also, educators may want to consider how parental language barriers and educational experiences affect families and the influence of contributing to their child's education.[114] In addition, even when families want to get involved, they may not know how to collaborate with school personnel, especially for families who are Hispanic, African American, and or of low economic status.[117] A study done by Nistler and Maiers (2000), found that although different barriers for families may inhibit participation, families reported that they would want to participate nonetheless.[118] Larocque et al. (2011) suggest that teachers need to find out what values and expectations are held for the child, which should be done by involving parents in the decision making process.[115]
Illiteracy
African Americans were once denied educations. Even as late as 1947, about one third of African Americans over 65 were considered to lack the literacy to read and write their own names. However, by 1969, illiteracy as it had been traditionally defined, had been largely eradicated among African Americans—the number of among young adults was less than one percent, though African Americans still lag in more stringent definitions of document literacy. Inability to read, write or speak English in America today is largely an issue for immigrants, mostly from Asia and Latin America.
Illiteracy by age and race: 1947 to 1969 In thousands except percent Civilian noninstitutional population 14 yrs and over Source: US census
Nov 1969
14 ovr
14-24
25-44
45-64
65+
Total
1.0
0.3
0.5
1.1
3.5
White
0.7
0.2
0.4
0.7
2.3
Black
3.6
0.5
1.6
5.5
16.7
Mar 1959
Total
2.2
0.6
1.2
2.6
6.5
White
1.6
0.5
0.8
1.8
5.1
Black
7.5
1.2
5.1
11.3
25.5
Oct 1952
Total
2.5
1.2
1.3
3.5
6.9
White
1.8
0.8
5.0
Black
10.2
3.9
33.3
Oct 1947
Total
2.7
1.0
1.7
4.0
6.7
White
1.8
0.6
4.9
Black
11.0
4.4
32.4
Immigrants
Educational attainment rates change when it comes to comparing the same races against immigrants or foreign born students. Black African and Caribbean immigrant groups to the U.S report having higher levels of education than any other group.[119][failed verification] Of all foreign-born U.S. residents, foreign born Africans (those who come from the African continent) nowadays[when?] have a higher level of educational attainment than any other racial or ethnic group in the United States.[120][121] They tend to be highly educated and be fluent in English. This trend was first reported in the 1990s by the Journal of Blacks in Higher Education,[121] and still continues today.[when?][citation needed]
According to data from the 2000 United States Census, "43.8 percent of African immigrants had achieved a college degree, compared with 42.5 of Asian Americans, 28.9 percent of immigrants from Europe, Russia and Canada and 23.1 percent of the U.S. population as a whole."[122] The educational attainment amount varies by group. According to the U.S. Census, out of the African populations, Nigerians reported to having the highest level of education.[citation needed]
US Census surveys showed that by 1998, 89 percent of African Americans age 25 to 29 had completed high school, lagging only slightly behind 93 percent for whites. For all over the age of 25, clear majorities of whites, Asian Americans and African Americans had graduated at 88 percent, 85 percent and 77 percent, respectively. 56 percent, or barely over half of Hispanics 25 and over, had completed high school.
Conservative African American scholars such as Thomas Sowell observe that while SAT scores are lower for students with less parental education and income. Asian Americans who took the SAT with incomes below $10,000 score 482 in math in 1995, comparable to whites earning $30–40,000 and higher and blacks over $70,000. Test scores in middle-income black communities, such as Prince George County, are still not comparable to those in non-black suburbs.
State standards
Most state tests showing African American failure rates anywhere from two to four times the rate of whites, such as Washington State's WASL test, and only half to one-quarter as likely to achieve a high score, even though these tests were designed to eliminate the negative effects of bias associated with standardized multiple choice tests. It is a top goal of education reform to eliminate the Education gap between all races, though skeptics question whether legislation such as No Child Left Behind truly closes the gap just by raising expectations. Others, such as Alfie Kohn, observe it may merely penalize those who do not score as well as the most educated ethnic and income groups.[125]
Scored Level 3 on WASL Washington Assessment of Student Learning, Mathematics Grade 4 (1997) Data: Office Washington State Superintendent of Instruction
White
Black
Hispanic
Asian
Native American
17.1%
4.0%
4.3%
15.6%
1.6%
Religion
The amount of education completed varies greatly between members of religions in the United States. Hindus and Jews, for example, are more likely than general population to have completed a college education, whereas members of Evangelical churches, historically Black Protestant churches and Jehovah's Witness are less likely (21%, 15% and 12% respectively).[126]
US religions ranked by percentage reporting a college degree:[126]
Rank
Name
High school or less
Some college
College grad
Post grad
Total college+
1
Hindu
12
11
29
48
77
2
Jewish
19
22
29
31
59
3
Buddhist
20
33
28
20
47
4
Atheist
26
31
26
16
43
5
Agnostic
23
36
25
16
42
6
Orthodox Christian
27
34
21
18
40
7
Muslim
36
25
23
17
39
8
Other faiths
29
38
-
-
34
9
Mormon
27
40
23
10
33
10
Mainline Protestant
37
30
19
14
33
11
Other Christian
26
43
-
-
31
12
Unaffiliated
38
32
18
11
29
General population
41
32
17
11
27
13
Catholic
46
27
16
10
26
14
Nothing in particular
45
32
15
9
24
15
Evangelical Protestant
43
35
14
7
21
16
Historically Black Protestant
52
33
9
6
15
17
Jehovah's Witnesses
63
25
9
3
12
International comparisons
International educational math scores (2007) (4th graders average score, TIMSS International Math and Science Study, 2007)
As a whole, students in the United States lagged the best Asian and European nations in the TIMSS international math and science test. However, broken down by race, US Asians scored comparably to Asian nations, white Americans scored comparably to the best European nations. Although some racial generally score lower than whites in the US, they scored as well as whites in other European nations. Hispanic Americans averaged 505, comparable to students Austria and Sweden, while African Americans at 482 were comparable to Norway and Ukraine.[127]
Special programs
Achievement gaps among students may also manifest themselves in the racial and ethnic composition of special education and gifted education programs. Typically, African American and Hispanic students are enrolled in greater numbers in special education programs than their numbers would indicate in most populations, while these groups are underrepresented in gifted programs.[128][129] Research shows that these disproportionate enrollment trends may be a consequence of the differences in educational achievement among groups.[130]
For the past fifty years, there has been a gap in the educational achievement of males and females in the United States, but which gender has been disadvantaged has fluctuated over the years. In the 1970s and 1980s, data showed girls trailing behind boys in a variety of academic performance measures, specifically in test scores in math and science.[131]
Data in the last twenty years shows the general trend of girls outperforming boys in academic achievement in terms of class grades across all subjects and college graduation rates, but boys scoring higher on standardized tests and being better represented in the higher-paying and more prestigious STEM fields (science, technology, engineering, and math).[131] Male students consistently achieved worse school marks than female students from 1913 to 2011 in all countries for which there is data.[132]
Gender gap in literacy
Achievement gaps between boys and girls in the United States are more pronounced in reading and writing than in math and science.
Traditionally, girls have outperformed boys in reading and writing. Although this gap may be minimal in kindergarten, it grows as students continue their education. According to the 2004 National Reading Assessment measured by the US Department of Education, the gap between boys and girls, only slightly noticeable in 4th grade, left boys 14 points behind girls during their 12th grade year.[133] On the 2008 test, female students continued to have higher average reading scores than male students at all three ages. The gap between male and female 4th graders was 7 points in 2008. By 12th grade, there was an 11-point gap between males and females.[133]
On the 2002 National Writing Assessment, boys scored on average 17 points lower than girls in 4th grade. The average gap increased to 21 points by 8th grade and widened to 24 points by senior year in high school.[134] In the more recent 2007 National Assessment of Writing Skills, female students continued to score higher than male students, though margins closed slightly from previous assessments. The average score for female eighth-graders was 20 points higher than males, down 1 point from the 2002 score. For twelfth-graders, females outscored males by 18 points as opposed to 21 points in 2002.[135]
All of these assessments were conducted on a 100-point scale.[133][134][135]
Gender gap in math and science
Which gender is disadvantaged by the gap in math and science achievement largely depends on how academic achievement is being measured. Female students generally have better grades in their math classes, and this gap starts off very minimal but increases with age.[136][137] However, males score higher on standardized math tests, and these score gaps also increase with age. Male students also score higher on measures of college readiness, such as the AP Calculus exams and the math section of the SAT.[138]
The differences in National Assessment for Educational Progress (NAEP) math scores between boys and girls nearly double from the 9-year-olds to the 17-year-olds.[136] This inconsistency in which gender shows more achievement could be due to the fact that class grades, especially in middle and high school, usually depend on a student's completion of homework assignments, and studies have shown that girls report spending more time on homework than boys.[139] The gender gap in mathematics is particularly large among the highest-achieving students; for example, there is a 2.1 to 1 male-female ratio among students who score an 800 on the math portion of the SAT.[140]
At least one study has challenged the existence of the gender gap in mathematics. In 2008 Janet Hyde and others published a study showing that male and female students did equally well on No Child Left Behind standardized tests that were administered in second through eleventh grades in ten states. However, Hyde and her team did find gaps that favored males at the upper end of the achievement distribution and tried to examine gaps on more difficult test questions (previous research has shown that males outperform females on more challenging items), but the tests they examined lacked adequately challenging items. This raised questions about whether there is still a gender gap in math achievement.[141]
There is also a large discrepancy between the number of men and women working in STEM fields. Women have been, and continue to be, underrepresented in these fields. This underrepresentation is evident in the distribution of college majors among men and women; from 1997 to 2007, women earned only 18% of engineering bachelor's degrees.[142]
Gender gap in graduation rates
According to recent data, 55 percent of college students are females and 45 percent are males. From 1995 until 2005, the number of males enrolled in college increased by 18 percent, while the number of female students rose by 27 percent.[143] Males are enrolling in college in greater numbers than ever before, yet fewer than two-thirds of them are graduating with a bachelor's degree. The numbers of both men and women receiving a bachelor's degree have increased significantly, but the increasing rate of female college graduates exceeds the increasing rate for males.[144]
In 2014, the percentage of women with bachelor's degrees was higher than the percentage of men with bachelor's degrees for the first time in America.[145] Women also earn more master's degrees and doctorates than men.[146]
Although more women are graduating with undergraduate degrees, men are still earning disproportionately more in their lifetimes. This could be due to many factors, including different types of jobs for males and females. Females are greatly underrepresented in science and engineering fields, which are typically correlated with high lifetime earnings.[147] Males and females also have vastly different labor market histories based on type of job and time spent in each job.[142]
Possible causes
Teacher interactions
How a student interacts with and is evaluated by his or her teachers is closely correlated with that student's future academic achievement.[citation needed] According to researcher Thomas Good, there are two competing views of how teachers can indirectly impact the achievement of their students. The first is that teachers are more likely to give special attention and extra assistance to students who appear to be struggling in their class. In reading and writing classes, male students are often behind female students in terms of achievement. Therefore, male students are more likely to get more teacher attention, and this extra interaction could give males an advantage in terms of future achievement. The second view is that teachers demand more and show more respect toward students who they view to be high achievers, which creates a cycle in which only students who are perceived to be intelligent receive extra help and teacher attention.[148]
Teacher evaluations
How teachers perceive students’ knowledge and abilities varies by gender and influences classroom processes and student achievement in both reading and math. Teachers usually have higher expectations for students they view as higher achievers and treat these students with more respect.[148] A study by Tach and Farkas has also found that when students are split into reading groups based on their abilities, the students in the higher-ability reading groups are more likely to demonstrate positive learning behaviors and higher achievement.[149]
Teachers are more likely to favor girls when evaluating what types of readers students seem to be. Because studies have shown that teacher perceptions of students can determine how much individualized attention a student receives and can serve as an indicator of future academic progress, if teachers underestimate males’ reading abilities and use ability grouping in their classrooms, male students might be put at a disadvantage and have their learning in reading classes be negatively affected.[149][150] The opposite trend has been found in math classes. Teachers still tend to view math as a “masculine” subject and tend to have higher expectations for and better attitude towards their male students in these classes.[151]
A study by Fennema et al. has also shown that teachers tend to name males when asked to list their “best math students.”[152] Females are more likely than males to be negatively impacted than male students by this underestimation of their math abilities.[153] These gender-specific evaluations from teachers are implicit; usually the teachers have no idea that they are favoring one gender over the other until they are shown concrete evidence, such as a video recording of their classroom. However, even though the discrimination is implicit, it still has negative effects on both male and female students.[148]
There is conflicting evidence about whether teacher assessments of student performance and ability are consistent with cognitive assessments like standardized tests. Teacher assessment evidence comes from a relatively small number of classrooms when compared to standardized tests, which are administered in every public school in all fifty states.[154]
There is speculation that gender stereotyping within classrooms can also lead to differences in academic achievement and representation for female and male students. Math and science are often perceived as “masculine” subjects because they lead to success in “masculine” fields, such as medicine and engineering. English and history, on the other hand, are often perceived as “feminine” subjects because they are more closely aligned with “feminine” jobs, such as teaching or care work. These stereotypes can influence student achievement in these areas.[155]
Research on stereotype threat has shown that gender stereotypes decrease the mathematical self-esteem of many female students, and that this lack of academic confidence leads to anxiety and poorer performance on math exams.[156]
Parent socialization
How a child's parents view his or her skills can also contribute to the gender achievement gap in education. A study by Jacobs and Eccles has shown that adults rate female children as having better social skills than male children, and that girls are more likely to be seen as "good children" than boys.[157] These gender-based stereotypes can perpetuate the gender achievement gap in education by influencing parents' perceptions of their children's skills, and these perceptions can influence the types of activities and subjects parents steer their children toward.[157]
Socio-economic factors
The gender achievement gap, measured by standardized test scores, suspensions, and absences, in favor of female students, is larger at worse schools and among lower-income households. So poverty and school quality are partially responsible for the gap.[158]
Self-regulation and conscientiousness
Girls tend to have better self-regulation skills than boys.[why?] Self-regulation skills correlate with time spent on homework and time spent taking notes in class. This contributes to girls getting better grades than boys in all subjects.[159] See Sex differences in psychology.
Implications of the gender gap
It is important to address the gender achievement gap in education because failure to cultivate the academic talents of any one group will have aggregate negative consequences. If women are underrepresented in STEM fields, and if men are underrepresented in the social sciences and humanities, both genders are missing opportunities to develop diverse skill sets that can help them in the workplace.[155]
If the gender achievement gap in education continues to exist, so does the stereotype that medicine, science, and engineering are all “masculine” fields and that women belong in fields like teaching, counseling, or social work. This stereotype can lead to the image that women who pursue careers in the STEM fields are seen as “nerdy” or “geeky,” and this can have a detrimental effect on the self-esteem of females who do choose to enter these fields.[155]
Researchers have found that the gender achievement gap has a large impact on the future career choices of high-achieving students. Part of this is a result of the college majors that men and women choose; men are more likely to major in engineering or the hard sciences, while women are more likely to receive degrees in English, psychology, or sociology. Therefore, men are statistically more likely to enter careers that have more potential for higher long-term earnings than women.[142]
The careers that are aligned with these majors have different levels of prestige and different salaries, which can lead to a gender wage gap. U.S. Census data indicates that women who work full-time earn only 77% of what their male counterparts earn. For men and women who are ten years out of college, women earn only 69% of the salaries of their male workers.[142]
Attempts to reduce the gender gap
There have been several studies done of interventions aimed at reducing the gender achievement gap in science classes. Some interventions, such as instituting mentoring programs aimed at women or restructuring the course curriculum, have had limited success. The most successful interventions have been a form of psychological interventions called values affirmation. In a famous study of women's achievement in college science by Miyake et al., values affirmation was successful in reducing the differences between male and female academic achievement in college-level introductory physics classes, and it has been particularly effective at combating the psychological phenomenon known as stereotype threat.[160]
Values affirmation exercises require students to either write about their most important values or their least important values two times at the beginning of the 15-week course. After this intervention, the modal grades of women enrolled in the course increased from a C to a B. Psychological interventions such as this one show promise for increasing women's achievement in math and science courses and reducing the achievement gap that exists between the genders in these subject areas, but further research will need to be done in order to determine whether the positive effects are long-lasting.[160]
Barriers for disadvantaged students and efforts to close the gap
Another explanation to address this educational gap is the lack of resources attainable by certain groups of students. A study found that there is a need for financial literacy for students enrolled in colleges and universities. Specifically, there is a need for student knowledge about loans, budgeting, and time requirements for degree completion .[161] Focus group results in the same study concluded that students in search of financial aid information believe that there will be a lack of understanding among advisors and staff regarding minority student's cultural/identity based circumstances. As a result of this belief, many students rather just not seek any services.
On the high school level, a report finds that the greater the number of people of color enrolled at any particular school, the less likely that school has any computer science courses whatsoever .[162] Nationwide economics indicate 1.3 million new jobs in the tech industry by 2022. Meanwhile, African Americans and Latinos only make up about 5 percent of the technical work force.[162]
Supplemental funding for targeted disadvantaged school districts in Ohio showed a reduction in performance gaps between disadvantaged districts and other districts. Supplementing state funds for the districts with higher amount of disadvantaged students produced benefits in the form of student achievement.[163] IDA's or individual development account initiatives introduced in the 1990s to address poverty was found on the belief that poor family's should have access to asset development in order to break the cycle of poverty.[164] As of now most IDA's main focus is on home ownership or starting small businesses. There has been a push for partnerships between community agencies and higher education institutions that would offer IDA's to encourage lower income individuals to turn towards higher education.[164]
Chronic Absenteeism, Socioeconomics, and Solutions: The Past, Preset & Future
Once known as the global leader in educational attainment, America embodied the ideal that education is the key to a strong democracy, economic competitiveness and a world-class standard of living. Accordingly, America valued a strong public school system as the essential component of that perfect democracy. Currently, global ratings show that America’s highest poverty schools are merely performing at the same level as schools in the world’s lowest-achieving countries. Dramatic changes in leadership, policy reform and federal funding cutbacks, led to the neglect of many pertinent social and educational issues. One persistent, and key socioeconomic issue; chronic absenteeism, was ignored and unaided. As a result, this issue snowballed into a large scale problem that ultimately altered the course of America’s previous scholastic success. Today, America has lost its place as the global educational giant, largely due to the insidious nature of chronic absenteeism and its role as a mitigating factor within the public school system. In light of this ever increasing problem facing the nation’s public school systems, the need for a comprehensive and effective, yet achievable set of solutions is ever more present. With these socially constructed criteria at the forefront of potential solutions to this educational dilemma, local and national scholastic communities alike could benefit from asking the simple human services question: Would establishing self-care facilities/services such as free, self-service laundry rooms/machines in Denver Public Schools somehow reduce chronic absenteeism rates, and thereby raise testing and academic performance? This question is befitting of the socioeconomic issue that Denver Public School’s absenteeism rate continues to increase, due in part to challenges faced by the large homeless/ low-income, portion student population. A potential solution to this academic/socioeconomic problem would be to implement self-care programs that provide resources and services such as free laundry facilities on public school campuses.
Homeschooling, also known as home education is the education of children at home or a variety of places other than school. Home education is usually conducted by a parent or tutor or online teacher. Many families use less formal ways of educating. "Homeschooling" is the term commonly used in North America, whereas "home education" is commonly used in the United Kingdom, Europe, and in many Commonwealth countries.
Education in the United States is provided in public, private, and home schools.
The SAT is a standardized test widely used for college admissions in the United States. Since it was debuted by the College Board in 1926, its name and scoring have changed several times; originally called the Scholastic Aptitude Test, it was later called the Scholastic Assessment Test, then the SAT I: Reasoning Test, then the SAT Reasoning Test, then simply the SAT.
The No Child Left Behind Act of 2001 (NCLB) was a U.S. Act of Congress that reauthorized the Elementary and Secondary Education Act; it included Title I provisions applying to disadvantaged students. It supported standards-based education reform based on the premise that setting high standards and establishing measurable goals could improve individual outcomes in education. The Act required states to develop assessments in basic skills. To receive federal school funding, states had to give these assessments to all students at select grade levels.
Summer learning loss is the loss of academic skills and knowledge over the course of summer holidays. The loss in learning varies across grade level, subject matter, and family income. A common finding across numerous studies is that on average, students score lower on standardized tests at the end of the summer than they do at the beginning of summer. Summer loss for all students is estimated to be equal to about 1 month, but this varies across subject matter:
The educational attainment of the U.S. population is similar to that of many other industrialized countries with the vast majority of the population having completed secondary education and a rising number of college graduates that outnumber high school dropouts. As a whole, the population of the United States is spending more years in formal educational programs. As with income, levels differ by race, age, household configuration and geography.
Mathematical anxiety is anxiety about one's ability to do mathematics. It is a phenomenon that is often considered when examining students' problems in mathematics.
Oppositional culture, also known as the ‘’blocked opportunities framework’’ or the “caste theory of education”, is a term most commonly used in studying the sociology of education to explain racial disparities in educational achievement, particularly between white and black Americans. However, the term refers to any subculture's rejection of conformity to prevailing norms and values, not just nonconformity within the educational system. Thus many criminal gangs and religious cults could also be considered oppositional cultures.
Tracking is separating students by academic ability into groups for all subjects or certain classes and curriculum within a school. It may be referred to as streaming or phasing in certain schools.
After-school programs started in the early 1900s mainly just as supervision of students after the final school bell. Today, after-school programs do much more. There is a focus on helping students with school work but can be beneficial to students in other ways. An after-school program, today, will not limit its focus on academics but with a holistic sense of helping the student population. After-school programs started in the early 1900s mainly just as supervision of students after the final school bell. An after-school activity is any organized program that youth can participate in outside of the traditional school day. Some programs are run by a primary or secondary school, while others are run by externally funded non-profit or commercial organizations. After-school youth programs can occur inside a school building or elsewhere in the community, for instance at a community center, church, library, or park. After-school activities are a cornerstone of concerted cultivation, which is a style of parenting that emphasizes children gaining leadership experience and social skills through participating in organized activities. Such children are believed by proponents to be more successful in later life, while others consider too many activities to indicate overparenting. While some research has shown that structured after-school programs can lead to better test scores, improved homework completion, and higher grades, further research has questioned the effectiveness of after-school programs at improving youth outcomes such as externalizing behavior and school attendance. Additionally, certain activities or programs have made strides in closing the achievement gap, or the gap in academic performance between white students and students of color as measured by standardized tests. Though the existence of after-school activities is relatively universal, different countries implement after-school activities differently, causing after-school activities to vary on a global scale.
Sex differences in education are a type of sex discrimination in the education system affecting both men and women during and after their educational experiences. Men are more likely to be literate on a global average, although women are more prevalent at reading in some countries. Men and women find themselves having gender differences when attaining their educational goals. Although men and women can have the same level of education, it is more difficult for women to have higher management jobs, and future employment and financial worries can intensify. Men tended to receive more education than women in the past, but the gender gap in education has reversed in recent decades in most Western countries and many non-Western countries.
Remedial education is assigned to assist students in order to achieve expected competencies in core academic skills such as literacy and numeracy.
Educational inequality is the unequal distribution of academic resources, including but not limited to; school funding, qualified and experienced teachers, books, and technologies to socially excluded communities. These communities tend to be historically disadvantaged and oppressed. More times than not, individuals belonging to these marginalized groups are also denied access to the schools with abundant resources. Inequality leads to major differences in the educational success or efficiency of these individuals and ultimately suppresses social and economic mobility. See Statistic sections for more information.
As an education reform, the broad goal of class size reduction (CSR) is to increase the number of individualized student-teacher interactions intended to improve student learning. A reform long holding theoretical attraction to many constituencies, some have claimed CSR as the most studied educational reform of the last century. Until recently, interpretations of these studies have often been contentious. Some educational groups like the American Federation of Teachers and National Education Association are in favor of reducing class sizes. Others argue that class size reduction has little effect on student achievement. Many are concerned about the costs of reducing class sizes.
Academic performance is the extent to which a student, teacher or institution has achieved their short or long-term educational goals. Cumulative GPA
The racial achievement gap in the United States refers to the educational disparities between various ethnic groups. It manifests itself in a variety of ways: among students, blacks and Hispanics are more likely to receive lower grades, score lower on standardized tests, drop out of high school, and they are less likely to enter and complete college than whites, while whites score lower than Asian Americans.
Many scholars and policymakers have noted that the fields of science, technology, engineering, and mathematics (STEM) have remained predominantly male with historically low participation among women since their origins during the Age of Enlightenment.
Jo Boaler is a British education author and is Professor of Mathematics Education at the Stanford Graduate School of Education. Boaler is involved in promoting mathematics education reform and equitable mathematics classrooms. She is the co-founder of youcubed, a Stanford centre that provides mathematics education resources to teachers, students and parents. She is the author of eight books, including Mathematical Mindsets (2016), What's Math Got To Do With It? (2009) and The Elephant in the Classroom (2010), all written for teachers and parents with the goal of improving mathematics education in both the US and UK. Her 1997/2002 book, Experiencing School Mathematics, won the "Outstanding Book of the Year" award for education in Britain.
The disparity in academics among children in the United States is a result of policy in government, the difference in schools attended by children, the amount of wealth a family holds, the parenting style, the race and ethnicity of the child, and the resources available to the child and school. Educational inequality also causes a number of problems in the United States, one of which is the increasing population in prisons.
Female education in STEM includes child and adult female represented in the fields of science, technology, engineering, and mathematics. In 2017, 33% of students in STEM fields were women.
↑ Social Class Differences in Family-School Relationships: The Impact of Cultural Capital Annette Lareau, 1987
1 2 Tracking: From Theory to Practice Maureen Hallinan 1994
↑ McCoy, K. L. (2012). A study of African American males and their response to online learning (Doctoral dissertation). Available from ProQuest Dissertations and Theses database. (UMI No. 3546682)
↑ Liu, S., Gomez, J., Khan, B., & Yen, C.J. (2007). Toward a learneroriented community college online course dropout framework. International Journal on ELearning, 6(4), 519–542.
↑ National Center for Education Statistics. (2011). The condition of education, 2011. (NCES 2011033), Indicator 43. Retrieved from https://nces.ed.gov/pubsearch/pubsinfo.asp?pubid=2011033
↑ Zickuhr, K., & Smith, A. (2012). Digital differences. Pew Research Center’s Internet & American Life Project, Washington, D.C., 1–41. Retrieved from http://pewinternet.org/Reports/2012/Digital differences.aspx
↑ Hanlon, Harriet; Robert Thatcher; Marvin Cline (1999). "Gender Differences in the Development of EEG Coherence in Normal Children". Developmental Neuropsychology. 16 (3): 479–506. doi:10.1207/s15326942dn1603_27.
↑ Sax, Leonard (2005). Why Gender Matters: What Parents and Teachers Need to Know about the Emerging Science of Sex Differences. Portland: Doubleday.
↑ Hernstein, R. J., and C. Murray, The Bell Curve: Intelligence and Class Structure in American Life (The Free Press, 1994).
1 2 Cravens, Hamilton (2009). "Race, IQ, and Politics in Twentieth-Century America". In Farber, Paul Lawrence; Cravens, Hamilton (eds.). Race and science: scientific challenges to racism in modern America. Oregon State University Press. p.177. ISBN9780870715761.
↑ Richards, Graham (January 2004). Winston, Andrew S. (ed.). Defining difference: race and racism in the history of psychology (1st ed.). American Psychological Association. p.143. ISBN9781591470274.
↑ "Genetic Differences and School Readiness" William T. Dickens, 2005
↑ "Race, IQ, and Jensen" James R. Flynn (London: Routledge, 1980)
↑ Nisbett, Richard. “Race, Genetics, and IQ,” in The Black-White Test Score Gap, edited by Christopher Jencks and Meredith Phillips (Brookings, 1998), pp. 86–102.
↑ "School Readiness: Closing Racial and Ethnic Gaps" Cecilia Rouse, Jeanne Brooks-Gunn, & Sara McLanahan, 2005
↑ Meredith Phillips, James Crouse, and John Ralph, “Does the Black-White Test Score Gap Widen after Children Enter School?” in The Black-White Test Score Gap, edited by Jencks and Phillips (Brookings, 1998)
↑ "Assessment Issues in the Testing of Children at School Entry" Donald A. Rock and A. Jackson Stenner, 2005
↑ "School Readiness and Later Achievement" G. J. Duncan et al, 2007
1 2 National Center for Education Statistics. (2016). Educational attainment of young adults, 2016. Retrieved from https://nces.ed.gov/fastfacts/display.asp?id=27
↑ Palmer, G. A., Bowman, L., & Harroff, P. (2013). Literature review: Barriers to participation in the online learning environment: The role of race and gender. Adult Education Research Conference. Retrieved from http://newprairiepress.org/cgi/viewcontent.cgi?article=3024&context=aerc
1 2 Osborne, J. (2001). Testing stereotype threat: Does anxiety explain race and sex differences in achievement? Contemporary Educational Psychology, 26(3), 291–310. doi:10.1006/ceps.2000.1052
↑ Fairlie, R. W. (2012a). Academic achievement, technology and race: Experimental evidence. Economics of Education Review, 31(5), 663–679. doi:10.1016/j.econedurev.2012.04.003
↑ Rovai, A. P., & Gallien, L. B. (2005). Learning and sense of community: A comparative analysis of African American and Caucasian online graduate students. Journal of Negro Education, 74(1), 53–62.
1 2 3 America's Next Achievement Test: Closing the Black-White Test Score Gap Christopher Jencks and Meredith Phillips 1998
↑ Sparks, Sarah D. (April 22, 2015). "Research on Quality of Conversation Holds Deeper Clues Into Word Gap". Education Week. Educational Projects in Education, Inc. p.1.
↑ Hart and Risley (1995). Meaningful differences in the every day experiences of young children. Baltimore, MD: Paul H Brookes.
1 2 Immigration, Family Life, and Achievement Motivation Among Latino Adolescents Carola Suarez-Orozco and Marcelo Suarez-Orozco 1995
↑ Valencia, Richard R. (April 1, 2002). ""Mexican Americans Don't Value Education!" On the Basis of the Myth, Mythmaking, and Debunking". Journal of Latinos and Education. 1 (2): 81–103. doi:10.1207/s1532771xjle0102_2. ISSN1534-8431.
↑ Patel, Sita G.; Barrera, Alinne Z.; Strambler, Michael J.; Muñoz, Ricardo F.; Macciomei, Erynn (April 2, 2016). "The Achievement Gap Among Newcomer Immigrant Adolescents: Life Stressors Hinder Latina/o Academic Success". Journal of Latinos and Education. 15 (2): 121–133. doi:10.1080/15348431.2015.1099529. ISSN1534-8431.
1 2 Ceballo, Rosario; Maurizi, Laura K.; Suarez, Gloria A.; Aretakis, Maria T. (2014). "Gift and sacrifice: Parental involvement in Latino adolescents' education". Cultural Diversity and Ethnic Minority Psychology. 20 (1): 116–127. doi:10.1037/a0033472. PMID23834259.
↑ Barnard, Wendy Miedel (2004). "Parent involvement in elementary school and educational attainment". Children and Youth Services Review. 26 (1): 39–62. doi:10.1016/j.childyouth.2003.11.002.
↑ Steele, C., and J. Aronson, “Stereotype Threat and the Test Performance of Academically Successful African Americans” (pp. 401–430), in C. Jencks and M. Phillips (Eds.), The Black-White Test Score Gap (Washington, DC: The Brookings Institution, 1998).
↑ Black Students' School Success: Coping with the "Burden of 'Acting White'"Signithia Fordham and John U. Ogbu 1986
↑ Black Students' School Success: Coping with the "Burden of 'Acting White'" Signithia Fordham and John U. Ogbu 1986
↑ Education and the Inequalities of Place Vincent J.Roscigno, Donald Tomaskovic-Devey, and Martha Crowley 2006
↑ Gordon, Kane & Staiger (2006). 'Identifying Effective Teachers Using Performance on the Job.' Brookings Institution.
↑ Why Do Some Schools Group By Ability? Peter G. VanderHart 2006
↑ Detracking: The Social Construction of Ability, Cultural Politics, and Resistance to Reform Jeannie Oakes, Amy Stuart Wells, Makeba Jones, and Amanda Datnow 1997
↑ Urban Teachers' Beliefs on Teaching, Learning, and Students: A Pilot Study in the United States of America Kim Hyunsook Song 2006
↑ Social Class in Public Schools Jennifer L. Hochschild 2003
↑ Is Ability Grouping Equitable? Adam Gamoran 1992
1 2 Crooks, Terence J. (1988). The Impact of Classroom Evaluation Practices on Students. Review of Educational Research, 58(4), 438-481.
1 2 3 Hill, Kennedy T. and Wigfield, Allan (1984). Test Anxiety: A Major Educational Problem and What Can Be Done about It. The Elementary School Journal, 85(1), 105-126.
1 2 3 Yeh, Stuart S. (2017). Solving the achievement gap: Overcoming the structure of school inequality. New York: Palgrave.
1 2 Magnuson, Katherine A.; Waldfogel, Jane (2005). "Early Childhood Care and Education: Effects on Ethnic and Racial Gaps in School Readiness". The Future of Children. 15 (1): 169–196. doi:10.1353/foc.2005.0005. JSTOR1602667.
↑ Bruce Fuller, 2010 (referenced in: "Archived copy"(PDF). Archived from the original(PDF) on December 7, 2010. Retrieved April 13, 2011.CS1 maint: Archived copy as title (link)
↑ "Who Goes to Preschool and Why Does it Matter?" W. Steven Barnett & Donald J. Yarosz, 2007
↑ Krueger, Alan B.; Whitmore, Diane M. (2002). "Would Smaller Classes Help Close the Black-White Achievement Gap?". Bridging the Achievement Gap. The Brookings Institution.
↑ Bambara, C. S., Harbour, C. P., Davies, T. G., & Athey, S. (2009). Delicate engagement: The lived experience of community college students enrolled in highrisk online courses. Community College Review, 36(3), 219–238. doi:10.1177/0091552108327187
↑ Palmer, S., & Holt, D. (2010). Students’ perceptions of the value of the elements of an online learning environment: Looking back in moving forward. Interactive Learning Environments, 18(2), 135–151. doi:10.1080/09539960802364592 Yang, Y. & Cornelius, L.F. (2005). Students' perceptions towards the quality of online education: A qualitative approach. Presented at Association for Educational Communications and Technology Annual Meeting 2005. Retrieved from https://www.learntechlib.org/p/76937/.
↑ Sahin, I., & Shelley, M. (2008). Considering students’ perceptions: The distance education student’s satisfaction model. Journal of Educational Technology and Society, 11(3), 216–223.
↑ Chang, C.S., Liu, E. Z.F., Sung, H.Y., Lin, C. H., Chen, N.S., & Cheng, S.S. (2014). Effects of online college student’s Internet selfefficacy on learning motivation and performance. Innovations in Education and Teaching International, 51(4), 366–377. doi:10.1080/14703297.2013.771429 Ong, C.S., & Lai, J.Y. (2006). Gender differences in perceptions and relationships among dominants of elearning acceptance. Computers in Human Behavior, 22, 816–829. doi:10.1016/j.chb.2004.03.006
↑ Fletcher, R. P. (2015). Voices of persistence: A case study analysis of African American male community college students participating in a firstyear learning community (Doctoral dissertation). Available from ProQuest Dissertations and Theses database. (UMI No. 3737723)
↑ Tucker, W. G. (2014). Spaces for success in higher education: Males of color at an online predominantly white community college (Doctoral dissertation). Available from ProQuest Dissertations and Theses database. (UMI No. 3621155)
↑ "Bridging the Achievement Gap" John E. Chubb & Tom Loveless, 2002
↑ "Doing What Matters Most: Investing in Quality Teaching" Linda Darling-Hammond(prepared for the National Commission on Teaching and America's Future, 1997)
↑ Campbell, F. A.; Ramey, C. T. (1995). "Cognitive and school outcomes for high-risk African-American students at middle adolescence: Positive effects of early intervention". American Educational Research Journal. 32 (4): 743–772. doi:10.3102/00028312032004743.
↑ "The Chicago Child-Parent Centers: A Longitudinal Study of Extended Early Childhood Intervention" Arthur J. Reynolds, 1997
↑ "Long-term Study of Adults who Received High-Quality Early Childhood Care and Education Shows Economic and Social Gains, Less Crime" (http://www.highscope.org/Content.asp?ContentId=282Archived October 9, 2009, at the Portuguese Web Archive)
↑ Yeh, Stuart S. (2009). Shifting the Bell Curve: The Benefits and Costs of Raising Student Achievement. Evaluation and Program Planning, 32(1), 74-82.
↑ Ysseldyke, Jim; Bolt, Daniel M. (2007). "Effect of Technology-Enhanced Continuous Progress Monitoring on Math Achievement". School Psychology Review. 36 (3): 453–467.
↑ Ross, Steven M., Nunnery, John, & Goldfeder, Elizabeth (2004). A Randomized Experiment on the Effects of Accelerated Reader/Reading Renaissance in an Urban School District: Final Evaluation Report. (Memphis, TN: University of Memphis Center for Research in Educational Policy).
↑ Nunnery, John A.; Ross, Steven M.; McDonald, Aaron (2006). "A Randomized Experimental Evaluation of the Impact of Accelerated Reader/Reading Renaissance Implementation on Reading Achievement in Grades 3 to 6". Journal of Education for Students Placed at Risk. 11 (1): 1–18. doi:10.1207/s15327671espr1101_1.
↑ Yeh, Stuart S. (2010). "The Cost-Effectiveness of 22 Approaches for Raising Student Achievement". Journal of Education Finance. 36 (1): 38–75. doi:10.1353/jef.0.0029.
↑ Fetzner, M. (2013). What do unsuccessful online students want us to know? Journal of Asynchronous Learning Networks, 17(1), 13–27. Retrieved from http://files.eric.ed.gov/fulltext/EJ1011376.pdf James, S., Swan, K., & Daston, C. (2016). Retention, progression and the taking of online courses. Online Learning, 20(2). Retrieved from https://onlinelearningconsortium.org/read/journalissues/ Newell, C. C. (2007). Learner characteristics as predictors of online course completion among nontraditional technical college students (Doctoral dissertation). Retrieved from https://getd.libs.uga.edu/pdfs/newell_chandler_c_200705_edd.pdf Romero, M., & Usart, M. (2014). The temporal perspective in higher education learners: Comparisons between online and onsite learning. European Journal of Open, Distance and ELearning, 17(1), 190– 209. doi:10.2478/eurodl20140013
↑ Xie, K., & Huang, K. (2014). The role of beliefs and motivation in asynchronous online learning in collegelevel classes. Journal of Educational Computing Research, 50(3), 315–341. http://dx.doi.org/10.2190/EC.50.3.b
↑ Carr, S. (2000). As distance education comes of age, the challenge is keeping the students. Chronicle of Higher Education, 46(23), 39–41. Park, J., & Choi, H. (2009). Factors influencing adult learners’ decision to drop out or persist in online learning. Educational Technology & Society, 12(4), 207–217.
↑ Varela, O. E., Cater, J. J., & Michel, N. (2012). Online learning in management education: An empirical study of the role of personality traits. Journal of Computing in Higher Education, 24, 209. doi:10.1007/s125280129059x
↑ Romero, M., & Usart, M. (2014). The temporal perspective in higher education learners: Comparisons between online and onsite learning. European Journal of Open, Distance and ELearning, 17(1), 190– 209. doi:10.2478/eurodl20140013
↑ Friedman, T. L. (2007). The world is flat: A brief history of the TwentyFirst Century (3rd ed.). New York, NY: Picador.
↑ Palmer, S., & Holt, D. (2010). Students’ perceptions of the value of the elements of an online learning environment: Looking back in moving forward. Interactive Learning Environments, 18(2), 135–151. doi:10.1080/09539960802364592 Yang, Y. & Cornelius, L.F. (2005). Students' perceptions towards the quality of online education: A qualitative approach. Presented at Association for Educational Communications and Technology Annual Meeting 2005. Retrieved from https://www.learntechlib.org/p/76937/.
↑ Palmer, S., & Holt, D. (2010). Students’ perceptions of the value of the elements of an online learning environment: Looking back in moving forward. Interactive Learning Environments, 18(2), 135–151. doi:10.1080/09539960802364592
↑ Reilly, J., GallagherLepak, S., & Killion, C. (2012). “Me and my computer”: Emotional factors in online learning. Nursing Education Perspectives, 33(2), 100–105. Tucker, W. G. (2014). Spaces for success in higher education: Males of color at an online predominantly white community college (Doctoral dissertation). Available from ProQuest Dissertations and Theses database. (UMI No. 3621155) Yang, Y. & Cornelius, L.F. (2005). Students' perceptions towards the quality of online education: A qualitative approach. Presented at Association for Educational Communications and Technology Annual Meeting 2005. Retrieved from https://www.learntechlib.org/p/76937/.
1 2 3 Richardson, W. (2010), Blogs, Wikis, Podcasts, and Other Powerful Web Tools for Classrooms
↑ TonsingMeyer, J. (2013). An examination of online instructional practices based on the learning styles of graduate education students. The Quarterly Review of Distance Education, 14(3), 141–149.
1 2 3 LaRocque, M.; Kleiman, I.; Darling, S. M. (2011). "Parental involvement: the missing link in school achievement". Preventing School Failure. 55 (3): 115–122. doi:10.1080/10459880903472876.
↑ Flakes, B. M. (2007). Teacher and parent perceptions of parental involvement at W. S. Hornsby Elementary School. (Doctoral dissertation). (Order No. 3278095). Retrieved from https://search.proquest.com/docview/304722541
↑ Barton, A. C.; Drake, C.; Perez, J. G.; St. Louis, K.; George, M. (2004). "Ecologies of parental engagement in urban education". Educational Researcher. 33 (4): 3–12. doi:10.3102/0013189X033004003.
1 2 "African-Born U.S. Residents are the Most Highly Educated Group in American Society". Journal of Blacks in Higher Education. 13 (13): 33–34. 1996. doi:10.2307/2963153. JSTOR2963153.
↑ See Murray, Charles (July 25, 2006). "Acid Tests". Wall Street Journal. He claims NCLB punishes minority students and does not close basic skill differences.
↑ Elliott, R. (1987). Litigating intelligence: IQ tests, special education, and social science in the courtroom. Dover, MA: Auburn House.
↑ Yoon, S. Y., & Gentry, M. (2009). Racial and ethnic representation in gifted programs: Current status of and implications for gifted Asian American students. Gifted Child Quarterly, 53, 121-136. doi:10.1177/0016986208330564
↑ Warne, R. T., Anderson, B., & Johnson, A. O. (2013). The impact of race and ethnicity on the identification process for giftedness in Utah. Journal for the Education of the Gifted, 36, 487-508. doi:10.1177/0162353213506065
1 2 Kafir, Krista (April 2007). "Taking the Boy Crisis in Education Seriously: How School Choice can Boost Achievement Among Boys and Girls." Independent Women's Forum.
↑ Adeleke, M. (2007). "Gender disparity in mathematical performance revisited: can training in problem solving bring difference between boys and girls?". Essays in Education. 21.
↑ Amelink, C. (2009). Information sheet: gender differences in math performance . Assessing Women in Engineering, 1–4.
↑ Lubienski, S. T., McGraw, R., & Strutchens, M. (2004). NAEP findings regarding gender: Mathematics achievement, student affect, and learning practices. In P. Kloosterman, & F. K. Lester Jr. (Eds.), Results and interpretations of the 1990 through 2000 mathematics assessments of the National Assessment of Educational Progress (pp. 305–336). Reston, VA: National Council of Teachers of Mathematics.
↑ Hyde, J. S.; Lindberg, S. M.; Linn, M. C.; Ellis, A. B.; Williams, C. C. (2008). "Gender similarities characterize mathematics performance". Science. 321 (5888): 494–495. doi:10.1126/science.1160364. PMID18653867.
1 2 3 4 Dey, J. G.; Hill, C. (2007). Beyond the Pay Gap. Washington, DC: American Association of University Women Educational Foundation.
↑ Bedard, Kelly; Cho, Insook (2010). "Early gender test score gaps across OECD countries". Economics of Education Review. 29 (1): 348–363. doi:10.1016/j.econedurev.2009.10.015.
1 2 3 Good, T. L. (1987). "Two decades of research on teacher expectations: Findings and future directions". Journal of Teacher Education. 38 (4): 32–47. doi:10.1177/002248718703800406.
1 2 Tach, L. M.; Farkas, G. (2006). "Learning-related behaviors, cognitive skills, and ability grouping when schooling begins". Social Science Research. 35 (4): 1048–1079. doi:10.1016/j.ssresearch.2005.08.001.
↑ Nigro, G., M. Tappan, and S. Desrochers. (2008). The gender divide in academic engagement: Perspectives from Maine boys and young men. Report presented at the annual meeting of the Maine Boys Network conference, Bates College, Lewiston, ME.
↑ Li, Q. (1999). "Teachers' beliefs and gender differences in mathematics: A review". Educational Research. 41 (1): 63–76. doi:10.1080/0013188990410106.
↑ Fennema, E.; Peterson, P. L.; Carpenter, T. P.; Lubinski, C. (1990). "Teachers' attributions and beliefs about girls, boys, and mathematics". Educational Studies in Mathematics. 21 (1): 55–69. doi:10.1007/BF00311015.
↑ McKown, C.; Weinstein, R. S. (2002). "Modeling the role of child ethnicity and gender in children's differential response to teacher expectations". Journal of Applied Social Psychology. 32 (1): 159–184. doi:10.1111/j.1559-1816.2002.tb01425.x.
↑ Robinson, Joseph Paul; Lubienski, Sarah Theule (2010). "The Development of Gender Achievement Gaps in Mathematics and Reading During Elementary and Middle School: Examining Direct Cognitive Assessments and Teacher Ratings". American Educational Research Journal. 48 (2): 268–302. doi:10.3102/0002831210372249.
1 2 Jacobs, Janis E.; Eccles, Jacquelynne S. (1992). "The Impact of Mothers' Gender-Role Stereotypic Beliefs on Mothers' and Children's Ability Perceptions". Journal of Personality and Social Psychology. 63 (6): 932–944. doi:10.1037/0022-3514.63.6.932.
↑ Henry, Gary T., Fortner, C. Kevin, & Thompson, Charles L. (2010). Targeted Funding for Educationally Disadvantaged Students: A Regression Discontinuity Estimate of the Impact on High School Student Achievement. Educational Evaluation and Policy Analysis,32(2), 183-204.
1 2 Kezar, A., Lester, J., & Yang, H. (2010). Nonprofits Partnering With Postsecondary Institutions to Increase Low-Income Student Access. Educational Policy, 24(3), 500-533.
Shapely, K.S., Sheehan, D., Maloney, C., & Caranikas-Walker, F. (2010). Evaluating the Implementation Fidelity of Technology Immersion and Its Relationship with Student Achievement. Journal of Technology, Learning, and Assessment
Yeh, Stuart S. (2017). Solving the Achievement Gap: Overcoming the Structure of School Inequality. New York: Palgrave.
This page is based on this Wikipedia article Text is available under the CC BY-SA 4.0 license; additional terms may apply. Images, videos and audio are available under their respective licenses.