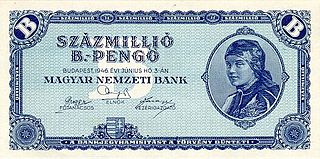
In economics, hyperinflation is a very high and typically accelerating inflation. It quickly erodes the real value of the local currency, as the prices of all goods increase. This causes people to minimize their holdings in that currency as they usually switch to more stable foreign currencies. Effective capital controls and currency substitution ("dollarization") are the orthodox solutions to ending short-term hyperinflation; however there are significant social and economic costs to these policies. Ineffective implementations of these solutions often exacerbate the situation. Many governments choose to attempt to solve structural issues without resorting to those solutions, with the goal of bringing inflation down slowly while minimizing social costs of further economic shocks.

The economy of Nicaragua is focused primarily on the agricultural sector. Nicaragua itself is the least developed country in Central America, and the second poorest in the Americas by nominal GDP. In recent years, under the administrations of Daniel Ortega, the Nicaraguan economy has expanded somewhat, following the Great Recession, when the country's economy actually contracted by 1.5%, due to decreased export demand in the American and Central American markets, lower commodity prices for key agricultural exports, and low remittance growth. The economy saw 4.5% growth in 2010 thanks to a recovery in export demand and growth in its tourism industry. Nicaragua's economy continues to post growth, with preliminary indicators showing the Nicaraguan economy growing an additional 5% in 2011. Consumer Price inflation have also curtailed since 2008, when Nicaragua's inflation rate hovered at 19.82%. In 2009 and 2010, the country posted lower inflation rates, 3.68% and 5.45%, respectively. Remittances are a major source of income, equivalent to 15% of the country's GDP, which originate primarily from Costa Rica, the United States, and European Union member states. Approximately one million Nicaraguans contribute to the remittance sector of the economy.

Reaganomics, or Reaganism, were the neoliberal economic policies promoted by U.S. President Ronald Reagan during the 1980s. These policies are characterized as supply-side economics, trickle-down economics, or "voodoo economics" by opponents, including some Republicans, while Reagan and his advocates preferred to call it free-market economics.

In economics, inflation is a general increase in the prices of goods and services in an economy. This is usually measured using the consumer price index (CPI). When the general price level rises, each unit of currency buys fewer goods and services; consequently, inflation corresponds to a reduction in the purchasing power of money. The opposite of CPI inflation is deflation, a decrease in the general price level of goods and services. The common measure of inflation is the inflation rate, the annualized percentage change in a general price index. As prices faced by households do not all increase at the same rate, the consumer price index (CPI) is often used for this purpose.
In economics, deflation is a decrease in the general price level of goods and services. Deflation occurs when the inflation rate falls below 0%. Inflation reduces the value of currency over time, but deflation increases it. This allows more goods and services to be bought than before with the same amount of currency. Deflation is distinct from disinflation, a slowdown in the inflation rate; i.e., when inflation declines to a lower rate but is still positive.

A consumer price index (CPI) is a price index, the price of a weighted average market basket of consumer goods and services purchased by households. Changes in measured CPI track changes in prices over time. The CPI is calculated by using a representative basket of goods and services. The basket is updated periodically to reflect changes in consumer spending habits. The prices of the goods and services in the basket are collected monthly from a sample of retail and service establishments. The prices are then adjusted for changes in quality or features. Changes in the CPI can be used to track inflation over time and to compare inflation rates between different countries. While rhe CPI is not a perfect measure of inflation or the cost of living, it is a useful tool for tracking these economic indicators.
Real gross domestic product is a macroeconomic measure of the value of economic output adjusted for price changes. This adjustment transforms the money-value measure, nominal GDP, into an index for quantity of total output. Although GDP is total output, it is primarily useful because it closely approximates the total spending: the sum of consumer spending, investment made by industry, excess of exports over imports, and government spending. Due to inflation, GDP increases and does not actually reflect the true growth in an economy. That is why the GDP must be divided by the inflation rate to get the growth of the real GDP. Different organizations use different types of 'Real GDP' measures, for example, the UNCTAD uses 2015 Constant prices and exchange rates while the FRED uses 2009 constant prices and exchange rates, and recently the World Bank switched from 2005 to 2010 constant prices and exchange rates.
In economics, nominalvalue refers to value measured in terms of absolute money amounts, whereas real value is considered and measured against the actual goods or services for which it can be exchanged at a given time. Real value takes into account inflation and the value of an asset in relation to its purchasing power.
The early 1990s recession describes the period of economic downturn affecting much of the Western world in the early 1990s. The impacts of the recession contributed in part to the 1992 U.S. presidential election victory of Bill Clinton over incumbent president George H. W. Bush. The recession also included the resignation of Canadian prime minister Brian Mulroney, the reduction of active companies by 15% and unemployment up to nearly 20% in Finland, civil disturbances in the United Kingdom and the growth of discount stores in the United States and beyond.

The Constitution Alteration (Prices) 1973 was a bill proposing amendments to section 51 of the Australian Constitution which would give the Commonwealth legislative power over prices. The proposed changes to the constitution were not upheld, with Australians voting against the constitutional alteration.
In the United Kingdom, the Retail Prices Index or Retail Price Index (RPI) is a measure of inflation published monthly by the Office for National Statistics. It measures the change in the cost of a representative sample of retail goods and services.
In statistics, economics, and finance, an index is a statistical measure of change in a representative group of individual data points. These data may be derived from any number of sources, including company performance, prices, productivity, and employment. Economic indices track economic health from different perspectives. Examples include the consumer price index, which measures changes in retail prices paid by consumers, and the cost-of-living index (COLI), which measures the relative cost of living over time.
The Dearness Allowance (DA) is a calculation on inflation and allowance paid to civil servant employees (alongside public sector enterprises’ employees as public sector unit employees are also government employees but not civil servants), some private sector employees and civil servant pensioners in India.
In finance, return is a profit on an investment. It comprises any change in value of the investment, and/or cash flows which the investor receives from that investment over a specified time period, such as interest payments, coupons, cash dividends and stock dividends. It may be measured either in absolute terms or as a percentage of the amount invested. The latter is also called the holding period return.

The United States Consumer Price Index (CPI) is a family of various consumer price indices published monthly by the United States Bureau of Labor Statistics (BLS). The most commonly used indices are the CPI-U and the CPI-W, though many alternative versions exist for different uses. For example, the CPI-U is the most popularly cited measure of consumer inflation in the United States, while the CPI-W is used to index Social Security benefit payments.
The 1973–1974 stock market crash caused a bear market between January 1973 and December 1974. Affecting all the major stock markets in the world, particularly the United Kingdom, it was one of the worst stock market downturns since the Great Depression, the other being the financial crisis of 2007–2008. The crash came after the collapse of the Bretton Woods system over the previous two years, with the associated 'Nixon Shock' and United States dollar devaluation under the Smithsonian Agreement. It was compounded by the outbreak of the 1973 oil crisis in October of that year. It was a major event of the 1970s recession.
This page lists details of the consumer price index by country.

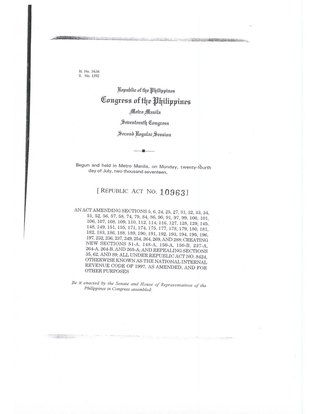
The Tax Reform for Acceleration and Inclusion Law, officially designated as Republic Act No. 10963, is the initial package of the Comprehensive Tax Reform Program (CTRP) signed into law by President Rodrigo Duterte on December 19, 2017.

Following the COVID-19 pandemic in 2020, a worldwide surge in inflation began in mid-2021 and lasted until mid-2022. Many countries saw their highest inflation rates in decades. It has been attributed to various causes, including pandemic-related economic dislocation, supply chain disruptions, the fiscal and monetary stimulus provided in 2020 and 2021 by governments and central banks around the world in response to the pandemic, and price gouging. Preexisting factors that may have contributed to the surge included housing shortages, climate impacts, and government budget deficits have also been cited as factors. Recovery in demand from the COVID-19 recession had, by 2021, revealed significant supply shortages across many business and consumer economic sectors. The inflation rate in the United States and the eurozone peaked in the second half of 2022 and sharply declined in 2023. Despite a worldwide decline, some economists have speculated that higher consumer prices are unlikely to return pre-pandemic levels and may remain elevated. Economists state that for prices to return to pre-pandemic levels a deflationary period would be required, which is usually associated with recession. However, as of August 2024, some average consumer prices in the United States have fallen as consumers have reduced spending while the economy continues to grow.


