Cloud feedback

Last updated
Attribution of individual atmospheric component contributions to the greenhouse effect, separated into feedback and forcing categories (NASA) Attribution of individual atmospheric component contributions to the terrestrial greenhouse effect, separated into feedback and forcing categories (NASA).png
Attribution of individual atmospheric component contributions to the greenhouse effect, separated into feedback and forcing categories (NASA)

Cloud feedback is a type of climate change feedback that has been difficult to quantify in climate models. Clouds can either amplify or dampen the effects of climate change by influencing Earth's energy balance. This is because clouds can affect the magnitude of climate change resulting from external radiative forcings. [1] On the other hand, clouds can affect the magnitude of internally generated climate variability. [2] [3] Climate models represent clouds in different ways, and small changes in cloud cover in the models have a large impact on the predicted climate. [4] [5] Changes in cloud cover are closely coupled with other feedbacks, including the water vapor feedback and ice–albedo feedback.

Contents

Climate change is expected to change the distribution and type of clouds. This can relate to "the spectrum of cloud types, the cloud fraction and height, the radiative properties of clouds, and finally the Earth’s radiation budget". [6] :2224 If cloud cover increases, more sunlight will be reflected back into space, cooling the planet. If clouds become higher and thinner, they act as an insulator, reflecting heat from below back downwards and warming the planet. [7]

Seen from below, clouds emit infrared radiation back to the surface, and so exert a warming effect. But seen from above, clouds reflect sunlight and emit infrared radiation to space, and so exert a cooling effect. [8] Differences in planetary boundary layer cloud modeling can lead to large differences in calculated values of climate sensitivity. A model that decreases boundary layer clouds in response to global warming has a climate sensitivity twice that of a model that does not include this feedback. [9] However, satellite data shows that cloud optical thickness actually increases with increasing temperature. [10] Whether the net effect is warming or cooling depends on details such as the type and altitude of the cloud; details that are difficult to represent in climate models.

In preparation for the 2021 IPCC Sixth Assessment Report, a new generation of climate models have been developed by scientific groups around the world. [11] [12] The average estimated climate sensitivity has increased in Coupled Model Intercomparison Project Phase 6 (CMIP6) compared to the previous generation. Values range from 1.8 to 5.6 °C (3.2 to 10.1 °F) across 27 global climate models. [13] [14] The cause of the increased equilibrium climate sensitivity (ECS) lies mainly in improved modelling of clouds. Temperature rises are now believed to cause sharper decreases in the number of low clouds, and fewer low clouds means more sunlight is absorbed by the planet and less reflected to space. [13] [15] [16]

Definition

According to the IPCC Sixth Assessment Report, cloud feedback is "a climate feedback involving changes in any of the properties of clouds as a response to a change in the local or global surface temperature". [6] :2224

Changes in climate may "affect the spectrum of cloud types, the cloud fraction and height, the radiative properties of clouds, and finally the Earth’s radiation budget". [6] :2224 All of these factors have an impact on the magnitude of cloud feedback and whether it is positive (amplifying) or negative (reducing).

Mechanisms

Examples of some effects of global warming that can amplify (positive feedbacks) or reduce (negative feedbacks) global warming Observations and modeling studies indicate that there is a net positive feedback to Earth's current global warming. 20220726 Feedbacks affecting global warming and climate change - block diagram.svg
Examples of some effects of global warming that can amplify (positive feedbacks) or reduce (negative feedbacks) global warming Observations and modeling studies indicate that there is a net positive feedback to Earth's current global warming.

Global warming is expected to change the distribution and type of clouds. Seen from below, clouds emit infrared radiation back to the surface, and so exert a warming effect; seen from above, clouds reflect sunlight and emit infrared radiation to space, and so exert a cooling effect. Whether the net effect is warming or cooling depends on details such as the type and altitude of the cloud. Low clouds are brighter and optically thicker, while high clouds are optically thin (transparent) in the visible and trap IR. Reduction of low clouds tends to increase incoming solar radiation and therefore have a positive feedback, while a reduction in high clouds (since they mostly just trap IR) would result in a negative feedback. These details were poorly observed before the advent of satellite data and are difficult to represent in climate models. [20] Global climate models were showing a near-zero to moderately strong positive net cloud feedback, but the effective climate sensitivity has increased substantially in the latest generation of global climate models. Differences in the physical representation of clouds in models drive this enhanced climate sensitivity relative to the previous generation of models. [21] [22] [23]

A 2019 simulation predicts that if greenhouse gases reach three times the current level of atmospheric carbon dioxide that stratocumulus clouds could abruptly disperse, contributing to additional global warming. [24] [25]

Aerosols

The extent to which physical factors in the atmosphere or on land affect climate change, including the cooling provided by sulfate aerosols and the dimming they cause. The large error bar shows that there are still substantial unresolved uncertainties. Physical Drivers of climate change.svg
The extent to which physical factors in the atmosphere or on land affect climate change, including the cooling provided by sulfate aerosols and the dimming they cause. The large error bar shows that there are still substantial unresolved uncertainties.

Atmospheric aerosols—fine partices suspended in the air—affect cloud formation and properties, which also alters their impact on climate. While some aerosols, such as black carbon particles, make the clouds darker and thus contribute to warming, [26] by far the strongest effect is from sulfates, which increase the number of cloud droplets, making the clouds more reflective, and helping them cool the climate more. That is known as a direct aerosol effect; however, aerosols also have an indirect effect on liquid water path, and determing it involves computationally heavy continuous calculations of evaporation and condensation within clouds. Climate models generally assume that aerosols increase liquid water path, which makes the clouds even more reflective. [27] However, satellite observations taken in 2010s suggested that aerosols decreased liquid water path instead, and in 2018, this was reproduced in a model which integrated more complex cloud microphysics. [28] Yet, 2019 research found that earlier satellite observations were biased by failing to account for the thickest, most water-heavy clouds naturally raining more and shedding more particulates: very strong aerosol cooling was seen when comparing clouds of the same thickness. [29]

Moreover, large-scale observations can be confounded by changes in other atmospheric factors, like humidity: i.e. it was found that while post-1980 improvements in air quality would have reduced the number of clouds over the East Coast of the United States by around 20%, this was offset by the increase in relative humidity caused by atmospheric response to AMOC slowdown. [30] Similarly, while the initial research looking at sulfates from the 2014–2015 eruption of Bárðarbunga found that they caused no change in liquid water path, [31] it was later suggested that this finding was confounded by counteracting changes in humidity. [30]

Visible ship tracks in the Northern Pacific, on 4 March 2009 ShipTracks.jpg
Visible ship tracks in the Northern Pacific, on 4 March 2009

To avoid confounders, many observations of aerosol effects focus on ship tracks, but post-2020 research found that visible ship tracks are a poor proxy for other clouds, and estimates derived from them overestimate aerosol cooling by as much as 200%. [32] At the same time, other research found that the majority of ship tracks are "invisible" to satellites, meaning that the earlier research had underestimated aerosol cooling by overlooking them. [33] Finally, 2023 research indicates that all climate models have underestimated sulfur emissions from volcanoes which occur in the background, outside of major eruptions, and so had consequently overestimated the cooling provided by anthropogenic aerosols, especially in the Arctic climate. [34]

Early 2010s estimates of past and future anthropogenic global sulfur dioxide emissions, including the Representative Concentration Pathways. While no climate change scenario may reach Maximum Feasible Reductions (MFRs), all assume steep declines from today's levels. By 2019, sulfate emission reductions were confirmed to proceed at a very fast rate. Estimates of past and future SO2 global anthropogenic emissions.png
Early 2010s estimates of past and future anthropogenic global sulfur dioxide emissions, including the Representative Concentration Pathways. While no climate change scenario may reach Maximum Feasible Reductions (MFRs), all assume steep declines from today's levels. By 2019, sulfate emission reductions were confirmed to proceed at a very fast rate.

Estimates of how much aerosols affect cloud cooling are very important, because the amount of sulfate aerosols in the air had undergone dramatic changes in the recent decades. First, it had increased greatly from 1950s to 1980s, largely due to the widespread burning of sulfur-heavy coal, which caused an observable reduction in visible sunlight that had been described as global dimming. [36] [37] Then, it started to decline substantially from the 1990s onwards and is expected to continue to decline in the future, due to the measures to combat acid rain and other impacts of air pollution. [38] Consequently, the aerosols provided a considerable cooling effect which counteracted or "masked" some of the greenhouse effect from human emissions, and this effect had been declining as well, which contributed to acceleration of climate change. [39] Climate models do account for the presence of aerosols and their recent and future decline in their projections, and typically estimate that the cooling they provide in 2020s is similar to the warming from human-added atmospheric methane, meaning that simultaneous reductions in both would effectively cancel each other out. [40] However, the existing uncertainty about aerosol-cloud interactions likewise introduces uncertainty into models, particularly when concerning predictions of changes in weather events over the regions with a poorer historical record of atmospheric observations. [41] [37] [42] [43]

Role as contributor to climate sensitivity

Clouds, such as those in this image (viewed from space), snow, and ice have the biggest influence on how reflective Earth is. When any of these factors change, Earth's albedo can change. Top of Atmosphere.jpg
Clouds, such as those in this image (viewed from space), snow, and ice have the biggest influence on how reflective Earth is. When any of these factors change, Earth’s albedo can change.

Changes in cloud cover is one of several contributors to climate change and climate sensitivity.

The radiative forcing caused by a doubling of atmospheric CO2 levels (from the pre-industrial 280 ppm) is approximately 3.7 watts per square meter (W/m2). In the absence of feedbacks, the energy imbalance would eventually result in roughly 1 °C (1.8 °F) of global warming. That figure is straightforward to calculate by using the Stefan–Boltzmann law [44] [45] and is undisputed. [46]

A further contribution arises from climate feedbacks, both self-reinforcing and balancing. [47] [48] The uncertainty in climate sensitivity estimates is entirely from the modelling of feedbacks in the climate system, including water vapour feedback, ice–albedo feedback, cloud feedback, and lapse rate feedback. [46] Balancing feedbacks tend to counteract warming by increasing the rate at which energy is radiated to space from a warmer planet. Exacerbating feedbacks increase warming; for example, higher temperatures can cause ice to melt, which reduces the ice area and the amount of sunlight the ice reflects, which in turn results in less heat energy being radiated back into space. Climate sensitivity depends on the balance between those feedbacks. [45]

Current understanding in climate models

When the IPCC began to produce its IPCC Sixth Assessment Report in 2020, many climate models began to show a higher climate sensitivity. The estimates for Equilibrium Climate Sensitivity changed from 3.2 °C to 3.7 °C and the estimates for the Transient climate response from 1.8 °C, to 2.0 °C. That is probably because of better understanding of the role of clouds and aerosols. [49]

In preparation for the 2021 IPCC Sixth Assessment Report, a new generation of climate models have been developed by scientific groups around the world. [11] [12] The average estimated climate sensitivity has increased in Coupled Model Intercomparison Project Phase 6 (CMIP6) compared to the previous generation, with values spanning 1.8 to 5.6 °C (3.2 to 10.1 °F) across 27 global climate models and exceeding 4.5 °C (8.1 °F) in 10 of them. [13] [14] The cause of the increased equilibrium climate sensitivity (ECS) lies mainly in improved modelling of clouds. Temperature rises are now believed to cause sharper decreases in the number of low clouds, and fewer low clouds means more sunlight is absorbed by the planet and less reflected to space. [13] [15] [16] Models with the highest ECS values, however, are not consistent with observed warming. [50]

A 2019 simulation predicts that if greenhouse gases reach three times the current level of atmospheric carbon dioxide that stratocumulus clouds could abruptly disperse, contributing to additional global warming. [51]

Relationship with other feedbacks

In addition to how clouds themselves will respond to increased temperatures, other feedbacks affect clouds properties and formation. The amount and vertical distribution of water vapor is closely linked to the formation of clouds. Ice crystals have been shown to largely influence the amount of water vapor. [52] Water vapor in the subtropical upper troposphere has been linked to the convection of water vapor and ice. Changes in subtropical humidity could provide a negative feedback that decreases the amount of water vapor which in turn would act to mediate global climate transitions. [53]

Changes in cloud cover are closely coupled with other feedback, including the water vapor feedback and ice–albedo feedback. Changing climate is expected to alter the relationship between cloud ice and supercooled cloud water, which in turn would influence the microphysics of the cloud which would result in changes in the radiative properties of the cloud. Climate models suggest that a warming will increase fractional cloudiness. The albedo of increased cloudiness cools the climate, resulting in a negative feedback; while the reflection of infrared radiation by clouds warms the climate, resulting in a positive feedback. [54] Increasing temperatures in the polar regions is expected in increase the amount of low-level clouds, whose stratification prevents the convection of moisture to upper levels. This feedback would partially cancel the increased surface warming due to the cloudiness. This negative feedback has less effect than the positive feedback. The upper atmosphere more than cancels negative feedback that causes cooling, and therefore the increase of CO2 is actually exacerbating the positive feedback as more CO2 enters the system. [55]

See also

Related Research Articles

<span class="mw-page-title-main">Causes of climate change</span> Effort to scientifically ascertain mechanisms responsible for recent global warming

The scientific community has been investigating the causes of climate change for decades. After thousands of studies, it came to a consensus, where it is "unequivocal that human influence has warmed the atmosphere, ocean and land since pre-industrial times." This consensus is supported by around 200 scientific organizations worldwide, The dominant role in this climate change has been played by the direct emissions of carbon dioxide from the burning of fossil fuels. Indirect CO2 emissions from land use change, and the emissions of methane, nitrous oxide and other greenhouse gases play major supporting roles.

<span class="mw-page-title-main">Greenhouse effect</span> Atmospheric phenomenon causing planetary warming

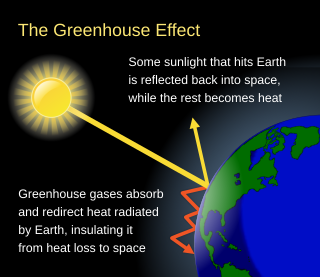
The greenhouse effect occurs when greenhouse gases in a planet's atmosphere insulate the planet from losing heat to space, raising its surface temperature. Surface heating can happen from an internal heat source as in the case of Jupiter, or from its host star as in the case of the Earth. In the case of Earth, the Sun emits shortwave radiation (sunlight) that passes through greenhouse gases to heat the Earth's surface. In response, the Earth's surface emits longwave radiation (heat) that is mostly absorbed by greenhouse gases. That heat absorption reduces the rate at which the Earth can cool off in response to being warmed by the Sun. Adding to greenhouse gases further reduces the rate a planet emits radiation to space, raising its average surface temperature.

<span class="mw-page-title-main">Climate model</span> Quantitative methods used to simulate climate

Numerical climate models are mathematical models that can simulate the interactions of important drivers of climate. These drivers are the atmosphere, oceans, land surface and ice. Scientists use climate models to study the dynamics of the climate system and to make projections of future climate and of climate change. Climate models can also be qualitative models and contain narratives, largely descriptive, of possible futures.

<span class="mw-page-title-main">Sulfate</span> Oxyanion with a central atom of sulfur surrounded by 4 oxygen atoms

The sulfate or sulphate ion is a polyatomic anion with the empirical formula SO2−4. Salts, acid derivatives, and peroxides of sulfate are widely used in industry. Sulfates occur widely in everyday life. Sulfates are salts of sulfuric acid and many are prepared from that acid.

<span class="mw-page-title-main">Global dimming</span> Reduction in the amount of sunlight reaching Earths surface

Global dimming is a decline in the amount of sunlight reaching the Earth's surface, a measure also known as global direct solar irradiance. It was observed soon after the first systematic measurements of solar irradiance began in the 1950s, and continued until 1980s, with an observed reduction of 4–5% per decade, even though solar activity did not vary more than the usual at the time. Instead, global dimming had been attributed to an increase in atmospheric particulate matter, predominantly sulfate aerosols, as the result of rapidly growing air pollution due to post-war industrialization. After 1980s, reductions in particulate emissions have also caused a "partial" reversal of the dimming trend, which has sometimes been described as a global brightening. This reversal is not yet complete, and it has also been globally uneven, as some of the brightening over the developed countries in the 1980s and 1990s had been counteracted by the increased dimming from the industrialization of the developing countries and the expansion of the global shipping industry, although they have also been making rapid progress in cleaning up air pollution in the recent years.

<span class="mw-page-title-main">Radiative forcing</span> Difference between solar irradiance absorbed by the Earth and energy radiated back to space

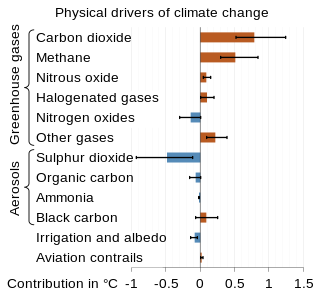
Radiative forcing is a concept used in climate science to quantify the change in energy balance in the Earth's atmosphere caused by various factors, such as concentrations of greenhouse gases, aerosols, and changes in solar radiation. In more technical terms, it is "the change in the net, downward minus upward, radiative flux due to a change in an external driver of climate change." These external drivers are distinguished from feedbacks and variability that are internal to the climate system, and that further influence the direction and magnitude of imbalance.

<span class="mw-page-title-main">Earth's energy budget</span> Accounting of the energy flows which determine Earths surface temperature and drive its climate

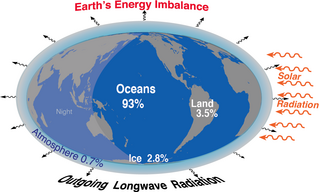
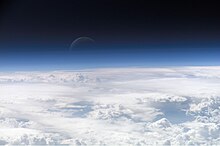
Earth's energy budget accounts for the balance between the energy that Earth receives from the Sun and the energy the Earth loses back into outer space. Smaller energy sources, such as Earth's internal heat, are taken into consideration, but make a tiny contribution compared to solar energy. The energy budget also accounts for how energy moves through the climate system. Because the Sun heats the equatorial tropics more than the polar regions, received solar irradiance is unevenly distributed. As the energy seeks equilibrium across the planet, it drives interactions in Earth's climate system, i.e., Earth's water, ice, atmosphere, rocky crust, and all living things. The result is Earth's climate.

<span class="mw-page-title-main">Climate sensitivity</span> Change in Earths temperature caused by changes in atmospheric carbon dioxide concentrations

Climate sensitivity is a key measure in climate science and describes how much Earth's surface will warm for a doubling in the atmospheric carbon dioxide (CO2) concentration. Its formal definition is: "The change in the surface temperature in response to a change in the atmospheric carbon dioxide (CO2) concentration or other radiative forcing." This concept helps scientists understand the extent and magnitude of the effects of climate change.

The iris hypothesis was a hypothesis proposed by Richard Lindzen and colleagues in 2001 that suggested increased sea surface temperature in the tropics would result in reduced cirrus clouds and thus more infrared radiation leakage from Earth's atmosphere. His study of observed changes in cloud coverage and modeled effects on infrared radiation released to space as a result seemed to support the hypothesis. This suggested infrared radiation leakage was hypothesized to be a negative feedback in which an initial warming would result in an overall cooling of the surface.

<span class="mw-page-title-main">Climate system</span> Interactions that create Earths climate and may result in climate change

Earth's climate system is a complex system with five interacting components: the atmosphere (air), the hydrosphere (water), the cryosphere, the lithosphere and the biosphere. Climate is the statistical characterization of the climate system. It represents the average weather, typically over a period of 30 years, and is determined by a combination of processes, such as ocean currents and wind patterns. Circulation in the atmosphere and oceans transports heat from the tropical regions to regions that receive less energy from the Sun. Solar radiation is the main driving force for this circulation. The water cycle also moves energy throughout the climate system. In addition, certain chemical elements are constantly moving between the components of the climate system. Two examples for these biochemical cycles are the carbon and nitrogen cycles.

<span class="mw-page-title-main">Outgoing longwave radiation</span> Energy transfer mechanism which enables planetary cooling

In climate science, longwave radiation (LWR) is electromagnetic thermal radiation emitted by Earth's surface, atmosphere, and clouds. It may also be referred to as terrestrial radiation. This radiation is in the infrared portion of the spectrum, but is distinct from the shortwave (SW) near-infrared radiation found in sunlight.

<span class="mw-page-title-main">Polar amplification</span>

Polar amplification is the phenomenon that any change in the net radiation balance tends to produce a larger change in temperature near the poles than in the planetary average. This is commonly referred to as the ratio of polar warming to tropical warming. On a planet with an atmosphere that can restrict emission of longwave radiation to space, surface temperatures will be warmer than a simple planetary equilibrium temperature calculation would predict. Where the atmosphere or an extensive ocean is able to transport heat polewards, the poles will be warmer and equatorial regions cooler than their local net radiation balances would predict. The poles will experience the most cooling when the global-mean temperature is lower relative to a reference climate; alternatively, the poles will experience the greatest warming when the global-mean temperature is higher.

<span class="mw-page-title-main">Marine cloud brightening</span> Proposed cloud-seeding technique

Marine cloud brightening also known as marine cloud seeding and marine cloud engineering is a proposed solar radiation management climate engineering technique that would make clouds brighter, reflecting a small fraction of incoming sunlight back into space in order to offset anthropogenic global warming. Along with stratospheric aerosol injection, it is one of the two solar radiation management methods that may most feasibly have a substantial climate impact. The intention is that increasing the Earth's albedo, in combination with greenhouse gas emissions reduction, carbon dioxide removal, and adaptation, would reduce climate change and its risks to people and the environment. If implemented, the cooling effect is expected to be felt rapidly and to be reversible on fairly short time scales. However, technical barriers remain to large-scale marine cloud brightening. There are also risks with such modification of complex climate systems.

<span class="mw-page-title-main">Ice–albedo feedback</span> Positive feedback climate process

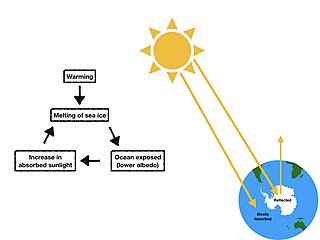
Ice–albedo feedback is a positive feedback climate process where a change in the area of ice caps, glaciers, and sea ice alters the albedo and surface temperature of a planet. Because ice is very reflective, it reflects far more solar energy back to space than open water or any other land cover. It occurs on Earth, and can also occur on exoplanets.

<span class="mw-page-title-main">Stratospheric aerosol injection</span> Putting particles in the stratosphere to reflect sunlight to limit global heating

Stratospheric aerosol injection is a proposed method of solar geoengineering to reduce global warming. This would introduce aerosols into the stratosphere to create a cooling effect via global dimming and increased albedo, which occurs naturally from volcanic winter. It appears that stratospheric aerosol injection, at a moderate intensity, could counter most changes to temperature and precipitation, take effect rapidly, have low direct implementation costs, and be reversible in its direct climatic effects. The Intergovernmental Panel on Climate Change concludes that it "is the most-researched [solar geoengineering] methodagreement that it could limit warming to below 1.5 °C (2.7 °F)." However, like other solar geoengineering approaches, stratospheric aerosol injection would do so imperfectly and other effects are possible, particularly if used in a suboptimal manner.

<span class="mw-page-title-main">History of climate change science</span> Aspect of the history of science

The history of the scientific discovery of climate change began in the early 19th century when ice ages and other natural changes in paleoclimate were first suspected and the natural greenhouse effect was first identified. In the late 19th century, scientists first argued that human emissions of greenhouse gases could change Earth's energy balance and climate. The existence of the greenhouse effect, while not named as such, was proposed as early as 1824 by Joseph Fourier. The argument and the evidence were further strengthened by Claude Pouillet in 1827 and 1838. In 1856 Eunice Newton Foote demonstrated that the warming effect of the sun is greater for air with water vapour than for dry air, and the effect is even greater with carbon dioxide.

<span class="mw-page-title-main">Climate change feedbacks</span> Feedback related to climate change

Climate change feedbacks are effects of global warming that amplify or diminish the effect of forces that initially cause the warming. Positive feedbacks enhance global warming while negative feedbacks weaken it. Feedbacks are important in the understanding of climate change because they play an important part in determining the sensitivity of the climate to warming forces. Climate forcings and feedbacks together determine how much and how fast the climate changes. Large positive feedbacks can lead to tipping points—abrupt or irreversible changes in the climate system—depending upon the rate and magnitude of the climate change.

<span class="mw-page-title-main">Gabriele Hegerl</span> German climatologist (born 1962)

Gabriele Clarissa Hegerl is a German climatologist. She is a professor of climate system science at the University of Edinburgh School of GeoSciences. Prior to 2007 she held research positions at Texas A&M University and at Duke University's Nicholas School of the Environment, during which time she was a co-ordinating lead author for the Intergovernmental Panel on Climate Change (IPCC) Fourth and Fifth Assessment Report.

Joyce Penner is an atmospheric scientist known for her research on climate change, especially on the impact of aerosols and clouds.

<span class="mw-page-title-main">Fixed anvil temperature hypothesis</span> Idea that the temperature at the top of anvil clouds does not depend on Earth surface temperature

Fixed anvil temperature hypothesis is a physical hypothesis that describes the response of cloud radiative properties to rising surface temperatures. It presumes that the temperature at which radiation is emitted by anvil clouds is constrained by radiative processes and thus does not change in response to surface warming. Since the amount of radiation emitted by clouds is a function of their temperature, it implies that it does not increase with surface warming and thus a warmer surface does not increase radiation emissions by cloud tops. The mechanism has been identified both in climate models and observations of cloud behaviour, it affects how much the world heats up for each extra tonne of greenhouse gas in the atmosphere. However, some evidence suggests that it may be more correctly formulated as decreased anvil warming rather than no anvil warming.

References

  1. Stephens, Graeme L. (2005-01-01). "Cloud Feedbacks in the Climate System: A Critical Review". Journal of Climate. 18 (2): 237–273. Bibcode:2005JCli...18..237S. CiteSeerX   10.1.1.130.1415 . doi:10.1175/JCLI-3243.1. ISSN   0894-8755. S2CID   16122908.
  2. Brown, Patrick T.; Li, Wenhong; Jiang, Jonathan H.; Su, Hui (2015-12-07). "Unforced Surface Air Temperature Variability and Its Contrasting Relationship with the Anomalous TOA Energy Flux at Local and Global Spatial Scales" (PDF). Journal of Climate. 29 (3): 925–940. Bibcode:2016JCli...29..925B. doi: 10.1175/JCLI-D-15-0384.1 . ISSN   0894-8755. Archived (PDF) from the original on 2018-07-19.
  3. Bellomo, Katinka; Clement, Amy; Mauritsen, Thorsten; Rädel, Gaby; Stevens, Bjorn (2014-04-11). "Simulating the Role of Subtropical Stratocumulus Clouds in Driving Pacific Climate Variability". Journal of Climate. 27 (13): 5119–5131. Bibcode:2014JCli...27.5119B. doi:10.1175/JCLI-D-13-00548.1. hdl: 11858/00-001M-0000-0014-72C1-F . ISSN   0894-8755. S2CID   33019270.
  4. Cess, R. D.; et al. (1990). "Intercomparison and Interpretation of Climate Feedback Processes in 19 Atmospheric General Circulation Models" (PDF). J. Geophys. Res. 95 (D10): 16, 601–16, 615. Bibcode:1990JGR....9516601C. doi:10.1029/jd095id10p16601. Archived from the original (PDF) on 2018-07-22. Retrieved 2017-10-27.
  5. Stocker, T.F.; et al. (2001). "Physical climate processes and feedbacks". In J.T. Houghton; et al. (eds.). Climate Change 2001: The Scientific Basis, Contributions of Working Group I to the Third Assessment Report of the Intergovernmental Panel on Climate Change. Cambridge, U.K.: Cambridge University Press.
  6. 1 2 3 IPCC, 2021: Annex VII: Glossary [Matthews, J.B.R., V. Möller, R. van Diemen, J.S. Fuglestvedt, V. Masson-Delmotte, C.  Méndez, S. Semenov, A. Reisinger (eds.)]. In Climate Change 2021: The Physical Science Basis. Contribution of Working Group I to the Sixth Assessment Report of the Intergovernmental Panel on Climate Change [Masson-Delmotte, V., P. Zhai, A. Pirani, S.L. Connors, C. Péan, S. Berger, N. Caud, Y. Chen, L. Goldfarb, M.I. Gomis, M. Huang, K. Leitzell, E. Lonnoy, J.B.R. Matthews, T.K. Maycock, T. Waterfield, O. Yelekçi, R. Yu, and B. Zhou (eds.)]. Cambridge University Press, Cambridge, United Kingdom and New York, NY, USA, pp. 2215–2256, doi:10.1017/9781009157896.022.
  7. Williams, Richard G; Ceppi, Paulo; Katavouta, Anna (2020). "Controls of the transient climate response to emissions by physical feedbacks, heat uptake and carbon cycling". Environmental Research Letters. 15 (9): 0940c1. doi:10.1088/1748-9326/ab97c9. ISSN   1748-9326.
  8. Hartmann, D.L.; M.E. Ockert-Bell & M.L. Michelsen (1992). "The Effect of Cloud Type on Earth's Energy Balance: Global Analysis". J. Climate. 5 (11): 1281–1304. Bibcode:1992JCli....5.1281H. doi: 10.1175/1520-0442(1992)005<1281:TEOCTO>2.0.CO;2 .
  9. National Research Council (2004). Understanding Climate Change Feedbacks. Panel on Climate Change Feedbacks, Climate Research Committee. National Academies Press. doi:10.17226/10850. ISBN   978-0-309-09072-8.
  10. Tselioudis, G.; W.B. Rossow & D. Rind (1992). "Global Patterns of Cloud Optical Thickness Variation with Temperature". J. Climate. 5 (12): 1484–1495. Bibcode:1992JCli....5.1484T. doi: 10.1175/1520-0442(1992)005<1484:GPOCOT>2.0.CO;2 .
  11. 1 2 "The CMIP6 landscape (Editorial)". Nature Climate Change. 9 (10): 727. 2019-09-25. Bibcode:2019NatCC...9..727.. doi: 10.1038/s41558-019-0599-1 . ISSN   1758-6798.
  12. 1 2 "New climate models suggest Paris goals may be out of reach". France 24. 2020-01-14. Archived from the original on 14 January 2020. Retrieved 2020-01-18.
  13. 1 2 3 4 Zelinka MD, Myers TA, McCoy DT, Po-Chedley S, Caldwell PM, Ceppi P, Klein SA, Taylor KE (2020). "Causes of Higher Climate Sensitivity in CMIP6 Models". Geophysical Research Letters. 47 (1): e2019GL085782. Bibcode:2020GeoRL..4785782Z. doi: 10.1029/2019GL085782 . hdl: 10044/1/76038 . ISSN   1944-8007.
  14. 1 2 "International analysis narrows range of climate's sensitivity to CO2". UNSW Newsroom. 2020-07-23. Archived from the original on 23 July 2020. Retrieved 2020-07-23.
  15. 1 2 Palmer, Tim (2020-05-26). "Short-term tests validate long-term estimates of climate change". Nature. 582 (7811): 185–186. Bibcode:2020Natur.582..185P. doi: 10.1038/d41586-020-01484-5 . PMID   32457461.
  16. 1 2 Watts, Jonathan (2020-06-13). "Climate worst-case scenarios may not go far enough, cloud data shows". The Guardian. ISSN   0261-3077. Archived from the original on 19 June 2020. Retrieved 2020-06-19.
  17. "The Study of Earth as an Integrated System". nasa.gov. NASA. 2016. Archived from the original on November 2, 2016.
  18. Fig. TS.17, Technical Summary, Sixth Assessment Report (AR6), Working Group I, IPCC, 2021, p. 96. Archived from the original on July 21, 2022.
  19. Stocker, Thomas F.; Dahe, Qin; Plattner, Gian-Kaksper (2013). IPCC AR5 WG1. Technical Summary (PDF). Archived (PDF) from the original on 16 July 2023. See esp. TFE.6: Climate Sensitivity and Feedbacks at p. 82.
  20. Soden, B. J.; Held, I. M. (2006). "An Assessment of Climate Feedbacks in Coupled Ocean–Atmosphere Models". Journal of Climate. 19 (14): 3354. Bibcode:2006JCli...19.3354S. doi: 10.1175/JCLI3799.1 . Interestingly, the true feedback is consistently weaker than the constant relative humidity value, implying a small but robust reduction in relative humidity in all models on average clouds appear to provide a positive feedback in all models
  21. Zelinka, Mark D.; Myers, Timothy A.; McCoy, Daniel T.; Po‐Chedley, Stephen; Caldwell, Peter M.; Ceppi, Paulo; Klein, Stephen A.; Taylor, Karl E. (2020). "Causes of Higher Climate Sensitivity in CMIP6 Models". Geophysical Research Letters. 47 (1): e2019GL085782. Bibcode:2020GeoRL..4785782Z. doi: 10.1029/2019GL085782 . hdl: 10044/1/76038 . ISSN   1944-8007.
  22. Watts, Jonathan (2020-06-13). "Climate worst-case scenarios may not go far enough, cloud data shows". The Guardian. ISSN   0261-3077 . Retrieved 2020-06-19.
  23. Palmer, Tim (2020-05-26). "Short-term tests validate long-term estimates of climate change". Nature. 582 (7811): 185–186. Bibcode:2020Natur.582..185P. doi: 10.1038/d41586-020-01484-5 . PMID   32457461.
  24. Pressel, Kyle G.; Kaul, Colleen M.; Schneider, Tapio (March 2019). "Possible climate transitions from breakup of stratocumulus decks under greenhouse warming" (PDF). Nature Geoscience. 12 (3): 163–167. Bibcode:2019NatGe..12..163S. doi:10.1038/s41561-019-0310-1. ISSN   1752-0908. S2CID   134307699.
  25. Kemp, Luke; Xu, Chi; Depledge, Joanna; Ebi, Kristie L.; Gibbins, Goodwin; Kohler, Timothy A.; Rockström, Johan; Scheffer, Marten; Schellnhuber, Hans Joachim; Steffen, Will; Lenton, Timothy M. (2022-08-23). "Climate Endgame: Exploring catastrophic climate change scenarios". Proceedings of the National Academy of Sciences. 119 (34): e2108146119. Bibcode:2022PNAS..11908146K. doi:10.1073/pnas.2108146119. ISSN   0027-8424. PMC   9407216 . PMID   35914185.
  26. Ramanathan, V.; Carmichael, G. (2008). "Nature Geoscience: Global and regional climate changes due to black carbon". Nature Geoscience. 1 (4): 221–227. Bibcode:2008NatGe...1..221R. doi:10.1038/ngeo156. S2CID   12455550.
  27. McCoy, Daniel T.; Field, Paul; Gordon, Hamish; Elsaesser, Gregory S.; Grosvenor, Daniel P. (6 April 2020). "Untangling causality in midlatitude aerosol–cloud adjustments". Atmospheric Chemistry and Physics. 20 (7): 4085–4103. doi: 10.5194/acp-20-4085-2020 .
  28. Sato, Yousuke; Goto, Daisuke; Michibata, Takuro; Suzuki, Kentaroh; Takemura, Toshihiko; Tomita, Hirofumi; Nakajima, Teruyuki (7 March 2018). "Aerosol effects on cloud water amounts were successfully simulated by a global cloud-system resolving model". Nature Communications. 9 (1): 985. doi: 10.1038/s41467-018-03379-6 . PMC   5841301 . PMID   29515125.
  29. Rosenfeld, Daniel; Zhu, Yannian; Wang, Minghuai; Zheng, Youtong; Goren, Tom; Yu, Shaocai (2019). "Aerosol-driven droplet concentrations dominate coverage and water of oceanic low level clouds" (PDF). Science. 363 (6427): eaav0566. doi: 10.1126/science.aav0566 . PMID   30655446. S2CID   58612273.
  30. 1 2 Cao, Yang; Wang, Minghuai; Rosenfeld, Daniel; Zhu, Yannian; Liang, Yuan; Liu, Zhoukun; Bai, Heming (10 March 2021). "Strong Aerosol Effects on Cloud Amount Based on Long-Term Satellite Observations Over the East Coast of the United States". Geophysical Research Letters. 48 (6): e2020GL091275. doi: 10.1029/2020GL091275 .
  31. Malavelle, Florent F.; Haywood, Jim M.; Jones, Andy; Gettelman, Andrew; Clarisse, Lieven; Bauduin, Sophie; Allan, Richard P.; Karset, Inger Helene H.; Kristjánsson, Jón Egill; Oreopoulos, Lazaros; Cho, Nayeong; Lee, Dongmin; Bellouin, Nicolas; Boucher, Olivier; Grosvenor, Daniel P.; Carslaw, Ken S.; Dhomse, Sandip; Mann, Graham W.; Schmidt, Anja; Coe, Hugh; Hartley, Margaret E.; Dalvi, Mohit; Hill, Adrian A.; Johnson, Ben T.; Johnson, Colin E.; Knight, Jeff R.; O'Connor, Fiona M.; Partridge, Daniel G.; Stier, Philip; Myhre, Gunnar; Platnick, Steven; Stephens, Graeme L.; Takahashi, Hanii; Thordarson, Thorvaldur (22 June 2017). "Strong constraints on aerosol–cloud interactions from volcanic eruptions". Nature. 546 (7659): 485–491. doi:10.1038/nature22974. hdl: 10871/28042 . PMID   28640263. S2CID   205257279.
  32. Glassmeier, Franziska; Hoffmann, Fabian; Johnson, Jill S.; Yamaguchi, Takanobu; Carslaw, Ken S.; Feingold, Graham (29 January 2021). "Aerosol-cloud-climate cooling overestimated by ship-track data". Science. 371 (6528): 485–489. doi: 10.1126/science.abd3980 . PMID   33510021.
  33. Manshausen, Peter; Watson-Parris, Duncan; Christensen, Matthew W.; Jalkanen, Jukka-Pekka; Stier, Philip Stier (7 March 2018). "Invisible ship tracks show large cloud sensitivity to aerosol". Nature. 610 (7930): 101–106. doi: 10.1038/s41586-022-05122-0 . PMC   9534750 . PMID   36198778.
  34. Jongebloed, U. A.; Schauer, A. J.; Cole-Dai, J.; Larrick, C. G.; Wood, R.; Fischer, T. P.; Carn, S. A.; Salimi, S.; Edouard, S. R.; Zhai, S.; Geng, L.; Alexander, B. (2 January 2023). "Underestimated Passive Volcanic Sulfur Degassing Implies Overestimated Anthropogenic Aerosol Forcing". Geophysical Research Letters. 50 (1): e2022GL102061. doi: 10.1029/2022GL102061 . S2CID   255571342.
  35. Xu, Yangyang; Ramanathan, Veerabhadran; Victor, David G. (5 December 2018). "Global warming will happen faster than we think". Nature. 564 (7734): 30–32. Bibcode:2018Natur.564...30X. doi: 10.1038/d41586-018-07586-5 . PMID   30518902.
  36. "Aerosol pollution has caused decades of global dimming". American Geophysical Union . 18 February 2021. Archived from the original on 27 March 2023. Retrieved 18 December 2023.
  37. 1 2 Julsrud, I. R.; Storelvmo, T.; Schulz, M.; Moseid, K. O.; Wild, M. (20 October 2022). "Disentangling Aerosol and Cloud Effects on Dimming and Brightening in Observations and CMIP6". Journal of Geophysical Research: Atmospheres. 127 (21): e2021JD035476. doi: 10.1029/2021JD035476 . hdl: 10852/97300 .
  38. "Air Emissions Trends – Continued Progress Through 2005". U.S. Environmental Protection Agency. 8 July 2014. Archived from the original on 2007-03-17. Retrieved 2007-03-17.
  39. IPCC, 2021: Summary for Policymakers. In: Climate Change 2021: The Physical Science Basis. Contribution of Working Group I to the Sixth Assessment Report of the Intergovernmental Panel on Climate Change [Masson-Delmotte, V., P. Zhai, A. Pirani, S.L. Connors, C. Péan, S. Berger, N. Caud, Y. Chen, L. Goldfarb, M.I. Gomis, M. Huang, K. Leitzell, E. Lonnoy, J.B.R. Matthews, T.K. Maycock, T. Waterfield, O. Yelekçi, R. Yu, and B. Zhou (eds.)]. Cambridge University Press, Cambridge, United Kingdom and New York, NY, USA, pp. 3–32, doi : 10.1017/9781009157896.001.
  40. Zeke Hausfather (29 April 2021). "Explainer: Will global warming 'stop' as soon as net-zero emissions are reached?". Carbon Brief . Retrieved 2023-03-23.
  41. Wang, Zhili; Lin, Lei; Xu, Yangyang; Che, Huizheng; Zhang, Xiaoye; Zhang, Hua; Dong, Wenjie; Wang, Chense; Gui, Ke; Xie, Bing (12 January 2021). "Incorrect Asian aerosols affecting the attribution and projection of regional climate change in CMIP6 models". npj Climate and Atmospheric Science. 4. doi: 10.1029/2021JD035476 . hdl: 10852/97300 .
  42. Persad, Geeta G.; Samset, Bjørn H.; Wilcox, Laura J. (21 November 2022). "Aerosols must be included in climate risk assessments". Nature. 611 (7937): 662–664. doi: 10.1038/d41586-022-03763-9 . PMID   36411334.
  43. Ramachandran, S.; Rupakheti, Maheswar; Cherian, R. (10 February 2022). "Insights into recent aerosol trends over Asia from observations and CMIP6 simulations". Science of the Total Environment. 807 (1): 150756. doi: 10.1016/j.scitotenv.2021.150756 . PMID   34619211. S2CID   238474883.
  44. The calculation is as follows. In equilibrium, the energy of incoming and outgoing radiation have to balance. The outgoing radiation is given by the Stefan–Boltzmann law: . When incoming radiation increases, the outgoing radiation and therefore temperature must increase as well. The temperature rise directly caused by the additional radiative forcing, because of the doubling of CO2 is then given by
    .
    Given an effective temperature of 255 K (−18 °C; −1 °F), a constant lapse rate, the value of the Stefan–Boltzmann constant of 5.67 W/m2 K−4 and around 4 W/m2, the equation gives a climate sensitivity of a world without feedback of approximately 1 K.
  45. 1 2 Roe G (2009). "Feedbacks, Timescales, and Seeing Red". Annual Review of Earth and Planetary Sciences. 37 (1): 93–115. Bibcode:2009AREPS..37...93R. doi:10.1146/annurev.earth.061008.134734. S2CID   66109238.
  46. 1 2 Rahmstorf S (2008). "Anthropogenic Climate Change: Revisiting the Facts" (PDF). In Zedillo E (ed.). Global Warming: Looking Beyond Kyoto. Brookings Institution Press. pp. 34–53. Archived (PDF) from the original on 14 July 2019. Retrieved 14 August 2008.
  47. Lenton TM, Rockström J, Gaffney O, Rahmstorf S, Richardson K, Steffen W, Schellnhuber HJ (November 2019). "Climate tipping points - too risky to bet against". Nature. 575 (7784): 592–595. Bibcode:2019Natur.575..592L. doi: 10.1038/d41586-019-03595-0 . hdl: 10871/40141 . PMID   31776487.
  48. Armstrong McKay, David I.; Staal, Arie; Abrams, Jesse F.; Winkelmann, Ricarda; Sakschewski, Boris; Loriani, Sina; Fetzer, Ingo; Cornell, Sarah E.; Rockström, Johan; Lenton, Timothy M. (2022-09-09). "Exceeding 1.5°C global warming could trigger multiple climate tipping points". Science. 377 (6611): eabn7950. doi:10.1126/science.abn7950. hdl: 10871/131584 . ISSN   0036-8075. PMID   36074831. S2CID   252161375.
  49. "Increased warming in latest generation of climate models likely caused by clouds: New representations of clouds are making models more sensitive to carbon dioxide". Science Daily. 24 June 2020. Archived from the original on 26 June 2020. Retrieved 26 June 2020.
  50. Bender M (2020-02-07). "Climate Change Predictions Have Suddenly Gone Catastrophic. This Is Why". Vice. Archived from the original on 10 February 2020. Retrieved 2020-02-09.
  51. Pressel, Kyle G.; Kaul, Colleen M.; Schneider, Tapio (March 2019). "Possible climate transitions from breakup of stratocumulus decks under greenhouse warming". Nature Geoscience. 12 (3): 163–167. Bibcode:2019NatGe..12..163S. doi:10.1038/s41561-019-0310-1. ISSN   1752-0908. S2CID   134307699.
  52. Donner, L. J.; C. J. Seman; B. J. Soden; R. S. Hemler; J. C. Warren; J. Ström & K.-N. Liou (1997). "Large-scale ice clouds in the GFDL SKYHI general circulation model". J. Geophys. Res. 102 (D18): 21, 745–21, 768. Bibcode:1997JGR...10221745D. doi:10.1029/97JD01488.
  53. Pierrehumbert, R. T.; R. Roca (1998). "Evidence for Control of Atlantic Subtropical Humidity by Large Scale Advection" (PDF). Geophys. Res. Lett. 25 (24): 4537–4540. Bibcode:1998GeoRL..25.4537P. doi: 10.1029/1998GL900203 . Archived (PDF) from the original on 2003-06-08.
  54. Fowler, L.D.; D.A. Randall (1996). "Liquid and Ice Cloud Microphysics in the CSU General Circulation Model. Part III: Sensitivity to Modeling Assumptions". J. Climate. 9 (3): 561–586. Bibcode:1996JCli....9..561F. doi: 10.1175/1520-0442(1996)009<0561:LAICMI>2.0.CO;2 .
  55. Wetherald, R.; S. Manabe (1988). "Cloud Feedback Processes in a General Circulation Model". J. Atmos. Sci. 45 (8): 1397–1416. Bibcode:1988JAtS...45.1397W. doi: 10.1175/1520-0469(1988)045<1397:CFPIAG>2.0.CO;2 .