Demographics of Philadelphia

Last updated

Demographics of Philadelphia
Philadelphia City population pyramid in 2021.svg
Population pyramid of Philadelphia in 2021
Population1,584,064 (2019)
Historical population
YearPop.±%
1683*600    
1731*12,000+1900.0%
1790 28,522+137.7%
1800 41,220+44.5%
1810 53,722+30.3%
1820 63,802+18.8%
1830 80,462+26.1%
1840 93,665+16.4%
1850 121,376+29.6%
1860 565,529+365.9%
1870 674,022+19.2%
1880 847,170+25.7%
1890 1,046,964+23.6%
1900 1,293,697+23.6%
1910 1,549,008+19.7%
1920 1,823,779+17.7%
1930 1,950,961+7.0%
1940 1,931,334−1.0%
1950 2,071,605+7.3%
1960 2,002,512−3.3%
1970 1,948,609−2.7%
1980 1,688,210−13.4%
1990 1,585,577−6.1%
2000 1,517,550−4.3%
2010 1,526,006+0.6%
2019 1,584,064+3.8%
Populations for City of Philadelphia, not for Philadelphia County. Population for Philadelphia County was 54,388 (including 42,520 urban) in 1790; 81,009 (including 69,403 urban) in 1800; 111,210 (including 91,874 urban) in 1810; 137,097 (including 112,772 urban) in 1820; 188,797 (including 161,410 urban) in 1830; 258,037 (including 220,423 urban) in 1840; and 408,762 (including 340,045 urban) in 1850. Under Act of Consolidation, 1854, City of Philadelphia absorbed the various districts, boroughs, townships, other suburbs, and remaining rural area in Philadelphia County as the consolidated City and County of Philadelphia.
Source: [1] [2] [3] [4] [5] [6]

At the 2010 census, [7] there were 1,526,006 people, 590,071 households, and 352,272 families residing in the consolidated city-county of Philadelphia, Pennsylvania. The population density was 4,337.3/km2 (11,233.6/mi2). There were 661,958 housing units at an average density of 1,891.9/km2 (4,900.1/mi2).

Contents

Of the 590,071 households, 27.6% had children under the age of 18 living with them, 32.1% were married couples living together, 22.3% had a female householder with no husband present, and 40.3% were non-families. 33.8% of households were one person and 11.9% were one person aged 65 or older. The average household size was 2.48 and the average family size was 3.22.

The age distribution was 25.3% under the age of 18, 11.1% from 18 to 24, 29.3% from 25 to 44, 20.3% from 45 to 64, and 14.1% 65 or older. The median age was 34 years. For every 100 females, there were 86.8 males. For every 100 females age 18 and over, there were 81.8 males.

The median household income was $30,746 and the median family income was $37,036. Males had a median income of $34,199 versus $28,477 for females. The per capita income for the city was $16,509. 22.9% of the population and 18.4% of families were below the poverty line. 31.3% of those under the age of 18 and 16.9% of those 65 and older were living below the poverty line.

The male-female ratio was 86.8 to 100, with 46.5% of the population male and 53.5% female. Of places with 100,000 or more people, this was the third lowest in the United States. Only Gary, Indiana and Birmingham, Alabama had a higher proportion of women. [8]

Of housing units, 590,071 (89.1%) were occupied and 71,887 (10.9%) were vacant. Of occupied housing units, 349,633 (59.3%) were owner-occupied and 240,438 (40.7%) were renter-occupied.

The mean travel time to work was 32.0 minutes for workers 16 years of age and older. Residents of Center City, however, had much shorter commutes. Center City has the second largest downtown residential population in the country, surpassing Chicago in 2015, and most walk to work.[ citation needed ]


63.97% of Philadelphians drove an automobile to work (including carpools), 25.93% commuted by public transit, 9.22% walked to work, and 0.88% commuted by bicycle. 35.74% of households did not have an automobile. The proportion of Philadelphians who do not commute by auto is high compared to most other American cities, although lower than the proportions in New York City and Washington, D.C..[ citation needed ]

Population history

From its founding in the 17th century through the early 19th century, the City of Philadelphia was considered the area between the Delaware and Schuylkill Rivers and between Vine and South Streets. Although the city proper was second to New York City in population at the time of the first U.S. Census in 1790, Philadelphia County was the most populous urban (or metropolitan) area in the nation until 1810, when it was surpassed by New York. In 1854, the Act of Consolidation incorporated the rest of Philadelphia County and created Philadelphia's modern border. This resulted in a large population increase, evident in the 1860 census.

Philadelphia experienced steady growth between 1860 and 1950, except for a brief lull in the 1930s, which was due in part to the Great Depression. Its population peaked at 2,071,605 in 1950. Between 1950 and 2000, the city lost 554,055 people, or 26.7% of its population. To put this into perspective, Chicago lost 20.0% of its population during the same era, and Baltimore lost 31.4%, according to US Census data. This nationwide trend is often referred to as "white flight", named for the movement of upper- and middle-class white families from the increasingly racially diverse cities in favor of more racially homogeneous suburbs.

In 2011, census data was released showing that Philadelphia had achieved its first confirmed population growth in 60 years. [9] The increase was 0.6 percent. It is attributed to a variety of factors, including increased immigration (especially from countries like India, South Korea and Mexico) and migration from more expensive cities in the Northeast Corridor. [10] Between 2000 and 2010, the city's Hispanic population increased by 44 percent to 187,611 and its Asian population grew by 42 percent to 95,521. [11] Wealthy transplants, Asian American investors from New York City, and African Americans from Washington, D.C. have received media attention for setting their sights on Philadelphia. [12] [13] [14] The ten-year tax abatement, a historically undervalued housing market, improvements to the waterfront, and continuing redevelopment throughout the city are thought[ by whom? ] to be factors drawing people to the area.

Ethnography

2010 map of racial distribution in Philadelphia, based on U.S. Census data. Each dot represents 25 people: White, Black, Asian, Hispanic, or Other (yellow) Race and ethnicity 2010- Philadelphia (5559907949).png
2010 map of racial distribution in Philadelphia, based on U.S. Census data. Each dot represents 25 people: White, Black, Asian, Hispanic, or Other (yellow)

For most of its early history from the 1600s and up until the mid to late 1800s, the vast majority of Philadelphia's population was Protestant and composed mainly of Protestant Anglo-Saxon English Americans, many of whom were Quakers or of Quaker descent. The city also contained significant populations of free Blacks, Welsh Americans, including a great number of Welsh Quakers, such as in the Welsh Tract; Scottish Americans, Ulster Scots Americans, and Pennsylvania Dutch, most notably the German American Mennonites and German Quakers that founded Germantown, as well as the Protestant Swedish American, Finnish American, and Dutch American families that had originally arrived in the Philadelphia area to live in the colony of New Sweden, later taken over by the Dutch colony of New Netherlands before being absorbed into the British colonies. The roots of the Mummers Parade can be traced back to a blend of the traditions of these ethnic groups in Philadelphia during this period, though the celebration would evolve and be altered by the traditions of subsequent immigrant groups.

Statistics

Racial demographics of Philadelphia County
Demographic profile [15] 18501860187018801900191019201930194019501960197019801990200020102020
Non-Hispanic White alone94.3%96.7%96.1%95.9%94.9%94.0%91.7%88.3%87.0%72.2%64.1%57.0%52.1%42.4%36.8%33.7%
Non-Hispanic Black alone5.6%2.8%3.8%3.7%4.6%5.6%7.9%11.2%12.5%26.3%33.2%37.6%39.3%43.6%42.3%37.8%
Hispanic or Latino, any race(s)0.1%0.4%0.1%0.3%0.2%0.3%0.3%0.4%0.4%1.2%2.1%4.0%5.2%8.0%12.3%15.7%
Non-Hispanic Asian and Pacific Islander alone1.3%3.1%3.8%6.3%8.0%
Non-Hispanic Native American
Non-Hispanic Other0.1%0.1%1.9%2.3%4.6%
Non-Hispanic Two or more races

First Immigrant Wave

Prior to the 1820s, the overwhelming majority of German and German-speaking settlers in Philadelphia such as the Pennsylvania Dutch had belonged to Protestant sects. Starting around the 1820s, an increasing number of poor Catholic Germans began to immigrate to Philadelphia, though most German immigrants to Philadelphia continued to be Protestant. By the 1840s, in response to the starvation and poverty that would lead to Great Famine of Ireland, a growing number of impoverished Irish Catholic immigrants began to settle in Philadelphia, leading to a rise in anti-Catholicism, nativism, and anti-Irish sentiment among the majority Protestant population in the city. Hatred for the newly arrived Irish Catholic immigrants culminated in the bloody anti-Irish, anti-Catholic Philadelphia Nativist Riot of 1844 and fueled the rise of the Know-Nothing Party in Philadelphia. At the same time, as the number of poor and unskilled Irish Catholic and German immigrants increased, Philadelphia experienced an increase in freed and fugitive slaves from the South seeking refuge and employment in the city. Both blacks and Irish Catholics were at the bottom of the social hierarchy in Philadelphia at the time, and poor Irish immigrants often competed with African American ex-slaves for menial or unskilled work. The competition between the two ethnic groups led to the 1842 Lombard Street Riot. Also, beginning in the mid to late 1800s, immigrants from China began to settle in Philadelphia, establishing Philadelphia's Chinatown and further diversifying the city's demographics.

Second Immigrant Wave

Like its other immigrant-magnet peers in the Northeast, starting in the late 19th and early 20th centuries, Philadelphia experienced an unprecedented heightened level of immigration. This period of immigration consisted of mainly impoverished Catholic and Jewish, and to a less extent Orthodox Christian immigrants from Southern European and Eastern European countries such as Italy and Poland, as well as a second wave of Catholic immigrants from Ireland. Around this same time, an increasing number of African Americans from the Southern United States began to settle in Philadelphia during the Great Migration.

Though Italians in Philadelphia would experience high levels of discrimination and prejudice, including intense redlining,[ citation needed ] Italians in Philadelphia also significantly altered the culture of Philadelphia and the cuisine, creating the Philadelphia Italian Market, the cheesesteak, the hoagie, and water ice, and introducing pizza and other Italian cuisine to the city. Italian and Irish immigrants and their children in South Philadelphia also revived, altered, and continued the Philadelphia tradition of the Mummers Parade. [16]

1940s to present

Since the 1940s, Philadelphia experienced large waves of Puerto Rican migration. They remain an integral part of the city and a sizable swath of eastern North Philadelphia is considered to have the highest urban concentration of Puerto Ricans in the continental United States. The number of Hispanics and Asian Americans has increased over the past 20 years[ when? ] and continues to accelerate. The number of foreign-born residents increased by 34,000 between 1990 and 2000. Of foreign-born Philadelphians, 38.5% were from Asia, 30.3% were from Europe, 23.4% were from Latin America, and 6.7% were from Africa.

Recent immigrants from Asia are mainly of Indian, Korean, Chinese, Vietnamese, Laotian, Hmong, Filipino, Cambodian, Thai, Pakistani and Bangladeshi backgrounds. In addition, the Latino population continues to grow, as Dominican, Mexican, Colombian, Salvadoran, Guatemalan, Cuban, Honduran and Brazilian immigrants. Puerto Rican often choose Philadelphia when moving to the US mainland. Immigration from various Caribbean countries has also increased substantially since the 1940s. Immigrants from Africa, mainly West Africa and, to a lesser extent, Ethiopia, have also established significant communities in the city.

Non-Hispanic White people

Large concentrations of non-Hispanic whites live in Center City, Northeast Philadelphia, and Northwest Philadelphia (although this is changing).[ citation needed ] Gentrification is altering the racial demographics of predominantly Black neighborhoods close to Center City.

European immigration is also growing, with more Irish, Italian, and Polish immigrants. Recently,[ when? ] thousands of Russian and Ukrainian immigrants from Eastern Europe, many of whom are Jewish have arrived, mainly in Northeast Philadelphia. There are other growing nationalities, which include Spanish, Portuguese, Slovak, Greek and Serbian.

The city's Middle Eastern population has tripled since 1990, with people of Palestinian, Turkish, Azeri, Lebanese, Iranian, Egyptian, Iraqi, Saudi, Syrian and Afghan backgrounds residing in Philadelphia.

Irish

Irish immigrants and the Irish Americans are associated in the North and Northeast Philadelphia neighborhoods, including Fishtown, Kensington, Mayfair, Frankford, Port Richmond, Holmesburg, Harrowgate, and Juniata, as well as Devil's Pocket, Whitman, Gray's Ferry, and particularly Pennsport in South Philadelphia. Philadelphia has the 3rd largest Irish American population in the country. [17]

In the 1960s, many of the Irish in Philadelphia were known to join the Philadelphia Police Department and Philadelphia Fire Department. [18]

Italians

Italian immigrants and the Italian American community are frequently associated with South Philadelphia, including Bella Vista, Central South Philadelphia, Girard Estates, Marconi Plaza, Packer Park, and the Philadelphia Italian Market area. In Northeast Philadelphia and Northwest Philadelphia, Italian neighborhoods are found in Roxborough, Frankford, Wissinoming and Tacony, among others. West Philadelphia also has a smaller but significant Italian and Italian American population in certain neighborhoods. Philadelphia has the 2nd largest Italian American population in the U.S.

Armenians

As of 2012, there were about 25,000 people of Armenian ancestry in the Philadelphia area and/or in South Jersey. [19] The Hamidian massacres prior to the beginning of the 20th century, and subsequent Adana massacre of 1909 and Armenian genocide prompted Armenian immigration to the U.S. There is an Armenian day school in Upper Merion Township, Armenian Sisters Academy (ASA), with a Radnor postal address. [20] [21] In addition organizations catering to children and churches have sponsored weekend Armenian schools. Armenian National Committee of Pennsylvania chairperson Ara Chalian stated in 2012 that the distribution of the ethnic Armenians in the area became more widespread but with the overall numbers about remaining the same.[ citation needed ]

Polish

Poles and Polish Americans, as well as Polish Jews, have a rich history in the Port Richmond-Bridesburg area, as well as areas of Kensington and the Northeast.

Germans

Around 65,000 Germans settled in Philadelphia between 1727 and 1775. [22] Nowadays, it is estimated that over 500,000 people in the Philadelphia metropolitan area have German heritage.

Dutch

The Dutch settled in Philadelphia. [23]

French

There is a French community in Philadelphia. [24]

Scots Irish

There is a Scotch Irish community in Philadelphia. [25]

Slovaks

There is a Slovak community in Philadelphia. [26]

Greeks

There is a Greek community and a Greektown in Philadelphia. [27]

Non-Hispanic Black people

Non-Hispanic Black people make up 32% of Philadelphia's population, and 44% when including Hispanic Black people. The African-American population represents the vast majority of Black residents in the city and about 39% of the citywide population. The remaining Black population being Black immigrants from the Caribbean and Africa, and Afro-Hispanics within the Puerto Rican and Dominican communities. [28] [29] [30] [31]

Circa 2008, a phenomenon of polygamy occurred among Muslims in Philadelphia who were Black. Persons engaging in that behavior had the potential of being prosecuted by the state government for bigamy. [32]

African Americans

The largest concentrations of native-born Black people are in Germantown, North Philadelphia East of Germantown Avenue, the Point Breeze neighborhood of South Philadelphia, parts of Southwest Philadelphia, and West Philadelphia. Together these neighborhoods have a population of about 610,000 and are roughly 82% black; making it the 4th largest predominantly Black area in the United States after Bedford-Stuyvesant, Brooklyn, Detroit, and South Side Chicago. Philadelphia has one of the largest African American communities in the US. [33] [34]

African immigrant groups

Philadelphia has one of the most notable West African populations in the United States. As of 2010, there were 25,570 people of recent African origins living in Philadelphia. The largest Sub-Saharan African populations within the city are Nigerians and Liberians. [35]

In 2005, Philadelphia had immigrants from Ethiopia, Ghana, the Ivory Coast, Liberia, Nigeria, and Sierra Leone. [36] By 2008, about 15,000 Liberians had immigrated to Philadelphia area, the Liberians left their native country due to two civil wars and the destruction of Liberian infrastructure. [37] The African population is largely concentrated in West and Southwest sections of Philadelphia. However, the Cedar Park neighborhood is the only neighborhood predominantly made up of West Indian/Caribbean and Sub-Saharan African immigrants.

Around 2005, there had been instances of violence perpetrated by native-born African-Americans against African immigrants. The head of the Liberian Association of Pennsylvania, Samuel Slewion, said that as a result many African immigrants withdrew children from public schools. [36] The head of African Congress USA, Cyprian Anyanwu, proposed a charter school to improve relations between native-born blacks and immigrants; his 2003 proposal was rejected by the city, and he issued a revised proposal in 2005. [38]

Caribbean-Americans

Philadelphia also has a large West Indian community from the Caribbean islands. The West Indian population is largely concentrated in West Philadelphia, with smaller numbers in the Southwest and Northeast sections. As of 2010, there were 24,608 people of West Indian ancestry living in Philadelphia, representing about 1.6 percent of the city, the vast majority of which are Haitians and Jamaicans. [35] Though, the number of West Indians balloons when including other areas in the Philadelphia metropolitan area and not just the city itself. The Philadelphia area has one of the largest Jamaican populations in the country. Jamaicans.com features Philadelphia and Jamaican culture in the city. [39] Most West Indians live in West and Southwest Philadelphia. However, the Cedar Park neighborhood is the only neighborhood predominantly made up of West Indian/Caribbean and African immigrants.

Though, Haitians and Jamaicans are near even in population, Jamaicans represent the majority of West Indians in West Philadelphia, where most of the overall West Indian population lives. This is because Haitians are more evenly distributed throughout the city, outside of West Philadelphia, there are smaller numbers of Haitians in several neighborhoods in the Lower Northeast. Aside from Haitians and Jamaicans, there are also sizable numbers of Trinidadians and Bajans.

Hispanics and Latinos

As of the 2010 census, there were 187,611 Latinos and Hispanics in Philadelphia, constituting over 12 percent of the city's population, the vast majority of which are Puerto Ricans. [40] Most Philadelphia Hispanics self-identify as either White, Black, Mixed, or other, for government purposes i.e. United States Census.

In the early 20th century, companies such as the Pennsylvania Railroad and Spanish-speaking immigrant networks attracted Spanish-speaking workers to Philadelphia. [41] By 1910 several Latino and Hispanic groups had resided in Philadelphia. Cubans and Spaniards founded and initially lead the Latino and Hispanic community organizations. Due to the Immigration Act of 1924 Puerto Ricans, who were already U.S. citizens, became the predominant Hispanic group and had taken control of the organizations by the 1950s. Other Latino and Hispanic groups began establishing themselves by the 1960s. [40] By 2005, most of the leadership was still Puerto Rican and some non-Puerto Ricans had taken some leadership positions [42]

Puerto Ricans

As of 2010, there was a population of 121,643 Puerto Ricans living in Philadelphia. This meant that Puerto Ricans are the largest Latino group in the city and that Philadelphia has the second largest Puerto Rican population, after New York City. [43] [44] Though, smaller numbers of Puerto Ricans can be found throughout the city, overall, eastern North Philadelphia has one of the highest concentrations of Puerto Ricans in the country, largely the result of high levels of segregation and a very large Puerto Rican population. [45] [46]

Philadelphia has been a heavy Puerto Rican destination since the 1950s, though migration to the city has picked up and now Philadelphia has one of the fastest-growing Puerto Rican populations in the country. Puerto Ricans constitute over 75% of the Latino population in the city.[ when? ] Most Puerto Ricans live in the areas of North Philadelphia east of Germantown Avenue (eastern North Philadelphia), and to a lesser extent the Lower Northeast and Uptown sections of the city. In fact, the Fairhill section of Eastern North Philadelphia, particularly the blocks between 6th Street and B Street, north of York Street and south of Erie Avenue, have some of highest concentrations of Puerto Ricans in the country, with most blocks usually being around 85-90% Puerto Rican alone, [47] [ failed verification ] with most of the remaining portion made up of Dominicans and African Americans. Increases in Latino immigration and migration have fueled the growth of El Centro de Oro in Fairhill.

Puerto Ricans make up the majority of Hispanics inside of the city of Philadelphia and in the Philadelphia metropolitan area as whole, numbering about 300,000 in far southeastern Pennsylvania (around Philadelphia), and neighboring areas in New Jersey and Delaware, making up 60% of Metro Philly's Hispanics and 4.5% of Philadelphia metro as a whole.

Dominicans

As of the 2010 census, there were 15,963 Dominicans in Philadelphia, up from 4,337 in 2000. Dominicans are now the second-largest Hispanic group in Philadelphia and the city has the 6th largest Dominican population in the US. [43] [48]

Dominicans began coming to Philadelphia after 1965. [40] Prior to 1990, there was a very small population of Dominicans. Then a significant wave of Dominican immigration started in 1990 with a group of Dominicans moving from New York to gain jobs. [48] Though, immigration from the Dominican Republic to the Philadelphia region is increasing, most Dominicans moving to Philadelphia actually come from New York City and other nearby areas. [44] [49] [50] The vast majority of Dominicans live scattered in Lower Northeast and eastern North Philadelphia especially north of Erie Avenue, sharing neighborhoods with the city's larger Puerto Rican population. [51] Smaller numbers of Dominicans live in West Philadelphia. Recent estimates have the current Dominican population according to the 2017 Census from 29,524 to as high as 65,000 people of Dominican descent, the latter estimate giving Philadelphia the second-largest Dominican population amongst American cities. [52] [53] Only New York, NY has more Dominican Americans. Dominicans are one of Philadelphia's fastest growing ethnic groups. [48]

Mexicans

As of the 2010 U.S. Census there were an estimated 15,531 Mexicans in Philadelphia, up from 6,220 in 2000. [43] [44] [54]

A small group of Mexicans arrived in the 19th Century. A small group of Mexicans remained throughout the city's history. A group of Mexicans arrived in the 1970s. [44] Small Mexican communities in South Philadelphia opened as a result of a 1990s wave of Mexican immigration. [48] [54] Another wave of immigration started in 1998 with Mexicans arriving from Mexico and areas outside of Mexico such as New York. [48] [54]

Most of Philadelphia's Mexican community lives in the area of South Philadelphia east of Broad Street, adding to the area's melting pot like cultural mix, sharing neighborhoods with Italian Americans and Asian immigrants. [44] As of 2011 most Mexicans in South Philadelphia originate from the state of Puebla. [44] [54] Mexican immigrants have drastically changed the Italian area in South Philadelphia and have set up a small community in and around the market. [55]

The Carnaval de Puebla, one of the largest Poblano carnivals (a celebration of the Battle of Puebla) held in countries other than Mexico, began circa 2006. It is held every May. [55]

Cubans

As of the 2010 census, there was an estimate of 3,930 Cubans. [43] [48] Cubans, along with Spaniards, had founded and initially controlled several Latino and Hispanic organizations in Philadelphia. In the early 1960s large numbers of Cuban refugees arrived in Philadelphia. [40]

Other Latino and Hispanic groups

As of the 2010 census, Hispanics of all other Hispanic groups numbered nearly 30,000, including an estimate of 4,675 Colombians, 2,262 Guatemalans, 1,641 Hondurans, 1,542 Ecuadorians, 1,085 Peruvians, 1,049 Salvadorans, 1,006 Argentineans. [43] [48] [56]

Asian Americans

The Asian American community has long been established in the city's bustling Chinatown district, but recent Vietnamese immigrants have also forged neighborhoods and bazaars alongside the venerable Italian market. Korean immigrants have notably added to the melting pot of Olney.[ citation needed ] In several decades before 2010, the cost of living in Chinatown increased due to an influx in settlement, so Asian Americans began moving to other neighborhoods in northwestern Philadelphia, northeastern Philadelphia, and South Philadelphia. [57] As of January 22, 2010, according to David Elesh, a Temple University urban sociologist, there were almost 60,000 Philadelphia residents who stated that they were born in China and many of them lived in South Philadelphia. [58]

There is an ethnic Pakistani congregation at St. William Church in Philadelphia. [59]

In 1999 there were about 1,500 people who were Japanese citizens with non-immigrant visas or Japanese immigrants to the Philadelphia area. There is a weekend school for Japanese people, [60] Japanese Language School of Philadelphia (JLSP, フィラデルフィア日本語補習授業校 Firaderufia Nihongo Hoshū Jugyō Kō) located in Wynnewood, Lower Merion Township. [61]

Hmong

A group of Hmong refugees had settled in Philadelphia after the end of the 1970s Laotian Civil War. They were attacked in discriminatory acts, and the city's Commission on Human Relations held hearings on the incidents. Anne Fadiman, author of The Spirit Catches You and You Fall Down , said that lower-class residents resented the Hmong receiving a $100,000 federal grant for employment assistance when they were also out of work; they believed that American citizens should be getting assistance. [62] Bee Xiong, a Hmong leader in Philadelphia, stated that by the late 1970s there were up to 5,000 Hmong in Philadelphia but by in 1984 there were 650 Hmong. [63] Between 1982 and 1984, three quarters of the Hmong people who had settled in Philadelphia left for other cities in the United States to join relatives who were already there. [64] Reverend Edward V. Avery, a Roman Catholic priest quoted in The Philadelphia Inquirer, stated that unemployed black youths questioned why Hmong people instead of native-born U.S. citizens received the federal aid, and that contributed to violence against Hmong people. [63] A U.S. Attorney, Edward S.G. Dennis, had begun an investigation by 1984. His office asked the Federal Bureau of Investigation (FBI) to determine if there was a hate crime. By the same year Xiong opened an employment assistance office to stabilize what was left of the Hmong population. He had used $100,000 in federal grants. [63]

Native Americans

About 13,000 Philadelphians identified as Native American on the 2010 census. What is now the Philadelphia region is the ancestral territory of the Lenni Lenape, but by the mid-19th century violence and fraudulent land purchases had driven most of them out of Pennsylvania and the 21st century Native American community includes members of many other nations as well. [65]

Romani

Some Macedonian Romani people live in Philadelphia. [66]

Religion

Christianity is the dominant religion in the city of Philadelphia. According to a 2014 study by the Pew Research Center, 68% of the population of the city identified themselves as Christians. [67] The majority of the population is Protestant, with the various Protestant and non-Catholic Christian denominations combined make up a majority of the Christian population at approximately 42% of the city's population; however, the largest single Christian denomination is Roman Catholic, at 26%. [67] Metropolitan Philadelphia's Jewish population, the sixth largest in the United States, was estimated at 206,000 in 2001. [68] There is also a significant Eastern Orthodox population. The greater Philadelphia area is home to one of the largest Lutheran communities in the United States (the largest on the East Coast).[ citation needed ]

Many other religions have arrived, including Islam and Hinduism. With immigration from the Middle East, the Horn of Africa, Pakistan, Bangladesh and India, these two religions have increased their presence. The largest concentrations of Muslims and Hindus live in the Northeast and North parts of the city, Center City, West Philadelphia, and sprawling into the nearby suburbs.

The Muslim African American community in Philadelphia has grown substantially over the last decade. [69] According to several statistics, Philadelphia has surpassed Detroit and New York City to become the American metropolitan area with the highest proportion of Muslims. [70]

Religions with less numerous adherents can also be found. There are pockets of Buddhists in Center City, Chinatown, Northeast Philly, and other neighborhoods with significant Asian American populations. [71] There are Caribbean and African traditional religions in North and West Philadelphia. These numbers are also growing. Historically the city has strong connections to The Religious Society of Friends, Unitarian Universalism, and Ethical Culture, all of which continue to be represented in the city. The Friends General Conference is based in Philadelphia. African diasporic religions are popular in Hispanic and Caribbean communities in North and West Philadelphia. [72] [73] [74]

Ethno-religious groups

Jews

Ancestries

Ancestry by origin [75] Number%
American32,573
Arab13,590

Related Research Articles

<span class="mw-page-title-main">Demographics of Puerto Rico</span> Demographic features of the population of Puerto Rico

The population of Puerto Rico has been shaped by native American settlement, European colonization especially under the Spanish Empire, slavery and economic migration. Demographic features of the population of Puerto Rico include population density, ethnicity, education of the populace, health of the populace, economic status, religious affiliations and other aspects of the population.

<span class="mw-page-title-main">Demographics of Chicago</span>

Chicago's demographics show that it is a large, and ethnically and culturally diverse metropolis. It is the third largest city and metropolitan area in the United States by population. Chicago was home to over 2.7 million people in 2020, accounting for over 25% of the population in the Chicago metropolitan area, home to approximately 9.6 million.

<span class="mw-page-title-main">Dominican Americans</span> Americans of Dominican (Dominican Republic) birth or descent

Dominican Americans are Americans who trace their ancestry to the Dominican Republic. The word may refer to someone born in the United States of Dominican descent or to someone who has migrated to the United States from the Dominican Republic. As of 2021, there were approximately 2.4 million people of Dominican descent in the United States, including both native and foreign-born. They are the second largest Hispanic group in the Northeastern region of the United States after Puerto Ricans, and the fifth-largest Hispanic/Latino group nationwide.

<span class="mw-page-title-main">Fairhill, Philadelphia</span> Neighborhood of Philadelphia in Pennsylvania, United States

Fairhill is a neighborhood on the east side of the North Philadelphia section of Philadelphia, Pennsylvania, United States. Fairhill is bordered by Front Street to the east, Germantown Avenue to the west, Allegheny Avenue to the north, and Cumberland Street to the south. The neighborhood serves as the center of the Hispanic community of Philadelphia, and is known for its "El Centro de Oro" commercial strip along North 5th Street. Fairhill is adjacent to Harrowgate and West Kensington to the east, Hartranft to the south, Glenwood to the west, and Hunting Park to the north.

<span class="mw-page-title-main">Stateside Puerto Ricans</span> Ethnic group and nationality and citizens of Puerto Rico in the US

Stateside Puerto Ricans, also ambiguously known as Puerto Rican Americans, or Puerto Ricans in the United States, are Puerto Ricans who are in the United States proper of the 50 states and the District of Columbia who were born in or trace any family ancestry to the unincorporated US territory of Puerto Rico.

<span class="mw-page-title-main">Demographics of New York (state)</span>

According to the U.S. Census Bureau, as of 2023, New York was the fourth largest state in population after California, Texas, and Florida, with a population of 19,571,216, a decrease of over 600,000 people, or −3.1%, since the 2020 census. The population change between 2000–2006 includes a natural increase of 601,779 people and a decrease due to net migration of 422,481 people out of the state. Immigration from outside the United States resulted in a net increase of 820,388 people, and migration within the country produced a net loss of about 800,213.

<span class="mw-page-title-main">West Indian Americans</span> Americans of West Indian (Caribbean) birth or descent

Caribbean Americans or West Indian Americans are Americans who trace their ancestry to the Caribbean. Caribbean Americans are a multi-ethnic and multi-racial group that trace their ancestry further in time mostly to Africa, as well as Asia, the Indigenous peoples of the Americas, and to Europe. As of 2016, about 13 million — about 4% of the total U.S. population — have Caribbean ancestry.

<span class="mw-page-title-main">New York City ethnic enclaves</span> Ethnic group in New York City

Since its founding in 1625 by Dutch traders as New Amsterdam, New York City has been a major destination for immigrants of many nationalities who have formed ethnic enclaves, neighborhoods dominated by one ethnicity. Freed African American slaves also moved to New York City in the Great Migration and the later Second Great Migration and formed ethnic enclaves. These neighborhoods are set apart from the main city by differences such as food, goods for sale, or even language. Ethnic enclaves provide inhabitants security in work and social opportunities, but limit economic opportunities, do not encourage the development of English speaking, and keep immigrants in their own culture.

Black Hispanic and Latino Americans, also called Afro-Hispanics, Afro-Latinos or Black Hispanics, or Black Latinos are classified by the United States Census Bureau, Office of Management and Budget, and other U.S. government agencies as Black people living in the United States with ancestry in Spain, Portugal or Latin America and/or who speak Spanish, and/or Portuguese as their first language.

The District of Columbia is a federal district with an ethnically diverse population. In 2020, the District had a population of 689,545 people, with a resident density of 11,515 people per square mile.

<span class="mw-page-title-main">Demographics of Hispanic and Latino Americans</span>

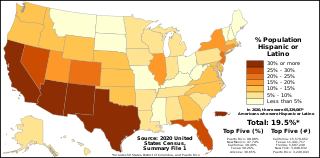
The demographics of Hispanic and Latino Americans depict a population that is the second-largest ethnic group in the United States, 62 million people or 18.7% of the national population.

Caribbean immigration to New York City has been prevalent since the late 19th and the early 20th centuries. This immigration wave has seen large numbers of people from Jamaica, Haiti, Cuba, Dominican Republic, Antigua and Barbuda, Guyana, and Trinidad and Tobago, among others, come to New York City in the 20th and 21st centuries. Caribbeans are concentrated in the Bronx, from 211th Street to 241st Street and Gun Hill Road. There are also Caribbean communities in Brooklyn, especially in the neighborhoods of Flatbush and Prospect Heights.

<span class="mw-page-title-main">Demographics of Cleveland</span>

The demographics of Cleveland have fluctuated throughout the city's history. From its founding in 1796, Cleveland's population grew to 261,353 by 1890, and to 796,841 by 1920, making it the fifth largest city in the United States at the time. By 1930, the population rose to 900,429 and, after World War II, it reached 914,808. Due to various historical factors including deindustrialization, suburbanization, and urban sprawl, Cleveland's population began decreasing in the 1960s. By 1970, the city's population was 750,903. By 1980, it was 573,822 and it had lost its position as one of the top 10 largest cities in the U.S. By 2020, the population had further fallen to 372,624. Beginning in 2018, the city's population began to flatten, after decades of decline. Additionally, between 2010 and 2020, several neighborhoods within Cleveland saw a significant population increase, most notably Downtown, but also University Circle and several West Side neighborhoods.

<span class="mw-page-title-main">Ethnic groups in Baltimore</span>

There have been a variety of ethnic groups in Baltimore, Maryland and its surrounding area for 12,000 years. Prior to European colonization, various Native American nations have lived in the Baltimore area for nearly 3 millennia, with the earliest known Native inhabitants dating to the 10th millennium BCE. Following Baltimore's foundation as a subdivision of the Province of Maryland by British colonial authorities in 1661, the city became home to numerous European settlers and immigrants and their African slaves. Since the first English settlers arrived, substantial immigration from all over Europe, the presence of a deeply rooted community of free black people that was the largest in the pre-Civil War United States, out-migration of African-Americans from the Deep South, out-migration of White Southerners from Appalachia, out-migration of Native Americans from the Southeast such as the Lumbee and the Cherokee, and new waves of more recent immigrants from Latin America, the Caribbean, Asia and Africa have added layers of complexity to the workforce and culture of Baltimore, as well as the religious and ethnic fabric of the city. Baltimore's culture has been described as "the blending of Southern culture and [African-American] migration, Northern industry, and the influx of European immigrants—first mixing at the port and its neighborhoods...Baltimore’s character, it’s uniqueness, the dialect, all of it, is a kind of amalgamation of these very different things coming together—with a little Appalachia thrown in...It’s all threaded through these neighborhoods", according to the American studies academic Mary Rizzo.

<span class="mw-page-title-main">Puerto Ricans in Philadelphia</span> Second largest Puerto Rican community outside of Puerto Rico

Philadelphia has the second largest Puerto Rican community outside of Puerto Rico after New York City. As of the 2010 U.S. Census, an estimated 121,643 Puerto Ricans were living in Philadelphia, up from 91,527 in 2000. Recent 2017 estimates by the U.S. Census Bureau put the number of Puerto Ricans living in Philadelphia at 134,934. In 2019, estimates put the number of Puerto Ricans at 146,153. Many Puerto Ricans in the Philadelphia area have engaged in circular migration in which they spend periods of time living in Philadelphia and periods of time living in Puerto Rico.

<span class="mw-page-title-main">History of Hispanics and Latinos in Baltimore</span>

The history of Hispanics and Latinos in Baltimore dates back to the mid-20th century. The Hispanic and Latino community of Baltimore is the fastest growing ethnic group in the city. There is a significant Hispanic/Latino presence in many Southeast Baltimore neighborhoods, particularly Highlandtown, Upper Fell's Point, and Greektown. Overall Baltimore has a small but growing Hispanic population, primarily in the Southeast portion of the area from Fells Point to Dundalk.

Hispanic and Latino Americans in San Francisco form 15.1% of the population. The city's population includes 121,744 Hispanics or Latinos of any race. The principal Hispanic groups in the city were those of Mexican (7.4%), Salvadoran (2.0%), Nicaraguan (0.9%), Guatemalan (0.8%), and Puerto Rican (0.5%) ancestry. The Hispanic population is most heavily concentrated in the Mission District, Tenderloin District, and Excelsior District.

The city of Baltimore, Maryland includes a large and growing Caribbean-American population. The Caribbean-American community is centered in West Baltimore. The largest non-Hispanic Caribbean populations in Baltimore are Jamaicans, Trinidadians and Tobagonians, and Haitians. Baltimore also has significant Hispanic populations from the Spanish West Indies, particularly Puerto Ricans, Dominicans, and Cubans. Northwest Baltimore is the center of the West Indian population of Baltimore, while Caribbean Hispanics in the city tend to live among other Latinos in neighborhoods such as Greektown, Upper Fell's Point, and Highlandtown. Jamaicans and Trinidadians are the first and second largest West Indian groups in the city, respectively. The neighborhoods of Park Heights and Pimlico in northwest Baltimore are home to large West Indian populations, particularly Jamaican-Americans.

<span class="mw-page-title-main">Dominicans in New York City</span> Ethnic group in New York City

The city of New York includes a sizeable Dominican population. Dominicans are one of the largest Latino groups in New York City followed by Puerto Ricans. Dominicans are the largest immigrant group in New York City. Dominicans are concentrated in Washington Heights and the Bronx in the city proper; by 2019, the share living in the city fell from 92% to 62%. The rest lived in outlying counties in the metro area. Census Bureau’s 2019 American Community Survey found that 702,000 Dominicans live in New York City.

As according to the New York City Department of City Planning, there were a total of 8,804,190 residents. There were almost equivalent populations of 2,719,856 White residents at 30.9% and 2,490,350 Hispanic residents at 28.3%, meanwhile there were 1,776,891 Black residents at 20.2% and 1,373,502 Asian residents at 15.6%. There were even much smaller numbers of 143,632 other race residents at 1.6% and 299,959 Two or More races residents at 3.4%. The White population declined mainly in Queens, The Bronx, and then Staten Island, though the White population increased marginally in Brooklyn and then Manhattan. The Black population experienced declines by Brooklyn, Queens, and Manhattan, increasing marginally in the Bronx and Staten Island. The Hispanic population increased in the Bronx, Queens, Brooklyn, and Staten Island, but experienced decline in Manhattan. The Asian population increased in all five boroughs.

References

Notes

  1. "Annual Estimates of the Resident Population: April 1, 2010 to July 1, 2014 - 2014 Population Estimates". United States Census Bureau. Archived from the original on March 31, 2015. Retrieved March 26, 2015.
  2. "Census" (PDF). United States Census. Archived from the original (PDF) on 2013-07-24. page 36
  3. Campbell Gibson. "Population of the 100 largest cities and other urban places in the United States: 1790 to 1990". United States Bureau of the Census.
  4. "Historical, demographic, economic, and social data: the United States, 1790–1970". Inter-university Consortium for Political and Social Research, Ann Arbor, Michigan.
  5. U.S. Census Bureau Delivers Pennsylvania's 2010 Census Population Totals, Including First Look at Race and Hispanic Origin Data for Legislative Redistricting Archived March 12, 2011, at the Wayback Machine
  6. "Philadelphia's population increased, but it's not all good, according to Census data". The Inquirer. March 22, 2018. Retrieved March 20, 2019.
  7. "Profile of General Population and Housing Characteristics: 2010 Demographic Profile Data - Philadelphia County, Pennsylvania". United States Census Bureau. Archived from the original on April 14, 2015. Retrieved April 13, 2015.
  8. "Census Bureau News". Archived from the original on 2006-03-03. Retrieved 2006-03-30. Archived copy at the Library of Congress (November 27, 2002).
  9. Cornfield, Josh (10 March 2011). "This is Not a Misprint: Philadelphia's Population is Up". Philadelphia Daily News . Retrieved 14 June 2012.
  10. Matza, Michael (2011-03-13). "Immigrant Surge: Why Area Grew". The Philadelphia Inquirer . Retrieved 2012-06-14.
  11. Cornfield, Josh (10 March 2011). "This is Not a Misprint: Philadelphia's Population is Up". Philadelphia Daily News . Retrieved 2012-06-14.
  12. Pressler, Jessica (August 14, 2005). "Philadelphia Story: The Next Borough". The New York Times . Retrieved May 1, 2010.
  13. Muhammad, Nisa Islam. "D.C. 'exodus' sparks district renewal efforts for Whites", The Final Call , June 21, 2007. Accessed June 25, 2007.
  14. "Washington's Black Majority Is Shrinking". The New York Times . September 16, 2007. Retrieved May 1, 2010.
  15. "IPUMS USA". usa.ipums.org. Retrieved 2022-02-25.
  16. Hepp, Chris (August 7, 2014). "Mummers Parade going south? City mulls big change". The Philadelphia Inquirer . Retrieved February 2, 2015.
  17. Trulia (15 March 2013). "America's Most Irish Towns". Forbes . Retrieved 7 February 2014.
  18. Potter (1960), p. 530
  19. Holmes, Kristin E. (2012-04-04). "An Armenian school in Philadelphia fights to survive". The Philadelphia Inquirer . Retrieved 2019-09-01. Many families began immigrating to the United States after the start of persecution in the 1890s, said [...] [this would refer to the Hamidian massacres
  20. "Home". Armenian Sisters Academy. Retrieved 2019-09-01. 440 Upper Gulph Road | Radnor, PA 19087
  21. "Township Zoning Map". Upper Merion Township, Pennsylvania . Retrieved 2019-09-01. - Also see: Township Street Map and Map of the Pennsylvania Department of Transportation
  22. "German Settlement in Pennsylvania An Overview" (PDF). Retrieved 29 January 2024.
  23. "Dutch (The) and the Netherlands".
  24. "France and the French".
  25. "Scots Irish (Scotch Irish)".
  26. "Slovaks and Slovakia".
  27. "Greeks and Greece (Modern)".
  28. "The health of the African and Caribbean immigrant community". 21 May 2013.
  29. Fast Facts About Africa and African Immigrants in Philadelphia (PDF) (Report). Balch Institute for Ethnic Studies. 2001. Archived (PDF) from the original on 2022-06-23.
  30. Garsd, Jasmine (25 May 2013). "'Las Caras Lindas': To be Black and Puerto Rican in 2013". NPR.
  31. "African Descendants in Puerto Rico (Afro-Puerto Ricans)".
  32. Hagerty, Barbara Bradley (2008-05-28). "Philly's Black Muslims Increasingly Turn to Polygamy". National Public Radio . Retrieved 2019-05-11.
  33. United States Census
  34. "American FactFinder". Factfinder.census.gov. Archived from the original on 2020-02-12. Retrieved 2012-08-26.
  35. 1 2 United States Census
  36. 1 2 "Violence Against African Immigrants in Philadelphia". FrontPageAfrica. 2005-11-14. Archived from the original on 2005-11-25. Retrieved 2018-01-04.
  37. Herold, Benjamin. "Student 'ambassadors' tackle divide between Africans, African Americans." The Notebook.[ clarification needed ] Northern hemisphere Fall 2008. Volume 16, No. 1. 1. Retrieved on December 16, 2010.
  38. Moran, Robert; Gaiutra Bahadur; Susan Snyder (2005-11-03). "Residents say beating fits widespread pattern". The Philadelphia Inquirer . Archived from the original on 2005-11-05. Retrieved 2018-01-06.
  39. "Philadelphia (Jamaica)". Archived from the original on 2012-09-02. Retrieved 2012-09-06.
  40. 1 2 3 4 Vázquez-Hernández, p. 88.
  41. Vázquez-Hernández, p. 89.
  42. Vázquez-Hernández, p. 88-89.
  43. 1 2 3 4 5 "American FactFinder - Results". Archived from the original on 2014-12-18. Retrieved 2016-05-07.
  44. 1 2 3 4 5 6 "Latino Philadelphia at a Glance." (Archive) Historical Society of Pennsylvania. p. 1. Retrieved on January 15, 2014.
  45. Casellas, Marisa (2007). "El Barrio: Latino Relationships in North Philadelphia and Impacts on Puerto Rican Businesses". Urban Studies Senior Seminar Papers. University of Pennsylvania, Urban Studies Program. Archived from the original on 2023-03-20.
  46. "21 Maps of Highly Segregated Cities in America". Business Insider .
  47. "American FactFinder - Results". Archived from the original on 2020-02-12. Retrieved 2015-04-16.
  48. 1 2 3 4 5 6 7 "Latino Philadelphia at a Glance." (Archive) Historical Society of Pennsylvania. p. 2. Retrieved on January 15, 2014.
  49. "Dominican businesses booming in Philadelphia". Archived from the original on 2016-04-04. Retrieved 2014-07-20.
  50. "Where Others Fled, Dominicans Settle in In N. Phila., Many Find Lucrative Haven". Archived from the original on 2016-04-04. Retrieved 2014-07-20.
  51. "American FactFinder - Results". Archived from the original on 2020-02-12. Retrieved 2015-05-17.
  52. "American FactFinder - Results". Archived from the original on 2020-02-14. Retrieved 2019-02-20.
  53. "Unos 65 mil dominicanos residen en la Ciudad de Filadelfia - noticias telemicro". ntelemicro.com. Archived from the original on 2018-12-04.
  54. 1 2 3 4 "From Puebla to South Philly." The Philadelphia Inquirer. October 28, 2011. Retrieved on January 15, 2014.
  55. 1 2 Nazir, Milady (2015-05-15). "Philadelphia's iconic Italian Market transformed by influx of Mexican migrants". Fox News Latino . Retrieved 2016-11-16.
  56. "Latino Philadelphia at a Glance." (Archive) Historical Society of Pennsylvania. p. 3. Retrieved on January 15, 2014.
  57. Teague, Matthew. "Heroes: South Philly High's Protesters." Philadelphia (magazine). August 2010. 1. Retrieved on January 31, 2013.
  58. "Bullying against Asian students roils Philadelphia high school." Associated Press at the USA Today . January 22, 2010. Retrieved on January 20, 2013. "Many of the city's nearly 60,000 residents who report being born in China live in the neighborhoods, said David Elesh, an urban sociologist at Temple University."
  59. "Pakistani Community". St. William Church. Retrieved 2021-04-07.
  60. Kerkstra, Patrick (1999-11-09). "Just like home for Japanese students". The Philadelphia Inquirer . pp. B1, B5. - Clipping of first and of second page at Newspapers.com.
  61. "Directions Archived 2015-04-02 at the Wayback Machine ." Japanese Language School of Philadelphia. Retrieved on March 30, 2014.
  62. "The Melting Pot." Fadiman, Anne. The Spirit Catches You and You Fall Down. The Noonday Press, 1997. ISBN   0-374-52564-1, ISBN   978-0-374-52564-4. p. 192. "In Philadelphia, anti-Hmong muggings, robberies, beatings, stonings, and vandalism were so commonplace during the early eighties that the city's Commission on Human Relations held public hearings to investigate the violence. One source[...]"
  63. 1 2 3 Robbins, William. "VIOLENCE FORCES HMONG TO LEAVE PHILADELPHIA" (Archive). The New York Times . Monday September 17, 1984. Late City Final Edition, Section B, Page 16, Column 2, 1100 words
  64. "The Melting Pot." Fadiman, Anne. The Spirit Catches You and You Fall Down . The Noonday Press, 1997. ISBN   0-374-52564-1, ISBN   978-0-374-52564-4. p. 195.
  65. "Indigenous Peoples of Philadelphia". ALA. 2 December 2019. Retrieved 12 February 2024.
  66. Silverman, Carol (14 February 2012). Romani Routes: Cultural Politics and Balkan Music in Diaspora. Oxford University Press. ISBN   978-0-19-991022-9 . Retrieved 12 February 2024 via Google Books.
  67. 1 2 Major U.S. metropolitan areas differ in their religious profiles, Pew Research Center
  68. Philadelphia". Jewish Virtual Library
  69. "Philly's Black Muslims Increasingly Turn to Polygamy". NPR.org.
  70. "Archived copy". Archived from the original on 2016-04-24. Retrieved 2014-10-11.{{cite web}}: CS1 maint: archived copy as title (link)
  71. "The Jivaka Project" . Retrieved 2019-01-10.
  72. Levitt, Ross (2009-12-30). "Group: Remains of more than 500 animals found at Philadelphia home". CNN.com. Retrieved 2022-06-10.
  73. "Man gets life sentence in killing over Santeria". 15 January 2012.
  74. "Voodoo: A Growing Presence in Philadelphia". Archived from the original on 2016-03-04. Retrieved 2014-10-11.
  75. "Explore Census Data". data.census.gov. Retrieved 29 January 2024.

Sources and further reading