Economy of Nepal

Last updated

Economy of Nepal
Kathmandu City on lockdown.jpg
Currency Nepalese rupee (NPR, रू)
16 July - 15 July
Trade organizations
WTO, SCO and SAFTA
Country group
Statistics
PopulationIncrease2.svg 29,164,578 (2021) [3]
GDP
  • Increase2.svg $46.097 billion (nominal, 2023 est) [4]
  • Increase2.svg $163.82 billion (PPP, 2023 est) [4]
GDP growth
  • Increase2.svg4.2% (FY2020-21)
  • Increase2.svg5.8% (FY2021-22)
  • Increase2.svg4.4% (FY2022-23) [5]
GDP per capita
  • Increase2.svg $1,789 (nominal, 2023 est.) [4]
  • Increase2.svg $5,321 (PPP, 2023 est.) [4]
GDP by sector
7.76%(April 2023) [4]
Population below poverty line
32.8 medium (2010) [9]
Labour force
  • Decrease2.svg 16,016,973 (2020) [12]
  • semi skilled labor [6]
  • 76.2% employment rate (2020) [13]
Labour force by occupation
  • agriculture: 43.1%
  • industry: 21.24%
  • services: 35.66%
  • (2020) [6]
Unemployment11.47% (2021) [6]
Main industries
tourism, carpets, textiles; small rice, jute, sugar, and oilseed mills; cigarettes, cement and brick production [6]
External
ExportsIncrease2.svg $2.69 billion (2021) [6]
Export goods
clothing, pulses, carpets, textiles, juice, jute goods [6]
Main export partners
ImportsIncrease Negative.svg $15.17 billion (2021) [6]
Import goods
petroleum products, machinery and equipment, gold, electrical goods, medicine [6]
Main import partners
  • Flag of India.svg  India(+) 68.03%(2021est.)
  • Flag of the People's Republic of China.svg  China(-) 31.97%(2021est.)
  • (2017) [6]
FDI stock
  • $20 billion (31 July 2013 est.) [6]
  • Abroad: NA [6]
Increase Negative.svg $11 billion (31 December 2020) [6]
Public finances
Increase Negative.svg 41.38% of GDP (2021/22) [14]
−1% (of GDP) (2022 est.) [6]
Revenues10.925 billion (2017 est.) [6]
Expenses15.945 billion (2017 est.) [6]
Increase2.svg $13.69 billion (Jan 2024) [15]
Main data source: CIA World Fact Book
All values, unless otherwise stated, are in US dollars.

The economy of Nepal is developing category and largely dependent on agriculture and remittances. [6] Until the mid-20th century Nepal was an isolated pre-industrial society, which entered the modern era in 1951 without schools, hospitals, roads, telecommunications, electric power, industry, or civil service. The country has, however, made progress toward sustainable economic growth since the 1950s. The country was opened to economic liberalization, leading to economic growth and improvement in living standards when compared to the past. The biggest challenges faced by the country in achieving higher economic development are the frequent changes in political leadership, as well as corruption.

Contents

Nepal has consistently been ranked as one of the poorest countries in the world. [16] [17] [18]

Nepal has used a series of five-year plans in an attempt to make progress in economic development. It completed its ninth economic development plan in 2002; its currency has been made convertible, and 17 state enterprises have been privatised. Foreign aid to Nepal accounts for more than half of the development budget. Government priorities over the years have been result in the development of transportation and communication facilities, agriculture, and industry. Since 1975, improved government administration and rural development efforts have been emphasised.

Agriculture remains Nepal's principal economic activity, employing about 65% of the population and providing 31.7% of GDP. Only about 20% of the total area is cultivable; another 40.7% is forested (i.e., covered by shrubs, pastureland and forest); most of the rest is mountainous. Fruits and vegetables (apples, pears, tomatoes, various salad greens, peach, nectarine, potatoes), as well as rice and wheat are the main food crops. The lowland Terai region produces an agricultural surplus, part of which supplies the food-deficient hill areas.

GDP is heavily dependent on remittances (9.1%) of foreign workers. Subsequently, economic development in social services and infrastructure in Nepal has not made dramatic progress. A countrywide primary education system is under development, and Tribhuvan University has several campuses. Although eradication efforts continue, malaria had been controlled in the fertile but previously uninhabitable Terai region in the south. Kathmandu is linked to India and nearby hill regions by road and an expanding highway network. The capital was almost out of fuel and supplies, due to a crippling general strike in southern Nepal on 17 February 2008. [19]

Major towns are connected to the capital by telephone and domestic air services. The export-oriented carpet and garment industries have grown rapidly in recent years. Together, they account for approximately 70% of the country's merchandise exports.

The Cost of Living Index in Nepal is comparatively lower than many countries but not the least. The quality of life has declined to a much less desirous value in recent years. [20] In the 2021 Global Hunger Index, Nepal ranks 76th out of the 116 countries with sufficient data to calculate 2021 GHI scores. With a score of 19.1, Nepal has a level of hunger that is moderate. [21] Nepal has the worst road infrastructure in Asia. [22]

Foreign investments and taxation

Huge numbers of Small Foreign Investments come to Nepal via the Non Resident Nepali, who are investing in many sectors. Nepal has a huge potential for hydroelectricity. Accordingly, a large number of foreign companies are willing to invest in Nepal, but political instability has stopped the process. Nepal has entered into agreements for avoidance of double taxation (all in credit method) with 10 countries (PSRD) since 2000. Similarly, it has Investment protection agreements with 5 countries (PSRD) since 1983. In 2014, Nepal restricted the Foreign aid by setting a minimum limit for foreign grants, soft and commercial loans from its development partners. [23]

Imports and exports

Nepal's merchandise trade balance has improved somewhat since 2000 with the growth of the carpet and garment industries. In the fiscal year 2000–2001, exports posted a greater increase (14%) than imports (4.5%), helping bring the trade deficit down by 4% from the previous year to $749 million. Recently, the European Union has become the largest buyer of ready-made garments; fruits and vegetables (mostly apples, pears, tomatoes, various salads, peach, nectarine, potatoes, rice) from Nepal. Exports to the EU accounted for 46.13 percent of the country's garment exports. [24]

The annual monsoon rain strongly influences economic growth. From 1996 to 1999, real GDP growth averaged less than 4%. The growth rate recovered in 1999, rising to 6% before slipping slightly in 2001 to 5.5%.

Strong export performance, including earnings from tourism, and external aid have helped improve the overall balance of payments and increase international reserves. Nepal receives substantial amounts of external assistance from the United Kingdom, [25] [26] [27] the United States, Japan, Germany, and the Nordic countries.

Several multilateral organisations such as the World Bank, the Asian Development Bank, and the UN Development Programme also provide assistance. In June 1998, Nepal submitted its memorandum on a foreign trade regime to the World Trade Organization and in May 2000 began direct negotiations on its accession.

Resources

Tourists trekking in Annapurna region in western Nepal. Tourism plays a vital role in Nepal's economy. Tourists trekking in Annapurna region.jpg
Tourists trekking in Annapurna region in western Nepal. Tourism plays a vital role in Nepal's economy.

Progress has been made in exploiting Nepal's natural resources, tourism, and hydroelectricity. With eight of the world's 10 highest mountain peaks, including Mount Everest at 8,848.86 m. In the early 1990s, one large public sector project and a number of private projects were planned; some have been completed. The most significant private sector financed hydroelectric projects currently in operation are the Khimti Khola (60 MW) and the Bhote Koshi Project (36 MW). The project is still undergoing and has dependency on China, India and Japan to take the further steps.

Upper Tamakoshi hydropower, biggest hydropower in Nepal. maathillo taamaakoshii nirmaannsthl.png
Upper Tamakoshi hydropower, biggest hydropower in Nepal.
Kulekhani dam also known as "Indra sarobar"or "Kulekhani Reservoir" combinely producing 106 MW, in Makwanpur, Nepal Kulekhani dam8.jpg
Kulekhani dam also known as "Indra sarobar"or "Kulekhani Reservoir" combinely producing 106 MW, in Makwanpur, Nepal
Middle Marsyangdi Hydropower Station, producing 70 MW. Nepal has significant potential to generate hydropower, which it plans to export across South Asia. Kaligandaki A HPS Tailrace Channel.jpg
Middle Marsyangdi Hydropower Station, producing 70 MW. Nepal has significant potential to generate hydropower, which it plans to export across South Asia.

Nepal has 83,000 MW of theoretical and 42,133 MW of technically/financially viable hydroelectric potential, however the total installed capacity, at present, is 2500 MW and increasing. [28]

The environmental impact of Nepal's hydroelectric Own calendar (Bikram Sambat) New year in mid- April projects has been limited by the fact that most are "run-of-the-river" with only one storage project undertaken to date. The largest hydroelectric plant under consideration is the West Seti Dam (750 MW) storage project dedicated to exports to be built by the private sector. Negotiations with India for a power purchase agreement have been underway for several years, but agreement on pricing and financing remains a problem. Currently demand for electricity is increasing at 8-10% a year whereas Nepal's option to have agreement with India will make this fulfilment against demand. As of June 2022 surplus electricity up to 364 MWp by Nepal is exported to India. [29]

Population pressure on natural resources is increasing. Over-population is already straining the "carrying capacity" of the middle hill areas, particularly the Kathmandu Valley, resulting in the depletion of forest cover for crops, fuel, and fodder and contributing to erosion and flooding. Although steep mountain terrain makes exploitation difficult, mineral surveys have found small deposits of limestone, magnesite, zinc, copper, iron, mica, lead, and cobalt. Coal mining is also done with 11522 tones produced in 2018 alone.

The development of hydroelectric power projects also cause some tension with local indigenous groups, recently[ when? ] empowered by Nepal's ratification of ILO Convention 169. [30]

Macro-economic trend

This is a chart of trend of gross domestic product of Nepal at market prices estimated by the International Monetary Fund and EconStats with figures in millions of Nepali Rupees.[ citation needed ]

YearGross domestic product
19603,870
19655,602
19708,768
197516,571
198023,350
198546,586
1990103,415
1995219,174
2000379,488

The following table shows the main economic indicators in 1980–2018. [31]

YearGDP (in bil. US$ PPP)GDP per capita (in US$ PPP)GDP (in bil. US$ nominal)GDP growth (real)Inflation (in Percent)Government debt (in % of GDP)
19806.04042.3−2.3 %9.8 %...
19859.95903.26.1 %4.1 %...
199014.47674.414.4 %8.9 %...
199520.99775.43.5 %7.7 %...
200028.81,2116.56.1 %3.4 %58 %
200538.51,5009.33.5 %4.5 %51 %
200641.01,57910.33.4 %8.0 %49 %
200743.51,65911.83.4 %6.2 %43 %
200847.11,77714.36.1 %6.7 %42 %
200949.61,85314.74.5 %12.6 %39 %
201052.61,94618.34.8 %9.6 %34 %
201155.52,03121.73.4 %9.6 %32 %
201259.22,14221.74.8 %8.3 %34 %
201362.72,23922.24.1 %9.9 %32 %
201467.62,38722.76.0 %9.0 %28 %
201570.62,46424.43.3 %7.2 %25 %
201671.82,47724.50.6 %9.9 %27 %
201778.62,67929.08.2 %4.5 %27.4 %

Statistics

GDP: purchasing power parity - $84.37 Billion (2018 est.) [32] [ dubious ]

GDP - real growth rate: 21.77% (2017)

GDP - per capita: purchasing power parity (current international $) - $2700 (2017 est.) GDP - composition by sector:
agriculture: 17%
industry: 13.5%
services: 60.5% (2017 est.)
tourism: 9%

Population below poverty line: 25.6% (2017/2018) [33]

Household income or consumption by percentage share:
lowest 10%: 3.2%
highest 10%: 29.8% (1995–96)

Inflation rate (consumer prices): 4.5% (2017)

Labour force: 4 million (2016 est.) [ citation needed ]

Labor force - by occupation: agriculture 19%, services 69%, industry 12% (2014 est.)

Unemployment rate: 1.47% (2017 est.)

Budget:
revenues: $5.954 billion
expenditures: $5.974 billion, including capital expenditures of $NA (2017 est.)

Industries: tourism, carpet, textile; small rice, jute, sugar, and oilseed mills; cigarette; cement and brick production

Industrial production growth rate: 10.9% (2017 est.):

Electricity - production: 41,083 GWh (2017)

Electricity - production by source:
fossil fuel: 7.5%
hydro: 91.5%
nuclear: 0.3%
other: 0.7% (2001)

Available energy:6957.73 GWh (2017) NEA Hydro:2290.78 GWh (2014) NEA Thermal:9.56 GWh (2014) purchase (total):2331.17 GWh (2014) India (purchase):2175.04 GWh (2017) Nepal (IPP):1258.94 GWh (2014)

Electricity - consumption: 4,776.53 GWh (2017)

Electricity - exports: 856 GWh (2001) Electricity - imports: 12 GWh (2001)

Oil - production:0 barrels per day (0 m3/d) (2001 est.)

Oil - consumption:1,600 barrels per day (250 m3/d) 2001

Agriculture - products: Fruits and vegetables, mostly: apples, pears, tomatoes, peaches, nectarines, potatoes, rice, maize, wheat, sugarcane, root crops, milk, and buffalo meat.

Exports: $1.29 billion f.o.b., but does not include unrecorded border trade with India (2020 est.)

Exports - commodities: carpets, clothing, leather goods, jute goods, grain

Exports - partners: India 56.6%, US 11.5%, Turkey 9.2% (2016 est.)

Imports: $1.6 billion f.o.b. (2021 est.)

Imports - commodities: gold, machinery and equipment, petroleum products, electrical goods, medicine

Imports - partners: India 70.1%, China 10.3%, UAE 2.6%, Singapore 2.1%, Saudi Arabia 1.2%. (2016 est.)

Debt - external: $9.1 billion (2022 est.)

Economic aid - recipient: $2 billion (FY 2019/20)

Currency: 1 Nepali rupee (NPR) = 100 paisa

Fiscal year: 16 July - 15 July

See also

Related Research Articles

<span class="mw-page-title-main">Economy of Chad</span>

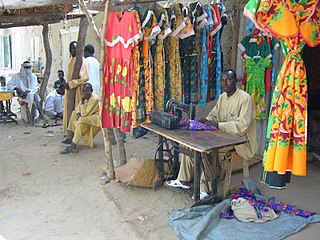
The economy of Chad suffers from the landlocked country's geographic remoteness, drought, lack of infrastructure, and political turmoil. About 85% of the population depends on agriculture, including the herding of livestock. Of Africa's Francophone countries, Chad benefited least from the 50% devaluation of their currencies in January 1994. Financial aid from the World Bank, the African Development Bank, and other sources is directed largely at the improvement of agriculture, especially livestock production. Because of lack of financing, the development of oil fields near Doba, originally due to finish in 2000, was delayed until 2003. It was finally developed and is now operated by ExxonMobil. In terms of gross domestic product, Chad ranks 147th globally with $11.051 billion as of 2018.

<span class="mw-page-title-main">Economy of Gabon</span>

The economy of Gabon is characterized by strong links with France, large foreign investments, dependence on skilled foreign labor, and decline of agriculture. Gabon on paper enjoys a per capita income four times that of most nations of Africa, but its reliance on resource extraction industry fail to release much of the population from extreme poverty, as much of 30% of the population lives under the poverty threshold.

<span class="mw-page-title-main">Economy of Grenada</span>

The economy of Grenada is largely tourism-based, small, and open economy. Over the past two decades, the main thrust of Grenada's economy has shifted from agriculture to services, with tourism serving as the leading foreign currency earning sector. The country's principal export crops are the spices nutmeg and mace. Other crops for export include cocoa, citrus fruits, bananas, cloves, and cinnamon. Manufacturing industries in Grenada operate mostly on a small scale, including production of beverages and other foodstuffs, textiles, and the assembly of electronic components for export.

<span class="mw-page-title-main">Economy of Kyrgyzstan</span>

The economy of Kyrgyzstan is heavily dependent on the agricultural sector. Cotton, tobacco, wool, and meat are the main agricultural products, although only tobacco and cotton are exported in any quantity. According to Healy Consultants, Kyrgyzstan's economy relies heavily on the strength of industrial exports, with plentiful reserves of gold, mercury and uranium. The economy also relies heavily on remittances from foreign workers. Following independence, Kyrgyzstan was progressive in carrying out market reforms, such as an improved regulatory system and land reform. In 1998, Kyrgyzstan was the first Commonwealth of Independent States (CIS) country to be accepted into the World Trade Organization. Much of the government's stock in enterprises has been sold. Kyrgyzstan's economic performance has been hindered by widespread corruption, low foreign investment and general regional instability. Despite those issues, Kyrgyzstan is ranked 70th on the ease of doing business index.

<span class="mw-page-title-main">Economy of Malawi</span>

The economy of Malawi is $7.522 billion by gross domestic product as of 2019, and is predominantly agricultural, with about 80% of the population living in rural areas. The landlocked country in south central Africa ranks among the world's least developed countries. In 2017, agriculture accounted for about one-third of GDP and about 80% of export revenue. The economy depends on substantial inflows of economic assistance from the IMF, the World Bank, and individual donor nations. The government faces strong challenges: to spur exports, to improve educational and health facilities, to face up to environmental problems of deforestation and erosion, and to deal with the problem of HIV/AIDS in Africa. Malawi is a least developed country according to United Nations.

<span class="mw-page-title-main">Economy of Mongolia</span>

The economy of Mongolia has traditionally been based on agriculture and livestock. Mongolia also has extensive mineral deposits: copper, coal, molybdenum, tin, tungsten, and gold account for a large part of industrial production. Soviet assistance, at its height one-third of Gross domestic product (GDP), disappeared almost overnight in 1990–91, in the time of the collapse of the Soviet Union. Mongolia was driven into deep recession.

<span class="mw-page-title-main">Economy of Niger</span>

The gross domestic product (GDP) of Niger was $16.617 billion US dollars in 2023, according to official data from the World Bank. This data is based largely on internal markets, subsistence agriculture, and the export of raw commodities: foodstuffs to neighbors and raw minerals to world markets. Niger, a landlocked West African nation that straddles the Sahel, has consistently been ranked on the bottom of the Human Development Index, at 0.394 as of 2019. It has a very low per capita income, and ranks among the least developed and most heavily indebted countries in the world, despite having large raw commodities and a relatively stable government and society not currently affected by civil war or terrorism. Economic activity centers on subsistence agriculture, animal husbandry, re-export trade, and export of uranium.

<span class="mw-page-title-main">Economy of Paraguay</span>

The economy of Paraguay is a market economy that is highly dependent on agriculture products. In recent years, Paraguay's economy has grown as a result of increased agricultural exports, especially soybeans. Paraguay has the economic advantages of a young population and vast hydroelectric power. Its disadvantages include the few available mineral resources, and political instability. The government welcomes foreign investment.

<span class="mw-page-title-main">Economy of the Republic of the Congo</span>

The economy of the Republic of the Congo is a mixture of subsistence hunting and agriculture, an industrial sector based largely on petroleum extraction and support services. Government spending is characterized by budget problems and overstaffing. Petroleum has supplanted forestry as the mainstay of the economy, providing a major share of government revenues and exports. Nowadays the Republic of the Congo is increasingly converting natural gas to electricity rather than burning it, greatly improving energy prospects.

<span class="mw-page-title-main">Economy of Saint Lucia</span>

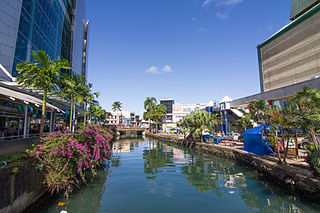
Once a single-crop agricultural economy, Saint Lucia has shifted to a tourism and banking serviced-based economy. Tourism, the island's biggest industry and main source of jobs, income and foreign exchange, accounts for 65% of its GDP. Agriculture, which was once the biggest industry, now contributes to less than 3% of GDP, but still accounts for 20% of jobs. The banana industry is now on a decline due to strong competition from low-cost Latin American producers and reduced European trade preferences, but the government has helped revitalize the industry, with 13,734 tonnes exported in 2018. Agricultural crops grown for export are bananas, mangoes, and avocados. The island is considered to have the most diverse and well-developed manufacturing industry in the eastern Caribbean.

<span class="mw-page-title-main">Economy of Senegal</span>

The economy of Senegal is driven by mining, construction, tourism, fishing and agriculture, which are the main sources of employment in rural areas, despite abundant natural resources in iron, zircon, gas, gold, phosphates, and numerous oil discoveries recently. Senegal's economy gains most of its foreign exchange from fish, phosphates, groundnuts, tourism, and services. As one of the dominant parts of the economy, the agricultural sector of Senegal is highly vulnerable to environmental conditions, such as variations in rainfall and climate change, and changes in world commodity prices.

<span class="mw-page-title-main">Economy of Sierra Leone</span>

The economy of Sierra Leone is $4.082 billion by gross domestic product as of 2018. Since the end of the Sierra Leone Civil War in 2002, the economy is gradually recovering with a gross domestic product growth rate between 4 and 7%. In 2008 it in PPP ranked between 147th by World Bank, and 153rd by CIA, largest in the world.

<span class="mw-page-title-main">Economy of Tanzania</span>

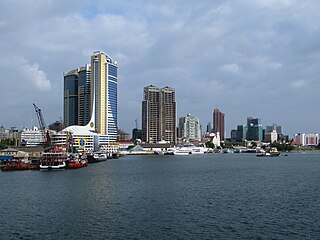
The economy of Tanzania is a lower-middle income economy that is overwhelmingly dependent on agriculture. Tanzania's economy has been transitioning from a planned economy to a market economy since 1985. Although total GDP has increased since these reforms began, GDP per capita dropped sharply at first, and only exceeded the pre-transition figure in around 2007.

<span class="mw-page-title-main">Economy of Vanuatu</span>

Vanuatu's economy is primarily agricultural; 80% of the population is engaged in agricultural activities that range from subsistence farming to smallholder farming of coconuts and other cash crops.

<span class="mw-page-title-main">Economy of Fiji</span>

The economy of Fiji is one of the most developed among the Pacific islands. Nevertheless, Fiji is a developing country endowed with forest, mineral and fish resources. The country has a large agriculture sector heavily based on subsistence agriculture. Sugar exports and the tourism industry are the main sources of foreign exchange. There are also light manufacturing and mining sectors.

A per capita GDP of $3,200 ranks Solomon Islands as a lesser developed nation. Over 75% of its labour force is engaged in subsistence farming and fishing.

<span class="mw-page-title-main">Economy of Mozambique</span>

The economy of Mozambique is $14.396 billion by gross domestic product as of 2018, and has developed since the end of the Mozambican Civil War (1977–1992). In 1987, the government embarked on a series of macroeconomic reforms, which were designed to stabilize the economy. These steps, combined with donor assistance and with political stability since the multi-party elections in 1994, have led to dramatic improvements in the country's growth rate. Inflation was brought to single digits during the late 1990s, although it returned to double digits in 2000–02. Fiscal reforms, including the introduction of a value-added tax and reform of the customs service, have improved the government's revenue collection abilities.

<span class="mw-page-title-main">Economy of Papua New Guinea</span>

The economy of Papua New Guinea (PNG) is largely underdeveloped with the vast majority of the population living below the poverty line. However, according to the Asian Development Bank its GDP is expected to grow 3.4% in 2022 and 4.6% in 2023. It is dominated by the agricultural, forestry, and fishing sector and the minerals and energy extraction sector. The agricultural, forestry, and fishing sector accounts for most of the labour force of PNG while the minerals and energy extraction sector, including gold, copper, oil and natural gas is responsible for most of the export earnings.

<span class="mw-page-title-main">Economy of the Gambia</span>

The economy of the Gambia is heavily reliant on agriculture. The Gambia has no significant mineral or other natural resources, and has a limited agricultural base. About 75% of the population depends on crops and livestock for its livelihood. Small-scale manufacturing activity features the processing of peanuts, fish, and animal hides.

<span class="mw-page-title-main">Economy of Ivory Coast</span>

The economy of Ivory Coast is stable and currently growing, in the aftermath of political instability in recent decades. The Ivory Coast's economy is largely market-based and depends heavily on the agricultural sector. Almost 70% of the Ivorian people are engaged in some form of agricultural activity. GDP per capitaArchived 4 May 2012 at the Wayback Machine grew 82% in the 1960s, reaching a peak growth of 360% in the 1970s, but this proved unsustainable and it shrank by 28% in the 1980s and a further 22% in the 1990s. This decline, coupled with high population growth, resulted in a steady fall in living standards. The Gross national product per capita, now rising again, was about US$727 in 1996. It was substantially higher two decades before.

References

  1. "World Economic Outlook Database, April 2019". IMF.org. International Monetary Fund . Retrieved 29 September 2019.
  2. "World Bank Country and Lending Groups". datahelpdesk.worldbank.org. World Bank . Retrieved 1 July 2020.
  3. "Population, total - Nepal". Central_Bureau_of_Statistics_(Nepal). 24 March 2023. Retrieved 29 March 2023.
  4. 1 2 3 4 5 "World Economic Outlook Database, April 2021". IMF.org. International Monetary Fund . Retrieved 10 April 2021.
  5. "International Monetary Fund". www.img.org. International Monetary Fund . Retrieved 22 May 2023.
  6. 1 2 3 4 5 6 7 8 9 10 11 12 13 14 15 16 17 18 "The World Factbook". CIA.gov. Central Intelligence Agency . Retrieved 1 November 2020.
  7. "Poverty headcount ratio at national poverty lines (% of population) - Nepal". xinhuanet.net. Xinhuanet. Retrieved 18 January 2020.
  8. "Poverty headcount ratio at $3.20 a day (2011 PPP) (% of population) - Nepal". data.worldbank.org. World Bank. Retrieved 1 July 2020.
  9. "GINI index (World Bank estimate)". data.worldbank.org. World Bank . Retrieved 25 January 2019.
  10. "Human Development Index (HDI)". hdr.undp.org. HDRO (Human Development Report Office) United Nations Development Programme . Retrieved 11 December 2019.
  11. "Inequality-adjusted HDI (IHDI)". hdr.undp.org. UNDP . Retrieved 22 May 2020.
  12. "Labor force, total". World Bank. Retrieved 2 November 2019.
  13. "Employment to population ratio, 15+, total (%) (national estimate)". World Bank. Retrieved 14 September 2019.
  14. "Nepal's Debt" . Retrieved 1 January 2023.
  15. "Nepal's Forex Reserves" . Retrieved 12 January 2024.
  16. "Climbing Higher: Toward a Middle-Income Nepal".
  17. "10 Causes of Poverty in Nepal - Friends of WPC Nepal". 29 May 2020.
  18. "Poverty in Nepal, Hunger and food shortages, INF".
  19. Kathmandu nearly out of fuel, Nepal says. CNN. 17 February 2008. Retrieved 2008-04-13.
  20. Cost of Living Index in Nepal - Statistics & Graphs of Nepalese Citizen's Economic Power. Retrieved 10 January 2014.
  21. "Nepal". Global Hunger Index (GHI) - peer-reviewed annual publication designed to comprehensively measure and track hunger at the global, regional, and country levels. Retrieved 27 May 2022.
  22. "Best and worst Asian countries for road quality". 22 February 2018.
  23. "Nepal puts a minimum amount limit on foreign aid and loans". IANS. news.biharprabha.com. Retrieved 3 July 2014.
  24. "EU as Nepal's largest exporter". ktm2day. 11 October 2011. Retrieved 11 October 2011.
  25. "UK should cut aid to Nepal if "endemic" corruption persists: report". Reuters. 27 March 2015. Retrieved 16 May 2015.
  26. "DFID's bilateral programme in Nepal". The International Development Committee of the House of Commons. 27 March 2015. Retrieved 17 May 2015.
  27. "A Conversation with Departing Nepal Chief of the UK Aid Agency". United We Blog! for a Democratic Nepal. 15 June 2013. Retrieved 16 May 2015.
  28. "Nepal's Electricity".
  29. "Nepal starts exporting surplus electricity to India". english.onlinekhabar.com. 2 June 2022. Retrieved 13 June 2022.
  30. Jones, Peris: When the lights go out. Hydroelectric power and indigenous rights in Nepal Archived 30 April 2011 at the Wayback Machine . NIBR International Blog 11.03.10
  31. "Report for Selected Countries and Subjects" . Retrieved 30 August 2018.
  32. "Nepal Economy Profile 2019". www.indexmundi.com.
  33. https://mof.gov.np/uploads/document/file/for%20web_Economic%20Survey%202075%20Full%20Final%20for%20WEB%20_20180914091500.pdf [ bare URL PDF ]

PD-icon.svg This article incorporates public domain material from The World Factbook (2024 ed.). CIA.  (Archived 2003 edition)