Hydrograph

Last updated
A stream hydrograph. Increases in stream flow follow rainfall or snowmelt. The gradual decay in flow after the peaks reflects diminishing supply from groundwater. Stream hydrograph.gif
A stream hydrograph. Increases in stream flow follow rainfall or snowmelt. The gradual decay in flow after the peaks reflects diminishing supply from groundwater.

A hydrograph is a graph showing the rate of flow (discharge) versus time past a specific point in a river, channel, or conduit carrying flow. The rate of flow is typically expressed in cubic meters or cubic feet per second (cms or cfs). Hydrographs often relate changes of precipitation to changes in discharge over time. [1] It can also refer to a graph showing the volume of water reaching a particular outfall, or location in a sewerage network. Graphs are commonly used in the design of sewerage, more specifically, the design of surface water sewerage systems and combined sewers.

Contents

Terminology

Source: [2]

Discharge
the rate of flow (volume per unit time) passing a specific location in a river, or other channel. The discharge is measured at a specific point in a river and is typically time variant.
Approach Segment
the river flow before the storm (antecedent flow).
Rising limb
The rising limb of the hydrograph, also known as concentration curve, reflects a prolonged increase in discharge from a catchment area, typically in response to a rainfall event.
Peak discharge
the highest point on the hydrograph when the rate of discharge is greatest.
Recession (or falling) limb
The recession limb extends from the peak flow rate onward. The end of stormflow (a.k.a. quickflow or direct runoff) and the return to groundwater-derived flow (base flow) is often taken as the point of inflection of the recession limb. The recession limb represents the withdrawal of water from the storage built up in the basin during the earlier phases of the hydrograph.
Lag-1
autocorrelation method to compare streamflow data to itself by shifting or "lagging" initial discharge dataset 1 time unit. A Lag-10 would mean the initial data is shifted 10 days, then is compared to an unshifted version of the data. Not to be confused with lag time.
Lag time
the time interval from the maximum rainfall to the peak discharge.
Time to peak
time interval from the start of rainfall to the peak discharge.
Time of concentration
Time of concentration is the time from the end of the precipitation period to the end of the quick–response runoff in the hydrograph. [3]


Types of hydrographs include: [4]

Baseflow separation

A stream hydrograph is commonly determining the influence of different hydrologic processes on discharge from the subject catchment. Because the timing, magnitude, and duration of groundwater return flow differs so greatly from that of direct runoff, separating and understanding the influence of these distinct processes is key to analyzing and simulating the likely hydrologic effects of various land use, water use, weather, and climate conditions and changes.

However, the process of separating “baseflow” from “direct runoff” is an inexact science. In part this is because these two concepts are not, themselves, entirely distinct and unrelated. Return flow from groundwater increases along with overland flow from saturated or impermeable areas during and after a storm event; moreover, a particular water molecule can easily move through both pathways en route to the watershed outlet. Therefore, separation of a purely “baseflow component” in a hydrograph is a somewhat arbitrary exercise. Nevertheless, various graphical and empirical techniques have been developed to perform these hydrograph separations. The separation of base flow from direct runoff can be an important first step in developing rainfall-runoff models for a watershed of interest—for example, in developing and applying unit hydrographs as described below.

Unit hydrograph

Hidrograma.png

A unit hydrograph (UH) is the hypothetical unit response of a watershed (in terms of runoff volume and timing) to a unit input of rainfall. It can be defined as the direct runoff hydrograph (DRH) resulting from one unit (e.g., one cm or one inch) of effective rainfall occurring uniformly over that watershed at a uniform rate over a unit period of time. As a UH is applicable only to the direct runoff component of a hydrograph (i.e., surface runoff), a separate determination of the baseflow component is required.

A UH is specific to a particular watershed, and specific to a particular length of time corresponding to the duration of the effective rainfall. That is, the UH is specified as being the 1-hour, 6-hour, or 24-hour UH, or any other length of time up to the time of concentration of direct runoff at the watershed outlet. Thus, for a given watershed, there can be many unit hydrographs, each one corresponding to a different duration of effective rainfall.

The UH technique provides a practical and relatively easy-to-apply tool for quantifying the effect of a unit of rainfall on the corresponding runoff from a particular drainage basin. [5] UH theory assumes that a watershed's runoff response is linear and time-invariant, and that the effective rainfall occurs uniformly over the watershed. In the real world, none of these assumptions are strictly true. Nevertheless, application of UH methods typically yields a reasonable approximation of the flood response of natural watersheds. The linear assumptions underlying UH theory allows for the variation in storm intensity over time (i.e., the storm hyetograph) to be simulated by applying the principles of superposition and proportionality to separate storm components to determine the resulting cumulative hydrograph. This allows for a relatively straightforward calculation of the hydrograph response to any arbitrary rain event.

An instantaneous unit hydrograph is a further refinement of the concept; for an IUH, the input rainfall is assumed to all take place at a discrete point in time (obviously, this isn't the case for actual rainstorms). Making this assumption can greatly simplify the analysis involved in constructing a unit hydrograph, and it is necessary for the creation of a geomorphologic instantaneous unit hydrograph.

The creation of a GIUH is possible given nothing more than topologic data for a particular drainage basin. In fact, only the number of streams of a given order, the mean length of streams of a given order, and the mean land area draining directly to streams of a given order are absolutely required (and can be estimated rather than explicitly calculated if necessary). It is therefore possible to calculate a GIUH for a basin without any data about stream height or flow, which may not always be available.

Subsurface hydrology hydrograph

In subsurface hydrology (hydrogeology), a hydrograph is a record of the water level (the observed hydraulic head in wells screened across an aquifer).

Typically, a hydrograph is recorded for monitoring of heads in aquifers during non-test conditions (e.g., to observe the seasonal fluctuations in an aquifer). When an aquifer test is being performed, the resulting observations are typically called drawdown, since they are subtracted from pre-test levels and often only the change in water level is dealt with.

Raster hydrograph

A raster hydrograph. The entire flow record and patterns representing different timescales can be visualized. Raster hydrograph.png
A raster hydrograph. The entire flow record and patterns representing different timescales can be visualized.

Raster hydrographs are pixel-based plots for visualizing and identifying variations and changes in large multidimensional data sets. Originally developed by Keim (2000) they were first applied in hydrology by Koehler (2004) as a means of highlighting inter-annual and intra-annual changes in streamflow. The raster hydrographs in WaterWatch, like those developed by Koehler, depict years on the y-axis and days along the x-axis. Users can choose to plot streamflow (actual values or log values), streamflow percentile, or streamflow class (from 1, for low flow, to 7 for high flow), for Daily, 7-Day, 14-Day, and 28-Day streamflow. For a more comprehensive description of raster hydrographs, see Strandhagen et al. (2006).

Lag-1 hydrograph

A Lag-1 hydrograph is a graph of discharge which can be accomplished without a time axis (Koehler 2022). This technique allows data properties such as Q, dQ/dt, and d2Q/dt2, and trends of increasing, decreasing or no change flow to be readily seen and understood on a single graph. Flow pulse reference lines can easily be added and interpreted. The methodology is based on the time-series serial correlation lag-1 graph and uses the normally unwanted (but still valuable) autocorrelation present within the streamflow data.

The x-axis represents the discharge for a date, Qt, while the y-axis represents the discharge for the next day, Qt+1. Data preparation and plotting methods are identical to an autocorrelation lag 1 plot, where 1 indicates a 1-day or daily time step. The table below shows how the time-series discharge are shifted. It is critical that the temporal sequence is maintained for the data. Thinking of the x values as “flow for today” and the y values as “flow for tomorrow” helps visualize the order of the data.

Lag-1 hydrograph example (day number associated with Qt). Lag-1 hydrograph.jpg
Lag-1 hydrograph example (day number associated with Qt).
Data shift example (USGS site Colorado River at Lees Ferry, AZ, discharge in cubic feet per second (cfs)
DateQt (x)Qt+1 (y)
11-Sep-192743,20043,300
12-Sep-192743,30088,100
13-Sep-192788,100103,000
14-Sep-1927103,000110,000
15-Sep-1927110,00078,900
16-Sep-192778,90055,900
17-Sep-192755,90045,300
18-Sep-192745,30033,300


See also

Related Research Articles

<span class="mw-page-title-main">Hydrology</span> Science of the movement, distribution, and quality of water on Earth and other planets

Hydrology is the scientific study of the movement, distribution, and management of water on Earth and other planets, including the water cycle, water resources, and drainage basin sustainability. A practitioner of hydrology is called a hydrologist. Hydrologists are scientists studying earth or environmental science, civil or environmental engineering, and physical geography. Using various analytical methods and scientific techniques, they collect and analyze data to help solve water related problems such as environmental preservation, natural disasters, and water management.

<span class="mw-page-title-main">Stream gauge</span> Location used to monitor surface water flow

A stream gauge, streamgage or stream gauging station is a location used by hydrologists or environmental scientists to monitor and test terrestrial bodies of water. Hydrometric measurements of water level surface elevation ("stage") and/or volumetric discharge (flow) are generally taken and observations of biota and water quality may also be made. The locations of gauging stations are often found on topographical maps. Some gauging stations are highly automated and may include telemetry capability transmitted to a central data logging facility.

In hydrology, discharge is the volumetric flow rate of a stream. It equals the product of average flow velocity and the cross-sectional area. It includes any suspended solids, dissolved chemicals like CaCO
3
(aq), or biologic material in addition to the water itself. Terms may vary between disciplines. For example, a fluvial hydrologist studying natural river systems may define discharge as streamflow, whereas an engineer operating a reservoir system may equate it with outflow, contrasted with inflow.

Isotope hydrology is a field of geochemistry and hydrology that uses naturally occurring stable and radioactive isotopic techniques to evaluate the age and origins of surface and groundwater and the processes within the atmospheric hydrologic cycle. Isotope hydrology applications are highly diverse, and used for informing water-use policy, mapping aquifers, conserving water supplies, assessing sources of water pollution, and increasingly are used in eco-hydrology to study human impacts on all dimensions of the hydrological cycle and ecosystem services.

Drainage density is a quantity used to describe physical parameters of a drainage basin. First described by Robert E. Horton, drainage density is defined as the total length of channel in a drainage basin divided by the total area, represented by the following equation:

The United States Environmental Protection Agency (EPA) Storm Water Management Model (SWMM) is a dynamic rainfall–runoff–subsurface runoff simulation model used for single-event to long-term (continuous) simulation of the surface/subsurface hydrology quantity and quality from primarily urban/suburban areas.

Runoff is the flow of water across the earth, and is a major component in the hydrological cycle. Runoff that flows over land before reaching a watercourse is referred to as surface runoff or overland flow. Once in a watercourse, runoff is referred to as streamflow, channel runoff, or river runoff. Urban runoff is surface runoff created by urbanization.

<span class="mw-page-title-main">Water balance</span> Looks at how water moves in a closed system

The law of water balance states that the inflows to any water system or area is equal to its outflows plus change in storage during a time interval. In hydrology, a water balance equation can be used to describe the flow of water in and out of a system. A system can be one of several hydrological or water domains, such as a column of soil, a drainage basin, an irrigation area or a city.

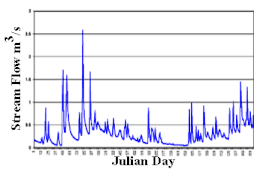
Streamflow, or channel runoff, is the flow of water in streams and other channels, and is a major element of the water cycle. It is one runoff component, the movement of water from the land to waterbodies, the other component being surface runoff. Water flowing in channels comes from surface runoff from adjacent hillslopes, from groundwater flow out of the ground, and from water discharged from pipes. The discharge of water flowing in a channel is measured using stream gauges or can be estimated by the Manning equation. The record of flow over time is called a hydrograph. Flooding occurs when the volume of water exceeds the capacity of the channel.

Baseflow is the portion of the streamflow that is sustained between precipitation events, fed to streams by delayed pathways. It should not be confused with groundwater flow. Fair weather flow is also called base flow.

<span class="mw-page-title-main">Hydrological transport model</span>

An hydrological transport model is a mathematical model used to simulate the flow of rivers, streams, groundwater movement or drainage front displacement, and calculate water quality parameters. These models generally came into use in the 1960s and 1970s when demand for numerical forecasting of water quality and drainage was driven by environmental legislation, and at a similar time widespread access to significant computer power became available. Much of the original model development took place in the United States and United Kingdom, but today these models are refined and used worldwide.

Geographic information systems (GISs) have become a useful and important tool in the field of hydrology to study and manage Earth's water resources. Climate change and greater demands on water resources require a more knowledgeable disposition of arguably one of our most vital resources. Because water in its occurrence varies spatially and temporally throughout the hydrologic cycle, its study using GIS is especially practical. Whereas previous GIS systems were mostly static in their geospatial representation of hydrologic features, GIS platforms are becoming increasingly dynamic, narrowing the gap between historical data and current hydrologic reality.

In hydrogeology, groundwater flow is defined as the "part of streamflow that has infiltrated the ground, entered the phreatic zone, and has been discharged into a stream channel or springs; and seepage water." It is governed by the groundwater flow equation. Groundwater is water that is found underground in cracks and spaces in the soil, sand and rocks. Where water has filled these spaces is the phreatic saturated zone. Groundwater is stored in and moves slowly through layers or zones of soil, sand and rocks: aquifers. The rate of groundwater flow depends on the permeability and the hydraulic head.

<span class="mw-page-title-main">Runoff model (reservoir)</span> Type of water motion

A runoff models or rainfall-runoff model describes how rainfall is converted into runoff in a drainage basin. More precisely, it produces a surface runoff hydrograph in response to a rainfall event, represented by and input as a hyetograph. Rainfall-runoff models need to be calibrated before they can be used.

<span class="mw-page-title-main">Hydrological model</span> Predicting and managing water resources

A hydrologic model is a simplification of a real-world system that aids in understanding, predicting, and managing water resources. Both the flow and quality of water are commonly studied using hydrologic models.

GSSHA is a two-dimensional, physically based watershed model developed by the Engineer Research and Development Center of the United States Army Corps of Engineers. It simulates surface water and groundwater hydrology, erosion and sediment transport. The GSSHA model is used for hydraulic engineering and research, and is on the Federal Emergency Management Agency (FEMA) list of hydrologic models accepted for use in the national flood insurance program for flood hydrograph estimation. Input is best prepared by the Watershed Modeling System interface, which effectively links the model with geographic information systems (GIS).

Baseflow residence time is a parameter useful in describing the mixing of waters from the infiltration of precipitation and pre-event groundwater in a watershed. It describes the average amount of time that water within the transient water supply resides in a watershed. Many methods of determining baseflow residence time have been developed, mostly involving mathematical models using a convolution integral approach with isotopic or chemical data as the input. Other methods that do not require such extensive and expensive data collection include Brutsaert and Nieber, which uses aquifer parameters as inputs, and Vitvar et al., which uses the stream flow hydrograph to determine baseflow recession parameters.

<span class="mw-page-title-main">Catchment hydrology</span> Hydrology of drainage basins

Catchment hydrology is the study of hydrology in drainage basins. Catchments are areas of land where runoff collects to a specific zone. This movement is caused by water moving from areas of high energy to low energy due to the influence of gravity. Catchments often do not last for long periods of time as the water evaporates, drains into the soil, or is consumed by animals.

<span class="mw-page-title-main">Vflo</span>

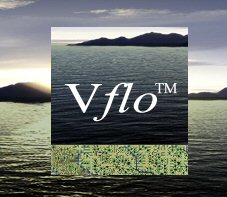
Vflo is a commercially available, physics-based distributed hydrologic model generated by Vieux & Associates, Inc. Vflo uses radar rainfall data for hydrologic input to simulate distributed runoff. Vflo employs GIS maps for parameterization via a desktop interface. The model is suited for distributed hydrologic forecasting in post-analysis and in continuous operations. Vflo output is in the form of hydrographs at selected drainage network grids, as well as distributed runoff maps covering the watershed. Model applications include civil infrastructure operations and maintenance, stormwater prediction and emergency management, continuous and short-term surface water runoff, recharge estimation, soil moisture monitoring, land use planning, water quality monitoring, and water resources management.

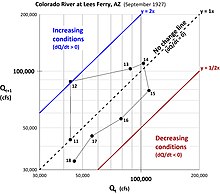
In hydrology, routing is a technique used to predict the changes in shape of a hydrograph as water moves through a river channel or a reservoir. In flood forecasting, hydrologists may want to know how a short burst of intense rain in an area upstream of a city will change as it reaches the city. Routing can be used to determine whether the pulse of rain reaches the city as a deluge or a trickle.

References

  1. Sherman, LeRoy K. (1932). "The relation of hydrographs of runoff to size and character of drainage-basins". Transactions, American Geophysical Union. 13 (1): 332. doi:10.1029/TR013i001p00332. ISSN   0002-8606.
  2. "Unit Hydrograph Theory: Terminology and Assumptions". download.comet.ucar.edu. Retrieved 2023-02-28.
  3. "Unit Hydrograph Theory: Unit Hydrograph Theory Terminology". download.comet.ucar.edu. Retrieved 2023-05-19.
  4. "Hydrographs - What is a Hydrograph?". geology.com. Retrieved 2023-02-28.
  5. Holtan, H. N.; Overton, D. E. (1963-01-01). "Analyses and application of simple hydrographs". Journal of Hydrology. 1 (3): 250–264. doi:10.1016/0022-1694(63)90005-2. ISSN   0022-1694.