
Graph drawing is an area of mathematics and computer science combining methods from geometric graph theory and information visualization to derive two-dimensional depictions of graphs arising from applications such as social network analysis, cartography, linguistics, and bioinformatics.

In information visualization and computing, treemapping is a method for displaying hierarchical data using nested figures, usually rectangles.
Software visualization or software visualisation refers to the visualization of information of and related to software systems—either the architecture of its source code or metrics of their runtime behavior—and their development process by means of static, interactive or animated 2-D or 3-D visual representations of their structure, execution, behavior, and evolution.
This page describes mining for molecules. Since molecules may be represented by molecular graphs this is strongly related to graph mining and structured data mining. The main problem is how to represent molecules while discriminating the data instances. One way to do this is chemical similarity metrics, which has a long tradition in the field of cheminformatics.
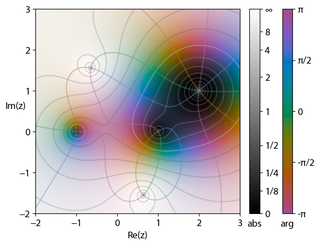
In complex analysis, domain coloring or a color wheel graph is a technique for visualizing complex functions by assigning a color to each point of the complex plane. By assigning points on the complex plane to different colors and brightness, domain coloring allows for a function from the complex plane to itself — whose graph would normally require four space dimensions — to be easily represented and understood. This provides insight to the fluidity of complex functions and shows natural geometric extensions of real functions.

Patrick M. Hanrahan is an American computer graphics researcher, the Canon USA Professor of Computer Science and Electrical Engineering in the Computer Graphics Laboratory at Stanford University. His research focuses on rendering algorithms, graphics processing units, as well as scientific illustration and visualization. He has received numerous awards, including the 2019 Turing Award.

The International Symposium on Graph Drawing (GD) is an annual academic conference in which researchers present peer reviewed papers on graph drawing, information visualization of network information, geometric graph theory, and related topics.
Enthought, Inc. is a software company based in Austin, Texas, United States that develops scientific and analytic computing solutions using primarily the Python programming language. It is best known for the early development and maintenance of the SciPy library of mathematics, science, and engineering algorithms and for its Python for scientific computing distribution Enthought Canopy.

Christopher Ray Johnson is an American computer scientist. He is a distinguished professor of computer science at the University of Utah, and founding director of the Scientific Computing and Imaging Institute (SCI). His research interests are in the areas of scientific computing and scientific visualization.

Targeted projection pursuit is a type of statistical technique used for exploratory data analysis, information visualization, and feature selection. It allows the user to interactively explore very complex data to find features or patterns of potential interest.
Kozo Sugiyama was a Japanese computer scientist and graph drawing researcher.

Peter D. Eades is an Australian computer scientist, an emeritus professor in the School of Information Technologies at the University of Sydney, known for his expertise in graph drawing.
Jarke J. (Jack) van Wijk is a Dutch computer scientist, a professor in the Department of Mathematics and Computer Science at the Eindhoven University of Technology, and an expert in information visualization.

Jean-Daniel Fekete is a French computer scientist.

In graph drawing, a circular layout is a style of drawing that places the vertices of a graph on a circle, often evenly spaced so that they form the vertices of a regular polygon.

NodeXL is a network analysis and visualization software package for Microsoft Excel 2007/2010/2013/2016. The package is similar to other network visualization tools such as Pajek, UCINet, and Gephi. It is widely applied in ring, mapping of vertex and edge, and customizable visual attributes and tags. NodeXL enables researchers to undertake social network analysis work metrics such as centrality, degree, and clustering, as well as monitor relational data and describe the overall relational network structure. When applied to Twitter data analysis, it showed the total network of all users participating in public discussion and its internal structure through data mining. It allows social Network analysis (SNA) to emphasize the relationships rather than the isolated individuals or organizations, allowing interested parties to investigate the two-way dialogue between organizations and the public. SNA also provides a flexible measurement system and parameter selection to confirm the influential nodes in the network, such as in-degree and out-degree centrality. The software contains network visualization, social network analysis features, access to social media network data importers, advanced network metrics, and automation.

Katalin Marton was a Hungarian mathematician, born in Budapest.

DeepDream is a computer vision program created by Google engineer Alexander Mordvintsev that uses a convolutional neural network to find and enhance patterns in images via algorithmic pareidolia, thus creating a dream-like appearance reminiscent of a psychedelic experience in the deliberately overprocessed images.
The IEEE Visualization Conference (VIS) is an annual conference on scientific visualization, information visualization, and visual analytics administrated by the IEEE Computer Society Technical Committee on Visualization and Graphics. As ranked by Google Scholar's h-index metric in 2016, VIS is the highest rated venue for visualization research and the second-highest rated conference for computer graphics over all. It has an 'A' rating from the Australian Ranking of ICT Conferences, an 'A' rating from the Brazilian ministry of education, and an 'A' rating from the China Computer Federation (CCF). The conference is highly selective with generally < 25% acceptance rates for all papers.