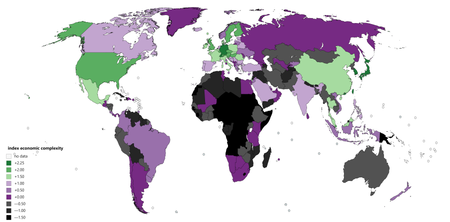

This list orders countries by their economic complexity index (ECI), as it was defined and calculated by Cesar A. Hidalgo and Ricardo Hausmann and published by The Observatory of Economic Complexity.
This list orders countries by their economic complexity index (ECI), as it was defined and calculated by Cesar A. Hidalgo and Ricardo Hausmann and published by The Observatory of Economic Complexity.
| Rank | Country | Economic complexity index (2018) | Change in 5 years (2013-18) | Change in 10 years (2008-18) |
|---|---|---|---|---|
| 1 | 2.43 | |||
| 2 | 2.17 | |||
| 3 | 2.11 | |||
| 4 | 2.09 | |||
| 5 | 1.85 | |||
| 6 | 1.81 | |||
| 7 | 1.80 | |||
| 8 | 1.70 | |||
| 9 | 1.66 | |||
| 10 | 1.62 | |||
| 11 | 1.55 | |||
| 12 | 1.55 | |||
| 13 | 1.51 | |||
| 14 | 1.44 | |||
| 15 | 1.41 | |||
| 16 | 1.37 | |||
| 17 | 1.36 | |||
| 18 | 1.34 | |||
| 19 | 1.34 | |||
| 20 | 1.29 | |||
| 21 | 1.20 | |||
| 22 | 1.18 | |||
| 23 | 1.17 | |||
| 24 | 1.10 | |||
| 25 | 1.09 | |||
| 26 | 1.03 | |||
| 27 | 0.98 | |||
| 28 | 0.96 | |||
| 29 | 0.89 | |||
| 30 | 0.87 | |||
| 31 | 0.86 | |||
| 32 | 0.83 | |||
| 33 | 0.80 | |||
| 34 | 0.70 | |||
| 35 | 0.67 | |||
| 36 | 0.67 | |||
| 37 | 0.67 | |||
| 38 | 0.67 | |||
| 39 | 0.65 | |||
| 40 | 0.64 | |||
| 41 | 0.55 | |||
| 42 | 0.54 | |||
| 43 | 0.44 | |||
| 44 | 0.37 | |||
| 45 | 0.35 | |||
| 46 | 0.34 | |||
| 47 | 0.33 | |||
| 48 | 0.30 | |||
| 49 | 0.21 | |||
| 50 | 0.18 | |||
| 51 | 0.17 | |||
| 52 | 0.14 | |||
| 53 | 0.13 | |||
| 54 | 0.13 | |||
| 55 | 0.11 | |||
| 56 | 0.10 | |||
| 57 | 0.07 | |||
| 58 | 0.05 | |||
| 59 | 0.04 | |||
| 60 | 0.02 | |||
| 61 | 0.02 | |||
| 62 | -0.01 | |||
| 63 | -0.02 | |||
| 64 | -0.04 | |||
| 65 | -0.04 | |||
| 66 | -0.06 | |||
| 67 | -0.08 | |||
| 68 | -0.09 | |||
| 69 | -0.17 | |||
| 70 | -0.18 | |||
| 71 | -0.18 | |||
| 72 | -0.18 | |||
| 73 | -0.21 | |||
| 74 | -0.24 | |||
| 75 | -0.31 | |||
| 76 | -0.32 | |||
| 77 | -0.34 | |||
| 78 | -0.36 | |||
| 79 | -0.39 | |||
| 80 | -0.41 | |||
| 81 | -0.43 | |||
| 82 | -0.45 | |||
| 83 | -0.48 | |||
| 84 | -0.48 | |||
| 85 | -0.49 | |||
| 86 | -0.50 | |||
| 87 | -0.53 | |||
| 88 | -0.55 | |||
| 89 | -0.55 | |||
| 90 | -0.56 | |||
| 91 | -0.56 | |||
| 92 | -0.58 | |||
| 93 | -0.59 | |||
| 94 | -0.62 | |||
| 95 | -0.63 | |||
| 96 | -0.63 | |||
| 97 | -0.66 | |||
| 98 | -0.67 | |||
| 99 | -0.68 | |||
| 100 | -0.70 | |||
| 101 | -0.71 | |||
| 102 | -0.78 | |||
| 103 | -0.80 | |||
| 104 | -0.81 | |||
| 105 | -0.84 | |||
| 106 | -0.84 | |||
| 107 | -0.88 | |||
| 108 | -0.88 | |||
| 109 | -0.93 | |||
| 110 | -0.96 | |||
| 111 | -0.97 | |||
| 112 | -0.97 | |||
| 113 | -1.01 | |||
| 114 | -1.03 | |||
| 115 | -1.04 | |||
| 116 | -1.09 | |||
| 117 | -1.11 | |||
| 118 | -1.12 | |||
| 119 | -1.14 | |||
| 120 | -1.15 | |||
| 121 | -1.25 | |||
| 122 | -1.31 | |||
| 123 | -1.31 | |||
| 124 | -1.37 | |||
| 125 | -1.42 | |||
| 126 | -1.43 | |||
| 127 | -1.43 | |||
| 128 | -1.46 | |||
| 129 | -1.60 | |||
| 130 | -1.68 | |||
| 131 | -1.71 | |||
| 132 | -1.80 | |||
| 133 | -1.90 |
As an illustration, we can observe the differences between Egypt and Thailand in ECI ranking between the years of 1995 and 2015, let us use the below figures as an example:
| Rank | Country | ECI Value | Year |
|---|---|---|---|
| 45 | Thailand | 0.30 | 1995 |
| 75 | Egypt | -0.41 | 1995 |
| 24 | Thailand | 1.06 | 2015 |
| 68 | Egypt | -0.23 | 2015 |
When we dig deeper into the export data of both countries, we can deduce that the differences were mainly in the composition of their relative export baskets. The more countries direct their efforts to more sophisticated products, the more it is reflected in the ECI score, and hence their potential economic growth.
For example, from 1995-2015, Thailand appears to have phased away from largely ubiquitous products “fur: 0.1 on the Product Complexity Index ("PCI"), Leather: 0.9 PCI, footwear: -0.7 PCI”, and focused their exports into products that few other countries can make “Cars: 2.47 PCI, parts and accessories of motor vehicles: 3.18 PCI, motor vehicles for transporting good: 1.87 PCI”.
Egypt, on the other hand, also experienced an increase in complexity, albeit much less than the one experienced by Thailand. They had a relatively high growth as a share of their total export portfolio in monitors and projectors: 0.9 PCI, but they also had a growth in insulated wires which has a PCI of -0.48.
So, in general, we can observe that Thailand has expanded in products with higher PCI than the ones they phased out from, while Egypt expanded in some higher PCI products, and also some lower ones hence the difference in ECI growth between the two.
For reference data, please go to https://oec.world/en/rankings/eci/hs6/hs96?tab=table

The economy of the Czech Republic is a developed export-oriented social market economy based in services, manufacturing, and innovation that maintains a high-income welfare state and the European social model. The Czech Republic participates in the European Single Market as a member of the European Union, and is therefore a part of the economy of the European Union. It uses its own currency, the Czech koruna, instead of the euro. It is a member of the Organisation for Economic Co-operation and Development (OECD). The Czech Republic ranks 16th in inequality-adjusted human development and 24th in World Bank Human Capital Index, ahead of countries such as the United States, the United Kingdom or France. It was described by The Guardian as "one of Europe's most flourishing economies".

The economy of Indonesia is the largest in Southeast Asia and is one of the emerging market economies. As a middle-income country and member of the G20, Indonesia is classified as a newly industrialized country. It is the 16th largest economy in the world by nominal GDP and the 7th largest in terms of GDP (PPP). Estimated at US$40 billion in 2019, Indonesia's Internet economy is expected to cross the US$130 billion mark by 2025. Indonesia depends on the domestic market and government budget spending and its ownership of state-owned enterprises. The administration of prices of a range of basic goods also plays a significant role in Indonesia's market economy. However, since the 1990s, the majority of the economy has been controlled by individual Indonesians and foreign companies.

The economy of Kazakhstan is the largest in Central Asia in both absolute and per capita terms. Kazakhstan has attracted to 2021 more than US$370 billion of foreign investments since becoming an independent republic after the collapse of the former Soviet Union.

The economy of Qatar is one of the highest in the world based on GDP per capita, ranking generally among the top ten richest countries on world rankings for 2015 and 2016 data compiled by the World Bank, the United Nations, and the International Monetary Fund (IMF). The country's economy has grown despite sanctions by its neighbors, Saudi Arabia and the United Arab Emirates.

The economy of Romania is a complex high-income economy with a skilled labour force, ranked 12th in the European Union by total nominal GDP and 7th largest when adjusted by purchasing power parity. The World Bank notes that Romania’s efforts are focused on accelerating structural reforms and strengthening institutions in order to further converge with the European Union. The country's economic growth has been one of the highest in the EU since 2010, with the first half of 2022 seeing an unexpected 5.8% increase.

The economy of South Korea is a highly developed mixed economy. By nominal GDP, it has the 4th largest economy in Asia and the 12th largest in the world. South Korea is notable for its rapid economic development from an underdeveloped nation to a developed, high-income country in a few generations. This economic growth has been described as the Miracle on the Han River, which has allowed it to join OECD and the G-20. South Korea remains one of the fastest-growing developed countries in the world following the Great Recession and the COVID-19 recession. It is included in the group of Next Eleven countries as having the potential to play a dominant role in the global economy by the middle of the 21st century.

The economy of Thailand is dependent on exports, which accounted in 2021 for about 58 per cent of the country's gross domestic product (GDP). Thailand itself is a newly industrialized country, with a GDP of 17.367 trillion baht (US$536 billion) in 2022, the 9th largest economy of Asia. As of 2018, Thailand has an average inflation of 1.06% and an account surplus of 7.5% of the country's GDP. Its currency, the Thai Baht, ranked as the tenth most frequently used world payment currency in 2017.

The 1997 Asian financial crisis was a period of financial crisis that gripped much of East and Southeast Asia during the late 1990s. The crisis began in Thailand in July 1997 before spreading to several other countries with a ripple effect, raising fears of a worldwide economic meltdown due to financial contagion. However, the recovery in 1998–1999 was rapid, and worries of a meltdown quickly subsided.
An emerging market is a market that has some characteristics of a developed market, but does not fully meet its standards. This includes markets that may become developed markets in the future or were in the past. The term "frontier market" is used for developing countries with smaller, riskier, or more illiquid capital markets than "emerging". As of 2006, the economies of China and India are considered to be the largest emerging markets. According to The Economist, many people find the term outdated, but no new term has gained traction. Emerging market hedge fund capital reached a record new level in the first quarter of 2011 of $121 billion. Emerging market economies’ share of global PPP-adjusted GDP has risen from 27 percent in 1960 to around 53 percent by 2013. The 10 largest emerging and developing economies by either nominal or PPP-adjusted GDP are 4 of the 5 BRICS countries along with Egypt, Indonesia, Mexico, South Korea, Saudi Arabia, Taiwan and Turkey.
Intra-industry trade refers to the exchange of similar products belonging to the same industry. The term is usually applied to international trade, where the same types of goods or services are both imported and exported.

The economic history of Brazil covers various economic events and traces the changes in the Brazilian economy over the course of the history of Brazil. Portugal, which first colonized the area in the 16th century, enforced a colonial pact with Brazil, an imperial mercantile policy, which drove development for the subsequent three centuries. Independence was achieved in 1822. Slavery was fully abolished in 1888. Important structural transformations began in the 1930s, when important steps were taken to change Brazil into a modern, industrialized economy.
The flying geese paradigm is a view of Japanese scholars regarding technological development in Southeast Asia which sees Japan as a leading power. It was developed in the 1930s, but gained wider popularity in the 1960s, after its author, Kaname Akamatsu, published his ideas in the Journal of Developing Economies.
Complexity economics is the application of complexity science to the problems of economics. It relaxes several common assumptions in economics, including general equilibrium theory. While it does not reject the existence of an equilibrium, it sees such equilibria as "a special case of nonequilibrium", and as an emergent property resulting from complex interactions between economic agents. The complexity science approach has also been applied to computational economics.
The East Asian model pioneered by Japan, is a plan for economic growth whereby the government invests in certain sectors of the economy in order to stimulate the growth of specific industries in the private sector. It generally refers to the model of development pursued in East Asian economies such as Japan, South Korea and Taiwan. It has also been used by some to describe the contemporary economic system in Mainland China after Deng Xiaoping's economic reforms during the late 1970s and the current economic system of Vietnam after its Đổi Mới policy was implemented in 1986.

The Product Space is a network that formalizes the idea of relatedness between products traded in the global economy. The network first appeared in the July 2007 issue of Science in the article "The Product Space Conditions the Development of Nations," written by Cesar A. Hidalgo, Bailey Klinger, Ricardo Hausmann, and Albert-László Barabási. The Product Space network has considerable implications for economic policy, as its structure helps elucidate why some countries undergo steady economic growth while others become stagnant and are unable to develop. The concept has been further developed and extended by The Observatory of Economic Complexity, through visualizations such as the Product Exports Treemaps and new indexes such as the Economic Complexity Index (ECI), which have been condensed into the Atlas of Economic Complexity. From the new analytic tools developed, Hausmann, Hidalgo and their team have been able to elaborate predictions of future economic growth.
The Economic Complexity Index (ECI) is a holistic measure of the productive capabilities of large economic systems, usually cities, regions, or countries. In particular, the ECI looks to explain the knowledge accumulated in a population and that is expressed in the economic activities present in a city, country, or region. To achieve this goal, the ECI defines the knowledge available in a location, as the average knowledge of the activities present in it, and the knowledge of an activity as the average knowledge of the places where that economic activity is conducted. The product equivalent of the Economic Complexity Index is the Product Complexity Index or PCI.

Argentina has strong cultural and historical links to the European Union (EU) and the EU is Argentina's biggest investor.

Bilateral relations between the Republic of Singapore and the Kingdom of Thailand formally date to 1965, when Thailand established diplomatic relations soon after the independence of Singapore. Both countries are the founding members of the Association of Southeast Asian Nations.

As of 2019, the automotive industry in Thailand is the largest in Southeast Asia and the 10th largest in the world. The Thai industry has an annual output of more than two million vehicles, more than countries such as Belgium, Canada, the United Kingdom, Italy, Czech Republic and Turkey.

Relations between the Republic of Singapore and the Republic of Korea started when a trade mission from South Korea visited the Colony of Singapore in 1950. The two countries established formal diplomatic relations in 1975, but South Korea established a trade office and a consulate-general, and sent a special envoy to visit Singapore before that. Both countries are the only two United Nations members in the Four Asian Tigers. In 2014, South Korea was the fourth-largest import source of Singapore.