List of public corporations by market capitalization

Last updated

The following is a list of publicly traded companies having the greatest market capitalization. In the global business media, they are described as being the world's most valuable companies as a reference to their market value. [1]

Contents

Market capitalization is calculated from the share price (as recorded on selected day) multiplied by the number of outstanding shares. [2] Figures are converted into USD millions (using rate from selected day) to allow for comparison. [3]

Trillion-dollar companies

The table below lists all companies which have, at any point, had a market capitalization in excess of $1 trillion, the date on which their market cap first exceeded $1 trillion and their record market cap. [4]

CompanyCountryWhen first passedRecord value dateRecord value (in billions USD)Notes
$1 trillion$2 trillion$3 trillionNominalInflation-
adjusted [5]
Microsoft Flag of the United States.svg 25 April 201922 June 202124 January 202423 March 20243,1853,185 [6] [7] [8] [9]
Apple Flag of the United States.svg 2 August 201819 August 20203 January 202214 December 20233,0813,081 [10] [11] [12] [13]
Saudi Aramco Flag of Saudi Arabia.svg 11 December 201912 December 201910 May 20222,4632,463 [14] [15] [16]
Nvidia Flag of the United States.svg 30 May 202323 February 20248 March 20242,3802,380 [17] [18] [19]
Alphabet Flag of the United States.svg 16 January 20208 November 202118 November 20212,0002,160 [20] [21] [22]
Amazon Flag of the United States.svg 4 September 201813 July 20211,9002,052 [23] [24] [25]
Meta Flag of the United States.svg 28 June 20212 February 20241,2201,220 [note 1] [26] [27]
Tesla Flag of the United States.svg 25 October 20211 November 20211,2101,307 [28] [29]
PetroChina Flag of the People's Republic of China.svg 5 November 20075 November 20071,2001,640 [note 2]

Publicly traded companies

All market capitalization figures are in USD millions. Only companies with free float of at least 15% are included; the value of unlisted stock classes is excluded. Investment companies are not included in the list. [3]

2023

This list is up to date as of 31 December 2023. Indicated changes in market value are relative to the previous quarter.

RankFirst quarterSecond quarterThird quarterFourth quarter
1 Flag of the United States.svg Apple
Increase2.svg2,609,000 [33]
Flag of the United States.svg Apple
Increase2.svg3,050,000 [33]
Flag of the United States.svg Apple
Decrease2.svg2,677,000 [33]
Flag of the United States.svg Apple
Increase2.svg2,994,000 [33]
2 Flag of the United States.svg Microsoft
Increase2.svg2,146,000 [34]
Flag of the United States.svg Microsoft
Increase2.svg2,532,000 [34]
Flag of the United States.svg Microsoft
Decrease2.svg2,346,000 [34]
Flag of the United States.svg Microsoft
Increase2.svg2,795,000 [34]
3 Flag of the United States.svg Alphabet
Increase2.svg1,332,000 [35]
Flag of the United States.svg Alphabet
Increase2.svg1,530,000 [35]
Flag of the United States.svg Alphabet
Increase2.svg1,662,000 [35]
Flag of the United States.svg Alphabet
Increase2.svg1,764,000 [35]
4 Flag of the United States.svg Amazon
Increase2.svg1,058,000 [36]
Flag of the United States.svg Amazon
Increase2.svg1,337,000 [36]
Flag of the United States.svg Amazon
Decrease2.svg1,312,000 [36]
Flag of the United States.svg Amazon
Increase2.svg1,570,000 [36]
5 Flag of the United States.svg Nvidia
Increase2.svg686,090 [37]
Flag of the United States.svg Nvidia
Increase2.svg1,044,000 [37]
Flag of the United States.svg Nvidia
Increase2.svg1,074,000 [37]
Flag of the United States.svg Nvidia
Increase2.svg1,223,000 [37]
6 Flag of the United States.svg Berkshire Hathaway
Decrease2.svg677,770 [38]
Flag of the United States.svg Tesla
Increase2.svg829,670 [39]
Flag of the United States.svg Tesla
Decrease2.svg794,200 [39]
Flag of the United States.svg Meta
Increase2.svg909,000 [40]
7 Flag of the United States.svg Tesla
Increase2.svg656,420 [39]
Flag of the United States.svg Berkshire Hathaway
Increase2.svg745,010 [38]
Flag of the United States.svg Meta
Increase2.svg772,490 [40]
Flag of the United States.svg Tesla
Decrease2.svg789,930 [39]
8 Flag of the United States.svg Meta
Increase2.svg549,480 [41]
Flag of the United States.svg Meta
Increase2.svg735,450 [41]
Flag of the United States.svg Berkshire Hathaway
Increase2.svg769,260 [38]
Flag of the United States.svg Berkshire Hathaway
Increase2.svg783,550 [38]
9 Flag of the Republic of China.svg TSMC
Increase2.svg482,410 [42]
Flag of the Republic of China.svg TSMC
Increase2.svg523,410 [42]
Flag of the United States.svg Eli Lilly
Increase2.svg509,890 [43]
Flag of the United States.svg Eli Lilly
Increase2.svg553,370 [43]
10 Flag of the United States.svg Visa
Increase2.svg473,870 [44]
Flag of the United States.svg Visa
Increase2.svg497,370 [44]
Flag of the United States.svg Visa
Decrease2.svg480,990 [44]
Flag of the Republic of China.svg TSMC
Increase2.svg539,390 [42]

2022

This list is as of 31 December 2022. Indicated changes in market value are relative to the previous quarter.

RankFirst quarterSecond quarterThird quarterFourth quarter
1 Flag of the United States.svg Apple
Decrease2.svg2,850,000 [33]
Flag of the United States.svg Apple
Decrease2.svg2,212,000 [33]
Flag of the United States.svg Apple
Increase2.svg2,221,000 [33]
Flag of the United States.svg Apple

Decrease2.svg2,066,000 [33]

2 Flag of the United States.svg Microsoft
Decrease2.svg2,311,000 [34]
Flag of the United States.svg Microsoft
Decrease2.svg1,920,000 [34]
Flag of the United States.svg Microsoft
Decrease2.svg1,737,000 [34]
Flag of the United States.svg Microsoft

Increase2.svg1,787,000 [34]

3 Flag of the United States.svg Alphabet
Decrease2.svg1,846,000 [35]
Flag of the United States.svg Alphabet
Decrease2.svg1,435,000 [35]
Flag of the United States.svg Alphabet
Decrease2.svg1,254,000 [35]
Flag of the United States.svg Alphabet

Decrease2.svg1,145,000 [35]

4 Flag of the United States.svg Amazon
Decrease2.svg1,659,000 [36]
Flag of the United States.svg Amazon
Decrease2.svg1,080,000 [36]
Flag of the United States.svg Amazon
Increase2.svg1,151,000 [36]
Flag of the United States.svg Amazon

Decrease2.svg856,940 [36]

5 Flag of the United States.svg Tesla
Increase2.svg1,114,000 [39]
Flag of the United States.svg Tesla
Decrease2.svg697,660 [39]
Flag of the United States.svg Tesla
Increase2.svg831,150 [39]
Flag of the United States.svg Berkshire Hathaway

Increase2.svg681,770 [38]

6 Flag of the United States.svg Berkshire Hathaway
Increase2.svg779,150 [38]
Flag of the United States.svg Berkshire Hathaway
Decrease2.svg602,450 [38]
Flag of the United States.svg Berkshire Hathaway
Decrease2.svg596,410 [38]
Flag of the United States.svg UnitedHealth

Increase2.svg495,370 [45]

7 Flag of the United States.svg Nvidia
Decrease2.svg684,880 [37]
Flag of the United States.svg UnitedHealth
Increase2.svg481,870 [45]
Flag of the United States.svg UnitedHealth
Decrease2.svg472,410 [45]
Flag of the United States.svg Johnson & Johnson

Increase2.svg461,840 [46]

8 Flag of the United States.svg Meta
Decrease2.svg605,250 [41]
Flag of the United States.svg Johnson & Johnson
Decrease2.svg467,090 [46]
Flag of the United States.svg Johnson & Johnson
Decrease2.svg429,500 [46]
Flag of the United States.svg ExxonMobil

Increase2.svg454,240 [47]

9 Flag of the Republic of China.svg TSMC
Decrease2.svg540,670 [42]
Flag of the People's Republic of China.svg Tencent
Decrease2.svg445,990 [48]
Flag of the United States.svg Visa
Increase2.svg374,380 [44]
Flag of the United States.svg Visa

Increase2.svg439,950 [44]

10 Flag of the United States.svg UnitedHealth
Increase2.svg479,830 [45]
Flag of the United States.svg Meta
Decrease2.svg436,390 [41]
Flag of the United States.svg Meta
Decrease2.svg364,650 [49]
Flag of the People's Republic of China.svg Tencent

Increase2.svg405,090 [48]

2021

This list is up to date as of December 31,2021. Indicated changes in market value are relative to the previous quarter.

RankFirst quarterSecond quarterThird quarterFourth quarter
1 Flag of the United States.svg Apple
Decrease2.svg2,050,000 [33]
Flag of the United States.svg Apple
Increase2.svg2,286,000 [33]
Flag of the United States.svg Apple
Increase2.svg2,339,000 [33]
Flag of the United States.svg Apple
Increase2.svg2,913,000 [33]
2 Flag of the United States.svg Microsoft
Increase2.svg1,778,000 [34]
Flag of the United States.svg Microsoft
Increase2.svg2,040,000 [34]
Flag of the United States.svg Microsoft
Increase2.svg2,119,000 [34]
Flag of the United States.svg Microsoft
Increase2.svg2,525,000 [34]
3 Flag of the United States.svg Amazon
Decrease2.svg1,558,000 [36]
Flag of the United States.svg Amazon
Increase2.svg1,735,000 [36]
Flag of the United States.svg Alphabet
Increase2.svg1,777,000 [35]
Flag of the United States.svg Alphabet
Increase2.svg1,922,000 [35]
4 Flag of the United States.svg Alphabet
Increase2.svg1,395,000 [35]
Flag of the United States.svg Alphabet
Increase2.svg1,680,000 [35]
Flag of the United States.svg Amazon
Decrease2.svg1,664,000 [36]
Flag of the United States.svg Amazon
Increase2.svg1,691,000 [36]
5 Flag of the United States.svg Meta
Increase2.svg838,720 [41]
Flag of the United States.svg Meta
Increase2.svg985,920 [41]
Flag of the United States.svg Meta
Decrease2.svg956,890 [41]
Flag of the United States.svg Tesla
Increase2.svg1,061,000 [39]
6 Flag of the People's Republic of China.svg Tencent
Increase2.svg766,970 [48]
Flag of the People's Republic of China.svg Tencent
Decrease2.svg721,460 [48]
Flag of the United States.svg Tesla
Increase2.svg776,850 [39]
Flag of the United States.svg Meta
Decrease2.svg935,640 [41]
7 Flag of the United States.svg Tesla
Decrease2.svg641,110 [39]
Flag of the United States.svg Tesla
Increase2.svg654,780 [39]
Flag of the United States.svg Berkshire Hathaway
Decrease2.svg619,950 [38]
Flag of the United States.svg Nvidia
Increase2.svg732,920 [37]
8 Flag of the People's Republic of China.svg Alibaba Group
Decrease2.svg615,010 [50]
Flag of the United States.svg Berkshire Hathaway
Increase2.svg637,280 [38]
Flag of the Republic of China.svg TSMC
Decrease2.svg579,030 [42]
Flag of the United States.svg Berkshire Hathaway
Increase2.svg668,630 [38]
9 Flag of the Republic of China.svg TSMC
Increase2.svg613,410 [42]
Flag of the Republic of China.svg TSMC
Increase2.svg623,160 [42]
Flag of the People's Republic of China.svg Tencent
Decrease2.svg574,460 [48]
Flag of the Republic of China.svg TSMC
Increase2.svg623,930 [42]
10 Flag of the United States.svg Berkshire Hathaway
Increase2.svg590,050 [38]
Flag of the People's Republic of China.svg Alibaba Group
Increase2.svg615,140 [50]
Flag of the United States.svg Nvidia
Increase2.svg517,900 [37]
Flag of the People's Republic of China.svg Tencent
Decrease2.svg559,900 [48]

2020

This Financial Times –based list is up to data as of December 31,2020. Indicated changes in market value are relative to the previous quarter.

RankFirst quarterSecond quarterThird quarterFourth quarter
1 Flag of the United States.svg Microsoft
Decrease2.svg1,200,000 [34]
Flag of the United States.svg Apple
Increase2.svg1,576,000 [33]
Flag of the United States.svg Apple
Increase2.svg1,981,000 [33]
Flag of the United States.svg Apple
Increase2.svg2,254,000 [33]
2 Flag of the United States.svg Apple
Decrease2.svg1,113,000 [33]
Flag of the United States.svg Microsoft
Increase2.svg1,551,000 [34]
Flag of the United States.svg Microsoft
Increase2.svg1,592,000 [34]
Flag of the United States.svg Microsoft
Increase2.svg1,682,000 [34]
3 Flag of the United States.svg Amazon
Increase2.svg970,590 [36]
Flag of the United States.svg Amazon
Increase2.svg1,432,590 [36]
Flag of the United States.svg Amazon
Increase2.svg1,577,000 [36]
Flag of the United States.svg Amazon
Increase2.svg1,634,000 [36]
4 Flag of the United States.svg Alphabet
Decrease2.svg799,180 [35]
Flag of the United States.svg Alphabet
Increase2.svg979,700 [35]
Flag of the United States.svg Alphabet
Increase2.svg999,570 [35]
Flag of the United States.svg Alphabet
Increase2.svg1,185,000 [35]
5 Flag of the People's Republic of China.svg Alibaba Group
Decrease2.svg521,740 [50]
Flag of the United States.svg Facebook
Increase2.svg675,690 [41]
Flag of the People's Republic of China.svg Alibaba Group
Increase2.svg795,400 [50]
Flag of the United States.svg Facebook
Increase2.svg776,590 [41]
6 Flag of the United States.svg Facebook
Decrease2.svg475,460 [41]
Flag of the People's Republic of China.svg Tencent
Increase2.svg620,920 [48]
Flag of the United States.svg Facebook
Increase2.svg746,100 [41]
Flag of the People's Republic of China.svg Tencent
Increase2.svg683,470 [48]
7 Flag of the People's Republic of China.svg Tencent
Increase2.svg471,660 [48]
Flag of the People's Republic of China.svg Alibaba Group
Increase2.svg579,740 [50]
Flag of the People's Republic of China.svg Tencent
Increase2.svg646,790 [48]
Flag of the United States.svg Tesla
Increase2.svg668,080 [39]
8 Flag of the United States.svg Berkshire Hathaway
Decrease2.svg440,830 [38]
Flag of the United States.svg Berkshire Hathaway
Decrease2.svg432,570 [38]
Flag of the United States.svg Berkshire Hathaway
Increase2.svg509,470 [38]
Flag of the People's Republic of China.svg Alibaba Group
Decrease2.svg628,650 [50]
9 Flag of the United States.svg Visa
Decrease2.svg357,020 [51]
Flag of the United States.svg Visa
Increase2.svg412,710 [51]
Flag of the United States.svg Visa
Increase2.svg425,510 [51]
Flag of the Republic of China.svg TSMC
Increase2.svg565,280 [42]
10 Flag of the United States.svg Johnson & Johnson
Decrease2.svg345,700 [46]
Flag of the United States.svg Johnson & Johnson
Increase2.svg370,590 [46]
Flag of the Republic of China.svg TSMC
Increase2.svg420,440 [42]
Flag of the United States.svg Berkshire Hathaway
Increase2.svg544,780 [38]

2019

This Financial Times –based list is up to date as of December 31,2019. Indicated changes in market value are relative to the previous quarter.

RankFirst quarterSecond quarterThird quarterFourth quarter
1 Flag of the United States.svg Microsoft
Increase2.svg904,860 [34]
Flag of the United States.svg Microsoft
Increase2.svg1,028,000 [34]
Flag of the United States.svg Microsoft
Increase2.svg1,062,000 [34]
Flag of the United States.svg Apple
Increase2.svg1,305,000 [33]
2 Flag of the United States.svg Apple
Increase2.svg835,670 [33]
Flag of the United States.svg Amazon
Increase2.svg928,540 [36]
Flag of the United States.svg Apple
Increase2.svg1,012,000 [33]
Flag of the United States.svg Microsoft
Increase2.svg1,203,000 [34]
3 Flag of the United States.svg Amazon
Increase2.svg874,710 [36]
Flag of the United States.svg Apple
Increase2.svg911,240 [33]
Flag of the United States.svg Amazon
Decrease2.svg858,680 [36]
Flag of the United States.svg Alphabet
Increase2.svg922,130 [35]
4 Flag of the United States.svg Alphabet
Increase2.svg818,160 [35]
Flag of the United States.svg Alphabet
Decrease2.svg751,170 [35]
Flag of the United States.svg Alphabet
Increase2.svg838,020 [35]
Flag of the United States.svg Amazon
Increase2.svg916,150 [36]
5 Flag of the United States.svg Berkshire Hathaway
Decrease2.svg493,750 [38]
Flag of the United States.svg Facebook
Increase2.svg551,490 [41]
Flag of the United States.svg Berkshire Hathaway
Decrease2.svg508,530 [38]
Flag of the United States.svg Facebook
Increase2.svg585,320 [41]
6 Flag of the United States.svg Facebook
Increase2.svg475,730 [41]
Flag of the United States.svg Berkshire Hathaway
Increase2.svg521,100 [38]
Flag of the United States.svg Facebook
Decrease2.svg508,050 [41]
Flag of the People's Republic of China.svg Alibaba Group
Increase2.svg569,010 [50]
7 Flag of the People's Republic of China.svg Alibaba Group
Increase2.svg472,940 [50]
Flag of the People's Republic of China.svg Alibaba Group
Decrease2.svg439,150 [50]
Flag of the People's Republic of China.svg Alibaba Group
Decrease2.svg435,400 [50]
Flag of the United States.svg Berkshire Hathaway
Increase2.svg553,530 [38]
8 Flag of the People's Republic of China.svg Tencent
Increase2.svg440,980 [48]
Flag of the People's Republic of China.svg Tencent
Decrease2.svg432,080 [48]
Flag of the People's Republic of China.svg Tencent
Decrease2.svg398,840 [48]
Flag of the People's Republic of China.svg Tencent
Increase2.svg461,370 [48]
9 Flag of the United States.svg Johnson & Johnson
Increase2.svg372,230 [46]
Flag of the United States.svg Visa
Increase2.svg379,271 [51]
Flag of the United States.svg Visa
Increase2.svg385,370 [51]
Flag of the United States.svg JPMorgan Chase
Increase2.svg437,230 [52]
10 Flag of the United States.svg Visa
Increase2.svg353,710 [51]
Flag of the United States.svg Johnson & Johnson
Decrease2.svg370,300 [46]
Flag of the United States.svg JPMorgan Chase
Increase2.svg376,310 [52]
Flag of the United States.svg Visa
Increase2.svg416,790 [51]

2018

This Financial Times –based list is up to date as of December 31,2018. Indicated changes in market value are relative to the previous quarter.

RankFirst quarterSecond quarterThird quarterFourth quarter
1 Flag of the United States.svg Apple
Decrease2.svg851,317
Flag of the United States.svg Apple
Increase2.svg909,840 [33]
Flag of the United States.svg Apple
Increase2.svg1,091,000 [33]
Flag of the United States.svg Microsoft
Decrease2.svg780,520 [34]
2 Flag of the United States.svg Alphabet
Decrease2.svg715,404
Flag of the United States.svg Amazon
Increase2.svg824,790 [36]
Flag of the United States.svg Amazon
Increase2.svg976,650 [36]
Flag of the United States.svg Apple
Decrease2.svg748,680 [33]
3 Flag of the United States.svg Microsoft
Increase2.svg702,760 [34]
Flag of the United States.svg Alphabet
Increase2.svg774,840 [35]
Flag of the United States.svg Microsoft
Increase2.svg877,400 [34]
Flag of the United States.svg Amazon
Decrease2.svg735,900 [36]
4 Flag of the United States.svg Amazon
Increase2.svg700,672 [36]
Flag of the United States.svg Microsoft
Increase2.svg757,640 [34]
Flag of the United States.svg Alphabet
Increase2.svg839,740 [53]
Flag of the United States.svg Alphabet
Decrease2.svg728,360 [53]
5 Flag of the People's Republic of China.svg Tencent
Increase2.svg507,990 [48]
Flag of the United States.svg Facebook
Increase2.svg562,480 [41]
Flag of the United States.svg Berkshire Hathaway
Increase2.svg523,520 [38]
Flag of the United States.svg Berkshire Hathaway
Decrease2.svg499,590 [38]
6 Flag of the United States.svg Berkshire Hathaway
Increase2.svg492,019 [38]
Flag of the People's Republic of China.svg Tencent
Decrease2.svg478,580 [48]
Flag of the United States.svg Facebook
Decrease2.svg473,850 [41]
Flag of the United States.svg Facebook
Decrease2.svg375,890 [41]
7 Flag of the People's Republic of China.svg Alibaba Group
Increase2.svg470,930 [50]
Flag of the People's Republic of China.svg Alibaba Group
Increase2.svg476,040 [50]
Flag of the People's Republic of China.svg Alibaba Group
Decrease2.svg423,600 [50]
Flag of the People's Republic of China.svg Tencent
Decrease2.svg375,110 [48]
8 Flag of the United States.svg Facebook
Decrease2.svg464,189 [41]
Flag of the United States.svg Berkshire Hathaway
Decrease2.svg463,980 [38]
Flag of the People's Republic of China.svg Tencent
Decrease2.svg388,080 [48]
Flag of the People's Republic of China.svg Alibaba Group
Decrease2.svg355,130 [50]
9 Flag of the United States.svg JPMorgan Chase
Increase2.svg377,410 [52]
Flag of the United States.svg JPMorgan Chase
Decrease2.svg354,780 [52]
Flag of the United States.svg JPMorgan Chase
Increase2.svg379,440 [52]
Flag of the United States.svg Johnson & Johnson
Decrease2.svg346,110 [46]
10 Flag of the United States.svg Johnson & Johnson
Decrease2.svg343,780 [46]
Flag of the United States.svg ExxonMobil
Increase2.svg350,270 [54]
Flag of the United States.svg Johnson & Johnson
Increase2.svg370,650 [46]
Flag of the United States.svg JPMorgan Chase
Decrease2.svg324,660 [52]

2017

This Financial Times –based list is up to date as of December 31,2017. Indicated changes in market value are relative to the previous quarter.

RankFirst quarter [55] [note 3] Second quarter [56] [note 3] Third quarter [57] [note 3] Fourth quarter
1 Flag of the United States.svg Apple
Increase2.svg753,718
Flag of the United States.svg Apple
Decrease2.svg749,124
Flag of the United States.svg Apple
Increase2.svg791,726
Flag of the United States.svg Apple
Increase2.svg868,880 [33]
2 Flag of the United States.svg Alphabet
Increase2.svg573,570 [35]
Flag of the United States.svg Alphabet
Increase2.svg628,610 [35]
Flag of the United States.svg Alphabet
Increase2.svg664,550 [35]
Flag of the United States.svg Alphabet
Increase2.svg727,040 [35]
3 Flag of the United States.svg Microsoft
Increase2.svg508,935
Flag of the United States.svg Microsoft
Increase2.svg528,778
Flag of the United States.svg Microsoft
Increase2.svg568,965
Flag of the United States.svg Microsoft
Increase2.svg659,910 [34]
4 Flag of the United States.svg Amazon
Increase2.svg423,031
Flag of the United States.svg Amazon
Increase2.svg466,471
Flag of the United States.svg Amazon
Decrease2.svg459,435
Flag of the United States.svg Amazon
Increase2.svg563,540 [36]
5 Flag of the United States.svg Berkshire Hathaway
Increase2.svg410,880 [38]
Flag of the United States.svg Berkshire Hathaway
Increase2.svg418,880 [38]
Flag of the United States.svg Berkshire Hathaway
Increase2.svg451,840 [38]
Flag of the United States.svg Facebook
Increase2.svg512,760 [41]
6 Flag of the United States.svg ExxonMobil
Increase2.svg339,897
Flag of the United States.svg Johnson & Johnson
Increase2.svg357,310
Flag of the People's Republic of China.svg Alibaba Group
Increase2.svg436,850 [50]
Flag of the People's Republic of China.svg Tencent
Increase2.svg493,340 [58]
7 Flag of the United States.svg Johnson & Johnson
Increase2.svg337,947
Flag of the United States.svg Facebook
Increase2.svg357,176
Flag of the People's Republic of China.svg Tencent
Increase2.svg405,007
Flag of the United States.svg Berkshire Hathaway
Increase2.svg489,490 [38]
8 Flag of the United States.svg Facebook
Increase2.svg334,552
Flag of the People's Republic of China.svg Alibaba Group
Increase2.svg356,390 [50]
Flag of the United States.svg Facebook
Increase2.svg399,946
Flag of the People's Republic of China.svg Alibaba Group
Increase2.svg440,712 [58]
9 Flag of the United States.svg JPMorgan Chase
Increase2.svg313,761
Flag of the People's Republic of China.svg Tencent
Increase2.svg344,879
Flag of the United States.svg ExxonMobil
Increase2.svg348,248
Flag of the United States.svg Johnson & Johnson
Increase2.svg375,360 [46]
10 Flag of the United States.svg Wells Fargo
Increase2.svg278,516
Flag of the United States.svg ExxonMobil
Increase2.svg341,947
Flag of the United States.svg Johnson & Johnson
Decrease2.svg347,497
Flag of the United States.svg JPMorgan Chase
Increase2.svg371,050 [52]

2016

This Financial Times –based list is up to date as of December 31,2016. Indicated changes in market value are relative to the previous quarter.

RankFirst quarter [59] [note 3] Second quarter [60] [note 3] Third quarter [61] [note 3] Fourth quarter [62] [note 3]
1 Flag of the United States.svg Apple
Increase2.svg607,465
Flag of the United States.svg Apple
Decrease2.svg517,069
Flag of the United States.svg Apple
Increase2.svg604,475
Flag of the United States.svg Apple
Increase2.svg617,588.49
2 Flag of the United States.svg Alphabet
Increase2.svg535,660 [35]
Flag of the United States.svg Alphabet
Decrease2.svg475,320 [35]
Flag of the United States.svg Alphabet
Increase2.svg535,660 [35]
Flag of the United States.svg Alphabet
Decrease2.svg531,970 [35]
3 Flag of the United States.svg Microsoft
Increase2.svg439,734
Flag of the United States.svg Microsoft
Decrease2.svg397,268
Flag of the United States.svg Microsoft
Increase2.svg447,290
Flag of the United States.svg Microsoft
Increase2.svg483,160.28
4 Flag of the United States.svg ExxonMobil
Increase2.svg350,991
Flag of the United States.svg ExxonMobil
Increase2.svg383,396
Flag of the United States.svg Amazon
Increase2.svg393,030
Flag of the United States.svg Berkshire Hathaway
Increase2.svg404,390 [38]
5 Flag of the United States.svg Berkshire Hathaway
Increase2.svg349,740 [38]
Flag of the United States.svg Berkshire Hathaway
Decrease2.svg345,860 [38]
Flag of the United States.svg ExxonMobil
Decrease2.svg358,519
Flag of the United States.svg ExxonMobil
Increase2.svg374,280
6 Flag of the United States.svg Johnson & Johnson
Increase2.svg300,604
Flag of the United States.svg Amazon
Increase2.svg337,641
Flag of the United States.svg Berkshire Hathaway
Increase2.svg358,300 [38]
Flag of the United States.svg Amazon
Decrease2.svg356,313.12
7 Flag of the United States.svg General Electric
Decrease2.svg295,546
Flag of the United States.svg Johnson & Johnson
Increase2.svg328,234
Flag of the United States.svg Johnson & Johnson
Decrease2.svg320,836
Flag of the United States.svg Johnson & Johnson
Decrease2.svg313,432.46
8 Flag of the United States.svg Amazon
Decrease2.svg281,888
Flag of the United States.svg General Electric
Decrease2.svg280,927
Flag of the United States.svg Facebook
Increase2.svg297,548
Flag of the United States.svg JPMorgan Chase
Increase2.svg308,768.42
9 Flag of the United States.svg Facebook
Increase2.svg259,192
Flag of the United States.svg Facebook
Increase2.svg263,930
Flag of the People's Republic of China.svg Tencent
Increase2.svg265,603
Flag of the United States.svg General Electric
Increase2.svg279,545.92
10 Flag of the United States.svg Wells Fargo
Decrease2.svg246,035
Flag of the United States.svg AT&T
Increase2.svg261,035
Flag of the United States.svg General Electric
Decrease2.svg261,876
Flag of the United States.svg Wells Fargo
Decrease2.svg276,779.12

2015

This Financial Times –based list is up to date as of December 31,2015. Indicated changes in market value are relative to the previous quarter.

RankFirst quarter [63] Second quarter [64] Third quarter [65] [note 3] Fourth quarter [66] [note 3]
1 Flag of the United States.svg Apple
Increase2.svg724,773.1
Flag of the United States.svg Apple
Decrease2.svg722,576.9
Flag of the United States.svg Apple
Decrease2.svg621,939
Flag of the United States.svg Apple
Decrease2.svg598,344
2 Flag of the United States.svg ExxonMobil
Decrease2.svg356,548.7
Flag of the United States.svg Microsoft
Increase2.svg357,154.4
Flag of the United States.svg Google
Increase2.svg407,870 [35]
Flag of the United States.svg Alphabet
Increase2.svg534,090 [35]
3 Flag of the United States.svg Berkshire Hathaway
Decrease2.svg356,510.7
Flag of the United States.svg ExxonMobil
Decrease2.svg347,868.1
Flag of the United States.svg Microsoft
Decrease2.svg347,432
Flag of the United States.svg Microsoft
Increase2.svg449,799
4 Flag of the United States.svg Google
Increase2.svg345,849.2 [67]
Flag of the United States.svg Google
Increase2.svg336,014.5 [35]
Flag of the United States.svg Berkshire Hathaway
Decrease2.svg318,180 [38]
Flag of the United States.svg Berkshire Hathaway
Increase2.svg323,750 [38]
5 Flag of the United States.svg Microsoft
Decrease2.svg333,524.8
Flag of the United States.svg Berkshire Hathaway
Decrease2.svg336,014.5
Flag of the United States.svg ExxonMobil
Decrease2.svg304,245
Flag of the United States.svg ExxonMobil
Increase2.svg325,167
6 Flag of the People's Republic of China.svg Petro China
Increase2.svg329,715.1
Flag of the People's Republic of China.svg Petro China
Decrease2.svg319,391.6
Flag of the United States.svg Johnson & Johnson
Decrease2.svg257,637
Flag of the United States.svg Amazon
Increase2.svg323,009
7 Flag of the United States.svg Wells Fargo
Decrease2.svg279,919.7
Flag of the People's Republic of China.svg ICBC
Increase2.svg298,531.5
Flag of the United States.svg General Electric
Decrease2.svg248,069
Flag of the United States.svg General Electric
Increase2.svg313,892
8 Flag of the United States.svg Johnson & Johnson
Decrease2.svg279,723.9
Flag of the United States.svg Wells Fargo
Increase2.svg289,591.3
Flag of the People's Republic of China.svg China Mobile
Increase2.svg243,186
Flag of the United States.svg Johnson & Johnson
Increase2.svg287,153
9 Flag of the People's Republic of China.svg ICBC
Increase2.svg275,389.1
Flag of the United States.svg Johnson & Johnson
Decrease2.svg270,260.8
Flag of Switzerland (Pantone).svg Novartis
Increase2.svg240,373
Flag of the United States.svg Wells Fargo
Increase2.svg281,770
10 Flag of Switzerland (Pantone).svg Novartis
Increase2.svg267,897.0
Flag of the United States.svg General Electric
Increase2.svg267,717.4
Flag of Switzerland (Pantone).svg Nestlé
Increase2.svg233,361
Flag of the United States.svg JPMorgan Chase
Increase2.svg245,126

2014

This Financial Times –based list is up to date as of December 31,2014. Indicated changes in market value are relative to the previous quarter.

RankFirst quarter [68] Second quarter [69] Third quarter [70] Fourth quarter [71]
1 Flag of the United States.svg Apple
Decrease2.svg478,766.1
Flag of the United States.svg Apple
Increase2.svg560,337.4
Flag of the United States.svg Apple
Increase2.svg603,277.4
Flag of the United States.svg Apple
Increase2.svg647,361.0
2 Flag of the United States.svg ExxonMobil
Decrease2.svg422,098.3
Flag of the United States.svg ExxonMobil
Increase2.svg432,357.3
Flag of the United States.svg ExxonMobil
Decrease2.svg401,094.1
Flag of the United States.svg ExxonMobil
Decrease2.svg391,481.9
3 Flag of the United States.svg Microsoft
Increase2.svg340,216.8
Flag of the United States.svg Google
Increase2.svg358,347.3
Flag of the United States.svg Microsoft
Increase2.svg381,959.7
Flag of the United States.svg Microsoft
Increase2.svg382,880.3
4 Flag of the United States.svg Google
Increase2.svg313,003.9
Flag of the United States.svg Microsoft
Increase2.svg344,458.8
Flag of the United States.svg Google
Increase2.svg361,998.4
Flag of the United States.svg Berkshire Hathaway
Increase2.svg370,652.6
5 Flag of the United States.svg Berkshire Hathaway
Increase2.svg308,090.6
Flag of the United States.svg Berkshire Hathaway
Increase2.svg312,216.7
Flag of the United States.svg Berkshire Hathaway
Increase2.svg340,055.0
Flag of the United States.svg Google
Decrease2.svg329,768.5
6 Flag of the United States.svg Johnson & Johnson
Increase2.svg277,826.2
Flag of the United States.svg Johnson & Johnson
Increase2.svg295,980.1
Flag of the United States.svg Johnson & Johnson
Increase2.svg300,614.2
Flag of the People's Republic of China.svg PetroChina
Increase2.svg305,536.1
7 Flag of the United States.svg Wells Fargo
Increase2.svg261,217.5
Flag of the United States.svg Wells Fargo
Increase2.svg276,837
Flag of the United States.svg Wells Fargo
Increase2.svg270,782.4
Flag of the United States.svg Johnson & Johnson
Decrease2.svg292,702.8
8 Flag of the United States.svg General Electric
Decrease2.svg259,547.3
Flag of the Netherlands.svg
Flag of the United Kingdom.svg
Royal Dutch Shell
Increase2.svg269,563.4
Flag of the United States.svg General Electric
Decrease2.svg257,068.4
Flag of the United States.svg Wells Fargo
Increase2.svg284,385.6
9 Flag of Switzerland (Pantone).svg Hoffmann-La Roche
Increase2.svg258,542.1
Flag of the United States.svg General Electric
Increase2.svg263,529.6
Flag of Switzerland (Pantone).svg Novartis
Increase2.svg255,326.4
Flag of the United States.svg Walmart
Decrease2.svg276,807.4
10 Flag of the United States.svg Walmart
Decrease2.svg246,805.7
Flag of Switzerland (Pantone).svg Hoffmann-La Roche
Decrease2.svg256,322.8
Flag of Switzerland (Pantone).svg Hoffmann-La Roche
Decrease2.svg254,543.8
Flag of the People's Republic of China.svg ICBC
Increase2.svg271,146.1

2013

This Financial Times –based list is up to date as of 31 December 2013. Indicated changes in market value are relative to the previous quarter.

RankFirst quarter [72] Second quarter [73] Third quarter [74] Fourth quarter [75]
1 Flag of the United States.svg Apple
Decrease2.svg415,683.3
Flag of the United States.svg ExxonMobil
Decrease2.svg401,729.8
Flag of the United States.svg Apple
Increase2.svg433,099.6
Flag of the United States.svg Apple
Increase2.svg504,770.8
2 Flag of the United States.svg ExxonMobil
Increase2.svg403,733.1
Flag of the United States.svg Apple
Decrease2.svg372,202.3
Flag of the United States.svg ExxonMobil
Decrease2.svg378,716.2
Flag of the United States.svg ExxonMobil
Increase2.svg442,142.8
3 Flag of the United States.svg Berkshire Hathaway
Increase2.svg256,801.8
Flag of the United States.svg Microsoft
Increase2.svg288,488.8
Flag of the United States.svg Berkshire Hathaway
Increase2.svg280,001.5
Flag of the United States.svg Microsoft
Increase2.svg312,297.3
4 Flag of the People's Republic of China.svg PetroChina
Decrease2.svg254,618.7
Flag of the United States.svg Berkshire Hathaway
Increase2.svg276,548.5
Flag of the United States.svg Microsoft
Decrease2.svg277,220.9
Flag of the United States.svg Google
Increase2.svg310,079.1
5 Flag of the United States.svg Walmart
Increase2.svg246,373.3
Flag of the United States.svg Walmart
Decrease2.svg244,079.4
Flag of the United States.svg Johnson & Johnson
Increase2.svg244,298.5
Flag of the United States.svg Berkshire Hathaway
Increase2.svg292,396.0
6 Flag of the United States.svg General Electric
Increase2.svg239,775.6
Flag of the United States.svg Johnson & Johnson
Increase2.svg241,170.9
Flag of the United States.svg General Electric
Increase2.svg243,290.4
Flag of the United States.svg General Electric
Increase2.svg283,589.8
7 Flag of the United States.svg Microsoft
Increase2.svg239,602.3
Flag of the United States.svg General Electric
Increase2.svg239,787.2
Flag of the United States.svg Walmart
Decrease2.svg240,773.3
Flag of the United States.svg Johnson & Johnson
Increase2.svg258,415.4
8 Flag of the United States.svg IBM
Increase2.svg237,724.7
Flag of the United States.svg Google
Increase2.svg238,688.6
Flag of the United States.svg Google
Decrease2.svg237,479.4
Flag of the United States.svg Walmart
Increase2.svg254,622.8
9 Flag of Switzerland (Pantone).svg Nestlé
Increase2.svg233,792.1
Flag of the United States.svg Chevron Corporation
Decrease2.svg229,402.6
Flag of the United States.svg Chevron Corporation
Increase2.svg234,740.8
Flag of Switzerland (Pantone).svg Hoffmann-La Roche
Increase2.svg241,368.0
10 Flag of the United States.svg Chevron Corporation
Increase2.svg230,831.2
Flag of the People's Republic of China.svg ICBC
Increase2.svg226,879.8
Flag of Switzerland (Pantone).svg Hoffmann-La Roche
Increase2.svg232,495.2
Flag of the United States.svg Chevron Corporation
Increase2.svg240,223.4

2012

This Financial Times –based list is up to date as of 31 December 2012. Indicated changes in market value are relative to the previous quarter.

RankFirst quarter [76] Second quarter [77] Third quarter [78] Fourth quarter [79]
1 Flag of the United States.svg Apple
Increase2.svg559,002.1
Flag of the United States.svg Apple
Decrease2.svg546,076.1
Flag of the United States.svg Apple
Increase2.svg625,348.1
Flag of the United States.svg Apple
Decrease2.svg500,610.7
2 Flag of the United States.svg ExxonMobil
Increase2.svg408,777.4
Flag of the United States.svg ExxonMobil
Decrease2.svg400,139.1
Flag of the United States.svg ExxonMobil
Increase2.svg422,127.5
Flag of the United States.svg ExxonMobil
Decrease2.svg394,610.9
3 Flag of the People's Republic of China.svg PetroChina
Increase2.svg278,968.4
Flag of the People's Republic of China.svg PetroChina
Decrease2.svg257,685.8
Flag of the People's Republic of China.svg PetroChina
Decrease2.svg253,853.3
Flag of the People's Republic of China.svg PetroChina
Increase2.svg264,833.4
4 Flag of the United States.svg Microsoft
Increase2.svg270,644.1
Flag of the United States.svg Microsoft
Decrease2.svg256,982.4
Flag of the United States.svg Microsoft
Decrease2.svg249,489.8
Flag of Australia (converted).svg
Flag of the United Kingdom.svg
BHP Billiton
Increase2.svg247,409.0
5 Flag of the United States.svg IBM
Increase2.svg241,754.6
Flag of the United States.svg Walmart
Increase2.svg235,900.3
Flag of the United States.svg Walmart
Increase2.svg248,074.4
Flag of the People's Republic of China.svg ICBC
Increase2.svg236,457.9
6 Flag of the People's Republic of China.svg ICBC
Increase2.svg236,335.4
Flag of the United States.svg IBM
Decrease2.svg225,598.5
Flag of the United States.svg General Electric
Increase2.svg239,791.2
Flag of the People's Republic of China.svg China Mobile
Increase2.svg234,040.2
7 Flag of the Netherlands.svg
Flag of the United Kingdom.svg
Royal Dutch Shell
Decrease2.svg222,425.1
Flag of the United States.svg General Electric
Increase2.svg220,806.3
Flag of the United States.svg IBM
Increase2.svg237,068.4
Flag of the United States.svg Walmart
Decrease2.svg228,245.4
8 Flag of the People's Republic of China.svg China Mobile
Increase2.svg220,978.9
Flag of the People's Republic of China.svg China Mobile
Decrease2.svg219,481.3
Flag of the United States.svg Chevron Corporation
Increase2.svg228,707.1
Flag of South Korea.svg Samsung Electronics
Increase2.svg227,581.8
9 Flag of the United States.svg General Electric
Increase2.svg212,317.7
Flag of the Netherlands.svg
Flag of the United Kingdom.svg
Royal Dutch Shell
Decrease2.svg217,048.2
Flag of the People's Republic of China.svg China Mobile
Increase2.svg222,817.8
Flag of the United States.svg Microsoft
Decrease2.svg224,801.0
10 Flag of the United States.svg Chevron Corporation
Increase2.svg211,950.6
Flag of the People's Republic of China.svg ICBC
Decrease2.svg211,196.0
Flag of the Netherlands.svg
Flag of the United Kingdom.svg
Royal Dutch Shell
Increase2.svg222,669.6
Flag of the Netherlands.svg
Flag of the United Kingdom.svg
Royal Dutch Shell
Steady2.svg222,669.6

2011

This Financial Times –based list is up to date as of 31 December 2011. Indicated changes in market value are relative to the previous quarter.

RankFirst quarter [80] Second quarter [81] Third quarter [82] Fourth quarter [83]
1 Flag of the United States.svg ExxonMobil
Increase2.svg417,166.7
Flag of the United States.svg ExxonMobil
Decrease2.svg400,884.5
Flag of the United States.svg Apple
Increase2.svg353,518.1
Flag of the United States.svg ExxonMobil
Increase2.svg406,272.1
2 Flag of the People's Republic of China.svg PetroChina
Increase2.svg326,199.2
Flag of the United States.svg Apple
Decrease2.svg310,412.3
Flag of the United States.svg ExxonMobil
Decrease2.svg353,135.2
Flag of the United States.svg Apple
Increase2.svg376,410.6
3 Flag of the United States.svg Apple
Increase2.svg321,072.1
Flag of the People's Republic of China.svg PetroChina
Decrease2.svg303,649.9
Flag of the People's Republic of China.svg PetroChina
Decrease2.svg276,473.9
Flag of the People's Republic of China.svg PetroChina
Increase2.svg276,844.9
4 Flag of the People's Republic of China.svg ICBC
Increase2.svg251,078.1
Flag of the People's Republic of China.svg ICBC
Decrease2.svg246,850.5
Flag of the United States.svg IBM
Increase2.svg208,843.5
Flag of the Netherlands.svg
Flag of the United Kingdom.svg
Royal Dutch Shell
Increase2.svg236,677.0
5 Flag of Brazil.svg Petrobras
Increase2.svg247,417.6
Flag of Australia (converted).svg
Flag of the United Kingdom.svg
BHP Billiton
Decrease2.svg233,626.5
Flag of the United States.svg Microsoft
Decrease2.svg208,534.9
Flag of the People's Republic of China.svg ICBC
Increase2.svg228,168.1
6 Flag of Australia (converted).svg
Flag of the United Kingdom.svg
BHP Billiton
Increase2.svg247,079.5
Flag of the Netherlands.svg
Flag of the United Kingdom.svg
Royal Dutch Shell
Decrease2.svg225,122.8
Flag of the People's Republic of China.svg ICBC
Decrease2.svg206,021.4
Flag of the United States.svg Microsoft
Increase2.svg218,380.1
7 Flag of the People's Republic of China.svg China Construction Bank
Increase2.svg232,608.6
Flag of the United States.svg Microsoft
Increase2.svg219,251.9
Flag of the People's Republic of China.svg China Mobile
Increase2.svg198,778.7
Flag of the United States.svg IBM
Increase2.svg216,724.4
8 Flag of the Netherlands.svg
Flag of the United Kingdom.svg
Royal Dutch Shell
Increase2.svg226,128.7
Flag of Switzerland (Pantone).svg Nestlé
Increase2.svg215,017.5
Flag of the Netherlands.svg
Flag of the United Kingdom.svg
Royal Dutch Shell
Decrease2.svg197,061.1
Flag of the United States.svg Chevron Corporation
Increase2.svg211,893.9
9 Flag of the United States.svg Chevron Corporation
Increase2.svg215,780.6
Flag of Brazil.svg Petrobras
Decrease2.svg210,111.4
Flag of Switzerland (Pantone).svg Nestlé
Decrease2.svg191,115.6
Flag of the United States.svg Walmart
Increase2.svg204,659.8
10 Flag of the United States.svg Microsoft
Decrease2.svg213,336.4
Flag of the United States.svg IBM
Increase2.svg207,781.4
Flag of the United States.svg Chevron Corporation
Decrease2.svg185,456.1
Flag of the People's Republic of China.svg China Mobile
Decrease2.svg196,148.4

2010

This Financial Times –based list is up to date as of 31 December 2010. Indicated changes in market value are relative to the previous quarter.

RankFirst quarter [84] Second quarter [85] Third quarter [86] Fourth quarter [87]
1 Flag of the People's Republic of China.svg PetroChina
Decrease2.svg329,259.7
Flag of the United States.svg ExxonMobil
Decrease2.svg291,789.1
Flag of the United States.svg ExxonMobil
Increase2.svg314,622.5
Flag of the United States.svg ExxonMobil
Increase2.svg368,711.5
2 Flag of the United States.svg ExxonMobil
Decrease2.svg316,230.8
Flag of the People's Republic of China.svg PetroChina
Decrease2.svg268,504.8
Flag of the People's Republic of China.svg PetroChina
Increase2.svg270,889.9
Flag of the People's Republic of China.svg PetroChina
Increase2.svg303,273.6
3 Flag of the United States.svg Microsoft
Decrease2.svg256,864.7
Flag of the United States.svg Apple
Increase2.svg228,876.8
Flag of the United States.svg Apple
Increase2.svg259,223.4
Flag of the United States.svg Apple
Increase2.svg295,886.3
4 Flag of the People's Republic of China.svg ICBC
Decrease2.svg246,419.8
Flag of the People's Republic of China.svg ICBC
Decrease2.svg211,258.7
Flag of Brazil.svg Petrobras
Increase2.svg220,616.5
Flag of Australia (converted).svg
Flag of the United Kingdom.svg
BHP Billiton
Increase2.svg243,540.3
5 Flag of the United States.svg Apple
Increase2.svg213,096.7
Flag of the United States.svg Microsoft
Decrease2.svg201,655.8
Flag of the People's Republic of China.svg ICBC
Increase2.svg213,364.1
Flag of the United States.svg Microsoft
Increase2.svg238,784.5
6 Flag of Australia (converted).svg
Flag of the United Kingdom.svg
BHP Billiton
Increase2.svg209,935.1
Flag of the People's Republic of China.svg China Mobile
Increase2.svg201,471.2
Flag of the United States.svg Microsoft
Increase2.svg210,676.4
Flag of the People's Republic of China.svg ICBC
Increase2.svg233,369.1
7 Flag of the United States.svg Walmart
Increase2.svg209,000.7
Flag of the United States.svg Berkshire Hathaway
Decrease2.svg197,356.8
Flag of the People's Republic of China.svg China Mobile
Increase2.svg205,339.6
Flag of Brazil.svg Petrobras
Increase2.svg229,066.6
8 Flag of the United States.svg Berkshire Hathaway
Increase2.svg200,620.5
Flag of the People's Republic of China.svg China Construction Bank
Increase2.svg189,170.7
Flag of the United States.svg Berkshire Hathaway
Increase2.svg204,792.0
Flag of the People's Republic of China.svg China Construction Bank
Increase2.svg222,245.1
9 Flag of the United States.svg General Electric
Increase2.svg194,246.2
Flag of the United States.svg Walmart
Decrease2.svg178,322.7
Flag of the People's Republic of China.svg China Construction Bank
Increase2.svg202,998.4
Flag of the Netherlands.svg
Flag of the United Kingdom.svg
Royal Dutch Shell
Increase2.svg208,593.7
10 Flag of the People's Republic of China.svg China Mobile
Increase2.svg192,998.6
Flag of the United States.svg Procter & Gamble
172,736.5
Flag of Australia (converted).svg
Flag of the United Kingdom.svg
BHP Billiton
Increase2.svg196,866.0
Flag of Switzerland (Pantone).svg Nestlé
Increase2.svg203,534.3

2009

This Financial Times –based list is up to date as of 31 December 2009. Indicated changes in market value are relative to the previous quarter.

RankFirst quarter [88] Second quarter [89] Third quarter [90] Fourth quarter [91]
1 Flag of the United States.svg ExxonMobil
Decrease2.svg336,527
Flag of the People's Republic of China.svg PetroChina
Increase2.svg366,662.9
Flag of the United States.svg ExxonMobil
Decrease2.svg329,725
Flag of the People's Republic of China.svg PetroChina
Increase2.svg353,140.1
2 Flag of the People's Republic of China.svg PetroChina
Increase2.svg287,185
Flag of the United States.svg ExxonMobil
Increase2.svg341,140.3
Flag of the People's Republic of China.svg PetroChina
Decrease2.svg325,097.5
Flag of the United States.svg ExxonMobil
Decrease2.svg323,717.1
3 Flag of the United States.svg Walmart
Decrease2.svg204,365
Flag of the People's Republic of China.svg ICBC
Increase2.svg257,004.4
Flag of the People's Republic of China.svg ICBC
Decrease2.svg237,951.5
Flag of the United States.svg Microsoft
Increase2.svg270,635.4
4 Flag of the People's Republic of China.svg ICBC
Increase2.svg187,885
Flag of the United States.svg Microsoft
Increase2.svg211,546.2
Flag of the United States.svg Microsoft
Increase2.svg229,630.7
Flag of the People's Republic of China.svg ICBC
Increase2.svg268,956.2
5 Flag of the People's Republic of China.svg China Mobile
Decrease2.svg174,673
Flag of the People's Republic of China.svg China Mobile
Increase2.svg200,832.4
Flag of the United Kingdom.svg HSBC
Increase2.svg198,561.1
Flag of the United States.svg Walmart
Increase2.svg203,653.6
6 Flag of the United States.svg Microsoft
Decrease2.svg163,320
Flag of the United States.svg Walmart
Decrease2.svg188,752.0
Flag of the People's Republic of China.svg China Mobile
Decrease2.svg195,680.4
Flag of the People's Republic of China.svg China Construction Bank
Increase2.svg201,436.1
7 Flag of the United States.svg AT&T
Decrease2.svg148,511
Flag of the People's Republic of China.svg China Construction Bank
Increase2.svg182,186.7
Flag of the United States.svg Walmart
Increase2.svg189,331.6
Flag of Australia (converted).svg
Flag of the United Kingdom.svg
BHP Billiton
Increase2.svg201,248
8 Flag of the United States.svg Johnson & Johnson
Decrease2.svg145,481
Flag of Brazil.svg Petrobras
Increase2.svg165,056.9
Flag of Brazil.svg Petrobras
Increase2.svg189,027.7
Flag of the United Kingdom.svg HSBC
Increase2.svg199,254.9
9 Flag of the Netherlands.svg
Flag of the United Kingdom.svg
Royal Dutch Shell
Decrease2.svg138,999
Flag of the United States.svg Johnson & Johnson
Increase2.svg156,515.9
Flag of the People's Republic of China.svg China Construction Bank
Increase2.svg186,816.7
Flag of Brazil.svg Petrobras
Increase2.svg199,107.9
10 Flag of the United States.svg Procter & Gamble
Decrease2.svg138,013
Flag of the Netherlands.svg
Flag of the United Kingdom.svg
Royal Dutch Shell
Increase2.svg156,386.7
Flag of the Netherlands.svg
Flag of the United Kingdom.svg
Royal Dutch Shell
Increase2.svg175,986.1
Flag of the United States.svg Apple
Increase2.svg189,801.7

2008

This Financial Times –based list is up to date as of 31 December 2008. Indicated changes in market value are relative to the previous quarter.

RankFirst quarter [92] Second quarter [93] Third quarter [94] Fourth quarter [95]
1 Flag of the United States.svg ExxonMobil
Decrease2.svg452,505
Flag of the United States.svg ExxonMobil
Increase2.svg465,652
Flag of the United States.svg ExxonMobil
Increase2.svg403,366
Flag of the United States.svg ExxonMobil
Increase2.svg406,067
2 Flag of the People's Republic of China.svg PetroChina
Decrease2.svg423,996
Flag of the People's Republic of China.svg PetroChina
Increase2.svg341,140.3
Flag of the People's Republic of China.svg PetroChina
Decrease2.svg325,097.5
Flag of the People's Republic of China.svg PetroChina
Decrease2.svg259,836
3 Flag of the United States.svg General Electric
Decrease2.svg369,569
Flag of the People's Republic of China.svg ICBC
Increase2.svg257,004.4
Flag of the People's Republic of China.svg ICBC
Decrease2.svg237,951.5
Flag of the United States.svg Walmart
Decrease2.svg219,898
4 Flag of Russia.svg Gazprom
Decrease2.svg299,764
Flag of the United States.svg Microsoft
Increase2.svg211,546.2
Flag of the United States.svg Microsoft
Increase2.svg229,630.7
Flag of the People's Republic of China.svg China Mobile
Increase2.svg201,291
5 Flag of the People's Republic of China.svg China Mobile
Decrease2.svg298,093
Flag of the People's Republic of China.svg China Mobile
Increase2.svg200,832.4
Flag of the United Kingdom.svg HSBC
Increase2.svg198,561.1
Flag of the United States.svg Procter & Gamble
Decrease2.svg184,576
6 Flag of the People's Republic of China.svg ICBC
Decrease2.svg277,236
Flag of the United States.svg Walmart
Decrease2.svg188,752.0
Flag of the People's Republic of China.svg China Mobile
Decrease2.svg195,680.4
Flag of the People's Republic of China.svg ICBC
Decrease2.svg173,930
7 Flag of the United States.svg Microsoft
Decrease2.svg264,132
Flag of the People's Republic of China.svg China Construction Bank
Increase2.svg182,186.7
Flag of the United States.svg Walmart
Increase2.svg189,331.6
Flag of the United States.svg Microsoft
Decrease2.svg172,929
8 Flag of the United States.svg AT&T
Decrease2.svg231,168
Flag of Brazil.svg Petrobras
Increase2.svg165,056.9
Flag of Brazil.svg Petrobras
Increase2.svg189,027.7
Flag of the United States.svg AT&T
Increase2.svg167,950
9 Flag of the Netherlands.svg
Flag of the United Kingdom.svg
Royal Dutch Shell
Decrease2.svg220,110
Flag of the United States.svg Johnson & Johnson
Increase2.svg156,515.9
Flag of the People's Republic of China.svg China Construction Bank
Increase2.svg186,816.7
Flag of the United States.svg Johnson & Johnson
Decrease2.svg166,002
10 Flag of the United States.svg Procter & Gamble
Decrease2.svg215,640
Flag of the Netherlands.svg
Flag of the United Kingdom.svg
Royal Dutch Shell
Increase2.svg156,386.7
Flag of the Netherlands.svg
Flag of the United Kingdom.svg
Royal Dutch Shell
Increase2.svg175,986.1
Flag of the United States.svg General Electric
Decrease2.svg161,278

2007

This Financial Times –based list is up to date as of 31 December 2007. Indicated changes in market value are relative to the previous quarter.

RankFirst quarter [96] Second quarter [97] Third quarter [98] Fourth quarter [99]
1 Flag of the United States.svg ExxonMobil
Decrease2.svg429,567
Flag of the United States.svg ExxonMobil
Increase2.svg472,519
Flag of the United States.svg ExxonMobil
Increase2.svg513,362
Flag of the People's Republic of China.svg Petrochina
Increase2.svg723,952
2 Flag of the United States.svg General Electric
Decrease2.svg363,611
Flag of the United States.svg General Electric
Increase2.svg393,831
Flag of the United States.svg General Electric
Increase2.svg424,191
Flag of the United States.svg ExxonMobil
Decrease2.svg511,887
3 Flag of the United States.svg Microsoft
Decrease2.svg272,912
Flag of the United States.svg Microsoft
Increase2.svg281,934
Flag of the People's Republic of China.svg China Mobile
Increase2.svg327,937
Flag of the United States.svg General Electric
Decrease2.svg374,637
4 Flag of the United States.svg Citigroup
Decrease2.svg252,857
Flag of the Netherlands.svg
Flag of the United Kingdom.svg
Royal Dutch Shell
Increase2.svg266,141
Flag of the People's Republic of China.svg ICBC
Increase2.svg279,269
Flag of the People's Republic of China.svg China Mobile
Increase2.svg354,120
5 Flag of the United States.svg AT&T
Increase2.svg246,206
Flag of the United States.svg AT&T
Increase2.svg255,871
Flag of the United States.svg Microsoft
Decrease2.svg276,202
Flag of the People's Republic of China.svg ICBC
Increase2.svg338,989
6 Flag of Russia.svg Gazprom
Decrease2.svg245,911
Flag of the United States.svg Citigroup
Increase2.svg253,703
Flag of the Netherlands.svg
Flag of the United Kingdom.svg
Royal Dutch Shell
Decrease2.svg264,397
Flag of the United States.svg Microsoft
Increase2.svg333,054
7 Flag of Japan.svg Toyota
Decrease2.svg230,832
Flag of Russia.svg Gazprom
Decrease2.svg245,757
Flag of Russia.svg Gazprom
Increase2.svg260,249
Flag of Russia.svg Gazprom
Increase2.svg329,591
8 Flag of the United States.svg Bank of America
Decrease2.svg228,177
Flag of the United Kingdom.svg BP
Increase2.svg231,491
Flag of the United States.svg AT&T
Increase2.svg258,047
Flag of the Netherlands.svg
Flag of the United Kingdom.svg
Royal Dutch Shell
Increase2.svg269,544
9 Flag of the People's Republic of China.svg ICBC
Decrease2.svg224,788
Flag of Japan.svg Toyota
Decrease2.svg228,009
Flag of the United States.svg Citigroup
Decrease2.svg232,162
Flag of the United States.svg AT&T
Decrease2.svg252,051
10 Flag of the Netherlands.svg
Flag of the United Kingdom.svg
Royal Dutch Shell
Decrease2.svg214,018
Flag of the United States.svg Bank of America
Decrease2.svg216,963
Flag of the United States.svg Bank of America
Increase2.svg223,066
Flag of the People's Republic of China.svg Sinopec
Increase2.svg249,645

2006

This Financial Times –based list is up to date as of December 2006. Indicated changes in market value are relative to the previous quarter.

RankFirst quarter [100] Second quarter [101] Third quarter [102] Fourth quarter [103]
1 Flag of the United States.svg ExxonMobil
Increase2.svg371,631
Flag of the United States.svg ExxonMobil
Decrease2.svg371,187
Flag of the United States.svg ExxonMobil
Increase2.svg398,906
Flag of the United States.svg ExxonMobil
Increase2.svg446,943
2 Flag of the United States.svg General Electric
Decrease2.svg362,527
Flag of the United States.svg General Electric
Decrease2.svg342,731
Flag of the United States.svg General Electric
Increase2.svg364,414
Flag of the United States.svg General Electric
Increase2.svg383,564
3 Flag of the United States.svg Microsoft
Increase2.svg281,171
Flag of Russia.svg Gazprom
Increase2.svg246,341
Flag of the United States.svg Microsoft
Increase2.svg272,679.0
Flag of the United States.svg Microsoft
Increase2.svg293,537
4 Flag of the United States.svg Citigroup
Decrease2.svg238,935
Flag of the United States.svg Citigroup
Increase2.svg239,862
Flag of Russia.svg Gazprom
Decrease2.svg254,634.3
Flag of the United States.svg Citigroup
Increase2.svg273,691
5 Flag of the United Kingdom.svg BP
Increase2.svg233,260
Flag of the United States.svg Microsoft
Decrease2.svg237,688
Flag of the United States.svg Citigroup
Increase2.svg246,727
Flag of Russia.svg Gazprom
Increase2.svg271,482
6 Flag of the United States.svg Bank of America
Increase2.svg211,706
Flag of the United Kingdom.svg BP
Increase2.svg233,151
Flag of the United States.svg Bank of America
Increase2.svg242,451
Flag of the People's Republic of China.svg ICBC
Increase2.svg254,592
7 Flag of the Netherlands.svg
Flag of the United Kingdom.svg
Royal Dutch Shell
Increase2.svg211,280
Flag of the Netherlands.svg
Flag of the United Kingdom.svg
Royal Dutch Shell
Increase2.svg224,925
Flag of the Netherlands.svg
Flag of the United Kingdom.svg
Royal Dutch Shell
Decrease2.svg216,368
Flag of Japan.svg Toyota
Increase2.svg241,161
8 Flag of the United States.svg Walmart
Increase2.svg196,860
Flag of the United States.svg Bank of America
Increase2.svg219,504
Flag of the United Kingdom.svg BP
Decrease2.svg215,623
Flag of the United States.svg Bank of America
Decrease2.svg239,758
9 Flag of Japan.svg Toyota
Increase2.svg196,731
Flag of the United Kingdom.svg HSBC
Increase2.svg201,854
Flag of the United Kingdom.svg HSBC
Increase2.svg209,774
Flag of the Netherlands.svg
Flag of the United Kingdom.svg
Royal Dutch Shell
Increase2.svg225,781
10 Flag of Russia.svg Gazprom
Increase2.svg196,339
Flag of the United States.svg Walmart
Increase2.svg200,762
Flag of the United States.svg Pfizer
Increase2.svg206,785
Flag of the United Kingdom.svg BP
Increase2.svg218,643

2005

This Financial Times –This list is up to date as of 31 March 2005. [104]

RankNameCountryPrimary industryMarket value
(USD million)
1 General Electric United States Conglomerate Increase2.svg382,233
2 ExxonMobil United States Oil and gas Increase2.svg380,567
3 Microsoft United States Software industry Decrease2.svg262,975
4 Citigroup United States Banking Decrease2.svg234,437
5 BP United KingdomOil and gasIncrease2.svg221,365
6 Walmart United States Retail Decrease2.svg212,209
7 Royal Dutch Shell Netherlands

United Kingdom

Oil and gasIncrease2.svg210,630
8 Johnson & Johnson United States Health care Increase2.svg199,711
9 Pfizer United StatesHealth careDecrease2.svg195,945
10 Bank of America United StatesBankingIncrease2.svg178,765

2004

This Financial Times –based list is up to date as 31 March 2004. [105]

RankNameCountryPrimary industryMarket value (USD million)
1 General Electric United States Conglomerate Increase2.svg299,336
2 Microsoft United States Software industry Increase2.svg271,911
3 ExxonMobil United States Oil and gas Increase2.svg263,940
4 Pfizer United States Health care Increase2.svg261,616
5 Citigroup United States Banking Increase2.svg259,191
6 Walmart United States Retail Increase2.svg258,888
7 American International Group United States Insurance Increase2.svg183,696
8 Intel Corporation United States Computer hardware Increase2.svg179,996
9 BP United KingdomOil and gasIncrease2.svg174,648
10 HSBC United KingdomBankingIncrease2.svg163,574

2003

This Financial Times –based list is up to date as December 2003. [106]

RankNameCountryPrimary industryMarket value (USD million)
1 Microsoft United States Software industry Decrease2.svg264,003
2 General Electric United States Conglomerate Decrease2.svg259,647
3 ExxonMobil United States Oil and gas Decrease2.svg241,037
4 Walmart United States Retail Decrease2.svg234,399
5 Pfizer United States Health care Decrease2.svg195,948
6 Citigroup United States Banking Decrease2.svg183,887
7 Johnson & Johnson United StatesHealth careDecrease2.svg170,417
8 Royal Dutch Shell Netherlands

United Kingdom

Oil and gasDecrease2.svg149,034
9 BP United KingdomOil and gasDecrease2.svg144,381
10 IBM United StatesComputer software, computer hardware Increase2.svg139,272

2002

This Financial Times –based list is up to date December 2002. [107]

RankNameCountryPrimary industryMarket value (USD million)
1 General Electric United States Conglomerate Decrease2.svg372,089
2 Microsoft United States Software industry Increase2.svg326,639
3 ExxonMobil United States Oil and gas Increase2.svg299,820
4 Walmart United States Retail Increase2.svg273,220
5 Citigroup United States Banking Increase2.svg255,299
6 Pfizer United States Health care Decrease2.svg249,021
7 Intel Corporation United States Computer hardware Decrease2.svg203,838
8 BP United KingdomOil and gasDecrease2.svg200,794
9 Johnson & Johnson United StatesHealth careIncrease2.svg197,912
10 Royal Dutch Shell Netherlands

United Kingdom

Oil and gasDecrease2.svg189,913

2001

This Financial Times –based list is up to date as 31 March 2001. [108]

RankNameCountryPrimary industryMarket value (USD million)
1 General Electric United States Conglomerate Increase2.svg477,406
2 Cisco Systems United States Networking hardware Decrease2.svg304,699
3 ExxonMobil United States Oil and gas Increase2.svg286,367
4 Pfizer United States Health care 263,996
5 Microsoft United States Software industry Decrease2.svg258,436
6 Walmart United States Retail Decrease2.svg250,955
7 Citigroup United States Banking 250,143
8 Vodafone United Kingdom Telecommunications 227,175
9 Intel United States Computer hardware Decrease2.svg227,048
10 Royal Dutch Shell Netherlands

United Kingdom

Oil and gas206,340

2000

This Financial Times –based list is up to date as 31 March 2000. [109]

RankNameCountryPrimary industryMarket value (USD million)
1 Microsoft United States Software industry Decrease2.svg586,197
2 General Electric United States Conglomerate Decrease2.svg474,956
3 NTT Docomo Japan Telecommunications Increase2.svg366,204
4 Cisco Systems United States Networking hardware Decrease2.svg348,965
5 Walmart United States Retail Decrease2.svg286,153
6 Intel United States Computer hardware Increase2.svg277,096
7 Nippon Telegraph & Telephone JapanTelecommunicationsIncrease2.svg274,905
8 ExxonMobil United States Oil and gas Decrease2.svg265,894
9 Lucent United StatesTelecommunicationsIncrease2.svg237,668
10 Deutsche Telekom GermanyTelecommunicationsDecrease2.svg209,628

1999

The 10 largest companies in the world by market capitalization in 1999 [110]

RankNameCountryIndustryMarket value (USD million)
1 Microsoft United States Software industry Increase2.svg602,430
2 General Electric United States Conglomerate Increase2.svg507,220
3 Cisco Systems United States Computer hardware Increase2.svg357,110
4 Wal-Mart United States Retail Increase2.svg307,520
5 ExxonMobil United States Oil and gas Increase2.svg278,870
6 Intel United States Computer hardware Increase2.svg275,010
7 Nippon Telegraph & Telephone JapanTelecommunicationsIncrease2.svg272,050
8 Lucent United StatesTelecommunicationsIncrease2.svg227,990
9 Nokia FinlandTelecommunicationsIncrease2.svg218,990
10 Deutsche Telekom GermanyTelecommunicationsIncrease2.svg216,070

1998

This Financial Times–based list is up to date as of 30 September 1998. [111]

RankNameCountryPrimary industryMarket value
(USD million)
1 Microsoft United States Software Increase2.svg271,854
2 General Electric United States Conglomerate Increase2.svg258,871
3 ExxonMobil United States Oil and gas Increase2.svg172,213
4 Royal Dutch Shell Netherlands

United Kingdom

Oil and gasDecrease2.svg164,157
5 Merck United States Health care Increase2.svg154,753
6 Pfizer United StatesHealth careIncrease2.svg148,074
7 Intel United States Computer hardware Decrease2.svg144,060
8 The Coca-Cola Company United States Beverage Decrease2.svg142,164
9 Walmart United States Retail Increase2.svg123,062
10 IBM United StatesSoftware, computer hardwareIncrease2.svg121,184

1997

This Financial Times–based list is up to date as of 30 September 1997. [112]

RankNameCountryPrimary industryMarket value (USD million)
1 General Electric United States Conglomerate Increase2.svg222,748
2 Royal Dutch Shell Netherlands

United Kingdom

Oil and gas Increase2.svg191,002
3 Microsoft United States Software industry Increase2.svg159,660
4 ExxonMobil United StatesOil and gasIncrease2.svg157,970
5 The Coca-Cola Company United States Beverage Increase2.svg151,288
6 Intel United States Computer hardware Increase2.svg150,838
7 Nippon Telegraph & Telephone Japan Telecommunications Increase2.svg146,139
8 Merck United States Health care Increase2.svg120,757
9 Toyota Japan Automotive Increase2.svg116,585
10 Novartis SwitzerlandHealth careIncrease2.svg104,468

1996

This Financial Times–based list is up to date as of 30 September 1996. [113]

RankNameCountryPrimary industryMarket value (USD million)
1 General Electric United States Conglomerate 136,515
2 Royal Dutch Shell Netherlands

United Kingdom

Oil and gas 128,206
3 The Coca-Cola Company United States Beverage 117,258
4 Nippon Telegraph & Telephone Japan Telecommunications 113,609
5 ExxonMobil United StatesOil and gas102,161

See also

Notes

  1. Meta was formerly Facebook Inc. and traded as Facebook, Inc. at the time it first reached a $1tn capitalization
  2. On 5 November 2007, A shares of PetroChina ended their first day of trading after an IPO on the Shanghai Stock Exchange yielded a market cap of approximately $1 trillion. [30] Only 4 billion A shares were floated during the IPO, another 158 billion A shares were still held by China National Petroleum Corporation. 21.9 billion H shares were already floated on the Hong Kong Stock Exchange. [31] However, market capitalization based on H shares never reached $500 billion. [32]
  3. 1 2 3 4 5 6 7 8 9 Note that in case some companies with multiple classes of stock only one class is considered.

Related Research Articles

<span class="mw-page-title-main">Nasdaq</span> American stock exchange

The Nasdaq Stock Market ( is an American stock exchange based in New York City. It is the most active stock trading venue in the US by volume, and ranked second on the list of stock exchanges by market capitalization of shares traded, behind the New York Stock Exchange. The exchange platform is owned by Nasdaq, Inc., which also owns the Nasdaq Nordic stock market network and several U.S.-based stock and options exchanges.

<span class="mw-page-title-main">S&P 500</span> American stock market index

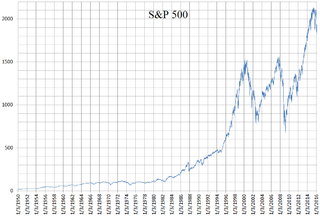
The Standard and Poor's 500, or simply the S&P 500, is a stock market index tracking the stock performance of 500 of the largest companies listed on stock exchanges in the United States. It is one of the most commonly followed equity indices and includes approximately 80% of the total market capitalization of U.S. public companies, with an aggregate market cap of more than $43 trillion as of January 2024.

<span class="mw-page-title-main">Toronto Stock Exchange</span> Stock exchange in Canada

The Toronto Stock Exchange is a stock exchange located in Toronto, Ontario, Canada. It is the 10th largest exchange in the world and the third largest in North America based on market capitalization. Based in the EY Tower in Toronto's Financial District, the TSX is a wholly owned subsidiary of the TMX Group for the trading of senior equities.

<span class="mw-page-title-main">Tata Consultancy Services</span> Indian multinational technology company

Tata Consultancy Services Limited (TCS) is an Indian multinational information technology (IT) services and consulting company headquartered in Mumbai. It is a part of the Tata Group and operates in 150 locations across 46 countries. In September 2023, it was reported that TCS had over 616,000 employees worldwide. TCS is the second-largest Indian company by market capitalization, the most valuable IT service brands worldwide, and the top Big Tech (India) company. As of June 2023, it was the world's second-largest user of U.S. H-1B visas.

<span class="mw-page-title-main">National debt of the United States</span> Worlds largest national debt

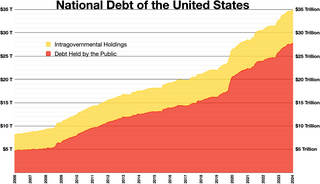
The national debt of the United States is the total national debt owed by the federal government of the United States to Treasury security holders. The national debt at any point in time is the face value of the then-outstanding Treasury securities that have been issued by the Treasury and other federal agencies. The terms "national deficit" and "national surplus" usually refer to the federal government budget balance from year to year, not the cumulative amount of debt. In a deficit year the national debt increases as the government needs to borrow funds to finance the deficit, while in a surplus year the debt decreases as more money is received than spent, enabling the government to reduce the debt by buying back some Treasury securities. In general, government debt increases as a result of government spending and decreases from tax or other receipts, both of which fluctuate during the course of a fiscal year. There are two components of gross national debt:

<span class="mw-page-title-main">State Bank of India</span> Indian public sector bank

State Bank of India (SBI) is an Indian multinational public sector bank and financial services statutory body headquartered in Mumbai, Maharashtra. SBI is the 48th largest bank in the world by total assets and ranked 221st in the Fortune Global 500 list of the world's biggest corporations of 2020, being the only Indian bank on the list. It is a public sector bank and the largest bank in India with a 23% market share by assets and a 25% share of the total loan and deposits market. It is also the tenth largest employer in India with nearly 250,000 employees. In 2023, the company’s seat in Forbes Global 2000 was 77.

<span class="mw-page-title-main">Bombay Stock Exchange</span> Indian stock exchange in Mumbai

BSE Limited, also known as the Bombay Stock Exchange (BSE), is an Indian stock exchange which is located on Dalal Street, known as the Wall Street of Mumbai, in turn described as the New York of India. Established in 1875 by cotton merchant Premchand Roychand, it is the oldest stock exchange in Asia, and also the tenth oldest in the world. The BSE is the world's 8th largest stock exchange with a market capitalization exceeding US$4.5 trillion as of January 2024.

<span class="mw-page-title-main">National Stock Exchange of India</span> Indian securities marketplace

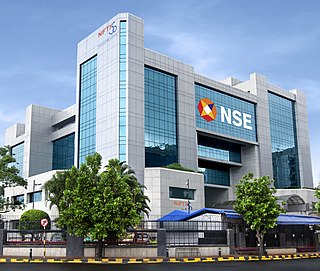
National Stock Exchange of India Limited (NSE) is one of the leading stock exchanges in India, based in Mumbai. NSE is under the ownership of various financial institutions such as banks and insurance companies. It is the world's largest derivatives exchange by number of contracts traded and the third largest in cash equities by number of trades for the calendar year 2022. It is the 7th largest stock exchange in the world by total market capitalization, as of January 2024. NSE's flagship index, the NIFTY 50, a 50 stock index is used extensively by investors in India and around the world as a barometer of the Indian capital market. The NIFTY 50 index was launched in 1996 by NSE.

<span class="mw-page-title-main">Wilshire 5000</span> Stock market index

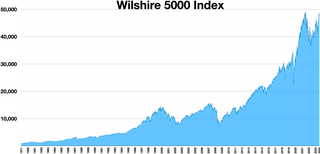
The Wilshire 5000 Total Market Index, or more simply the Wilshire 5000, is a market-capitalization-weighted index of the market value of all American stocks actively traded in the United States. As of December 31, 2023, the index contained 3,403 components. The index is intended to measure the performance of most publicly traded companies headquartered in the United States, with readily available price data. Hence, the index includes a majority of the common stocks and REITs traded primarily through New York Stock Exchange, NASDAQ, or the American Stock Exchange. Limited partnerships and ADRs are not included. It can be tracked by following the ticker ^FTW5000.

<span class="mw-page-title-main">KOSPI</span> Korean stock market index

The Korea Composite Stock Price Index or KOSPI (Korean: 한국종합주가지수) is the index of all common stocks traded on the Stock Market Division—previously, Korea Stock Exchange—of the Korea Exchange. It is the representative stock market index of South Korea, analogous to the S&P 500 in the United States.

<span class="mw-page-title-main">S&P/TSX Composite Index</span> Canadian stock market index

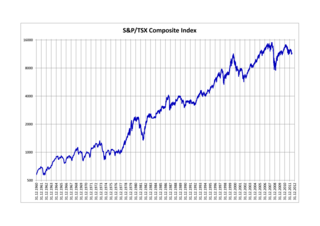
The S&P/TSX Composite Index is the benchmark Canadian index representing roughly 70% of the total market capitalization on the Toronto Stock Exchange (TSX). Having replaced the TSE 300 Composite Index on May 1, 2002, as of September 20, 2021 the S&P/TSX Composite Index comprises 237 of the 3,451 companies listed on the TSX. The index reached an all-time closing high of 21,768.53 on November 12, 2021 and an intraday record high of 21,796.16 on November 16, 2021.

The S&P/ASX 200 index is a market-capitalization weighted and float-adjusted stock market index of stocks listed on the Australian Securities Exchange. The index is maintained by Standard & Poor's and is considered the benchmark for Australian equity performance. It is based on the 200 largest ASX listed stocks, which together account for about 82% of Australia's share market capitalization.

<span class="mw-page-title-main">Swiss Market Index</span> Blue-chip stock market index of Switzerland

The Swiss Market Index (SMI) is Switzerland's blue-chip stock market index, which makes it the most followed in the country. It is made up of 20 of the largest and most liquid Swiss Performance Index (SPI) stocks. As a price index, the SMI is not adjusted for dividends.

The S&P SmallCap 600 Index is a stock market index established by S&P Global Ratings. It covers roughly the small-cap range of American stocks, using a capitalization-weighted index.

<span class="mw-page-title-main">Canadian petroleum companies</span>

Although there are numerous oil companies operating in Canada, as of 2009, the majority of production, refining and marketing was done by fewer than 20 of them. According to the 2013 edition of Forbes Global 2000, canoils.com and any other list that emphasizes market capitalization and revenue when sizing up companies, as of March 31, 2014 these are the largest Canada-based oil and gas companies.

<span class="mw-page-title-main">ITC Limited</span> Indian conglomerate

ITC Limited is an Indian company headquartered in Kolkata. ITC has a diversified presence across industries such as FMCG, hotels, software, packaging, paperboards, specialty papers and agribusiness. The company has 13 businesses in 5 segments. It exports its products in 90 countries. Its products are available in 6 million retail outlets.

<span class="mw-page-title-main">Unified Payments Interface</span> Indian instant payment system

Unified Payments Interface, commonly referred as UPI, is an Indian instant payment system developed by the National Payments Corporation of India (NPCI) in 2016. The interface facilitates inter-bank peer-to-peer (P2P) and person-to-merchant (P2M) transactions. It is used on mobile devices to instantly transfer funds between two bank accounts. The mobile number of the device is required to be registered with the bank. The UPI ID of the recipient can be used to transfer money. It runs as an open source application programming interface (API) on top of the Immediate Payment Service (IMPS), and is regulated by the Reserve Bank of India (RBI). Indian Banks started making their UPI-enabled apps available on the Google Play on 25 August 2016.

Big Tech, also known as the Tech Giants, are the largest information technology companies. The term most often refers to the Big Five tech companies in the United States: Alphabet (Google), Amazon, Apple, Meta, and Microsoft. The term can also include major Chinese technology companies, including the grouping of Baidu, Alibaba, Tencent, and Xiaomi (BATX). Big Tech can also include smaller tech companies with high valuations, such as Netflix and Nvidia, or non-tech companies with high-tech practices, such as the automaker Tesla. The concept of Big Tech is analogous to the consolidation of market dominance by a few companies in other market sectors, such as Goldman Sachs, Morgan Stanley, and J.P. Morgan in investment banking, the Big Three consulting firms, Big Oil, and Big Media.

Megacap stocks are stocks with a capitalization or market value over $200 billion. In business and investing the market capitalization term megacap stock is also referred to as mega-cap in the United States. The companies are the largest publicly traded companies in the world. Capitalization is the total value of the outstanding common shares owned by stockholders. Stocks under $200 billion are Large cap stocks. Megacap stocks are listed on the NASDAQ Capital Market or American Stock Exchange (AMEX). Market caps term may be different outside the United States.

References

  1. Grocer, Stephen (5 February 2019). "Biggest Public Company? Microsoft. Wait, Apple Again. Amazon? No, Back to Microsoft". The New York Times. ISSN   0362-4331. Archived from the original on 20 February 2022. Retrieved 20 February 2022.
  2. Investopedia Staff (7 January 2004). "Market Capitalization Defined". Investopedia. Archived from the original on 27 October 2018. Retrieved 30 May 2017.
  3. 1 2 "FT 500 2015 Introduction and methodology". Financial Times. 19 June 2015. Archived from the original on 2 September 2016. Retrieved 20 July 2015.
  4. "Companies ranked by Market Cap - CompaniesMarketCap.com". companiesmarketcap.com. Archived from the original on 14 April 2021. Retrieved 9 December 2021.
  5. Johnston, Louis; Williamson, Samuel H. (2023). "What Was the U.S. GDP Then?". MeasuringWorth. Retrieved 30 November 2023. United States Gross Domestic Product deflator figures follow the Measuring Worth series.
  6. Levy, Ari (25 April 2019). "Microsoft hits $1 trillion market cap for the first time as stock jumps on earnings beat". CNBC. Archived from the original on 30 November 2023. Retrieved 13 February 2024.
  7. Vlastelica, Ryan; Bass, Dina (22 June 2021). "Microsoft Rises to Join Apple in Exclusive $2 Trillion Club". Bloomberg L.P. Archived from the original on 22 June 2021. Retrieved 22 June 2021.
  8. Oguh, Chibuike (24 January 2024). "Microsoft hits $3 trillion market value, second to Apple". Reuters . Retrieved 26 January 2024.
  9. Grant, Charley (9 February 2024). "Microsoft Set a U.S. Market-Cap Record Today". The Wall Street Journal . Archived from the original on 10 February 2024. Retrieved 10 February 2024.
  10. Davies, Rob (2 August 2018). "Apple becomes world's first trillion-dollar company". TheGuardian.com . Archived from the original on 28 April 2020. Retrieved 3 November 2019.
  11. Popken, Ben (19 August 2020). "Apple just became the first U.S. Company worth $2 trillion". NBC News . Archived from the original on 19 August 2020. Retrieved 19 August 2020.
  12. Smith, Zachary Snowdon. "Apple Becomes 1st Company Worth $3 Trillion". Forbes . Archived from the original on 3 January 2022. Retrieved 3 January 2022.
  13. Randewich, Noel (13 December 2023). "Apple reaches record high close as Fed signals rate cuts". Reuters.
  14. "Saudi Aramco becomes most valuable listed company in history". The Guardian . 11 December 2019. Archived from the original on 13 October 2023. Retrieved 10 December 2022.
  15. Riley, Charles (12 December 2019). "The world has its first $2 trillion company. But for how long?". CNN Business . Archived from the original on 12 December 2019. Retrieved 10 December 2022.
  16. Wael, Salma (10 May 2022). "Saudi Aramco briefly becomes world's top-valued company as shares surge". Arab News . Archived from the original on 13 February 2024. Retrieved 13 February 2024.
  17. "Nvidia hits $1 trillion market cap". Yahoo! Finance . 30 May 2023. Archived from the original on 30 May 2023. Retrieved 30 May 2023.
  18. Saul, Derek (23 February 2024). "Nvidia Tops $2 Trillion Market Value For First Time Ever". Forbes . Retrieved 23 February 2024.
  19. Singh, Medha (8 March 2024). "Nvidia on cusp of overtaking Apple as second-most-valuable company". Reuters. Archived from the original on 8 March 2024. Retrieved 9 March 2024.
  20. Elias, Jennifer (16 January 2020). "Alphabet, Google's parent company, hits trillion-dollar market cap for first time". CNBC. Archived from the original on 30 October 2023. Retrieved 13 February 2024.
  21. Howley, Daniel (8 November 2021). "Google hits $2 trillion market cap, joining ranks of Microsoft and Apple". Yahoo! Finance . Archived from the original on 8 November 2021. Retrieved 8 November 2021.
  22. Baccardax, Martin (2 February 2022). "Google Crushes Q4 Earnings Forecast, Plans 20-For-1 Stock Split". TheStreet . Archived from the original on 13 February 2024. Retrieved 13 February 2024.
  23. DePillis, Lydia (4 September 2018). "Amazon is now worth $1,000,000,000,000". CNNMoney . Archived from the original on 31 January 2020. Retrieved 31 January 2020.
  24. Liu, Evie (20 December 2023). "Three Magnificent Seven Stocks Hit Record Highs This Past Month. Will the Others Follow?". Barron's . Archived from the original on 13 February 2024. Retrieved 13 February 2024.
  25. Joshi, Manas (11 November 2022). "Amazon loses USD 1 trillion, first company to shed such value". WION. Archived from the original on 13 February 2024. Retrieved 13 February 2024.
  26. Moon, Louise; Dodds, Io (28 June 2021). "Facebook joins $1 trillion club after antitrust win". The Daily Telegraph . Archived from the original on 13 February 2024. Retrieved 13 February 2024.
  27. Pelletier, Martin (12 February 2024). "Markets have turned into a one-trick pony — and that doesn't bode well". Financial Post . Archived from the original on 12 February 2024. Retrieved 13 February 2024.
  28. "Tesla breaches $1 trillion market cap". Reuters . 25 October 2021. Archived from the original on 25 October 2021. Retrieved 25 October 2021.
  29. Tully, Shawn (3 November 2021). "Tesla stock just made the biggest 12-day gain in the history of capital markets". Fortune . Archived from the original on 13 February 2024. Retrieved 13 February 2024.
  30. Wearden, Graeme (6 November 2007). "PetroChina makes its debut as world's first trillion-dollar firm". the Guardian. Archived from the original on 11 December 2019. Retrieved 12 December 2016.
  31. "PetroChina opens at 48.6 yuan per share in Shanghai debut, up 191%". Archived from the original on 7 November 2007.
  32. "Apple market value hits $601B". Yahoo Finance. 10 April 2012. Archived from the original on 27 February 2017. Retrieved 16 January 2017.
  33. 1 2 3 4 5 6 7 8 9 10 11 12 13 14 15 16 17 18 19 20 21 22 23 24 "Apple Market Cap". ycharts.com. Archived from the original on 15 May 2019. Retrieved 1 January 2019.
  34. 1 2 3 4 5 6 7 8 9 10 11 12 13 14 15 16 17 18 19 20 21 22 23 24 25 "Microsoft Market Cap". ycharts.com. Archived from the original on 23 October 2019. Retrieved 1 January 2019.
  35. 1 2 3 4 5 6 7 8 9 10 11 12 13 14 15 16 17 18 19 20 21 22 23 24 25 26 27 28 29 30 31 32 "Alphabet Market Cap (GOOG)". ycharts.com. Archived from the original on 5 March 2017. Retrieved 1 January 2019.
  36. 1 2 3 4 5 6 7 8 9 10 11 12 13 14 15 16 17 18 19 20 21 22 23 24 25 "Amazon.com Cap". ycharts.com. Archived from the original on 30 September 2019. Retrieved 1 January 2019.
  37. 1 2 3 4 5 6 7 "Nvidia Market Cap | NVDA". ycharts.com. Archived from the original on 27 May 2022. Retrieved 30 September 2021.
  38. 1 2 3 4 5 6 7 8 9 10 11 12 13 14 15 16 17 18 19 20 21 22 23 24 25 26 27 28 29 30 31 32 33 34 "Berkshire Hathaway". ycharts.com. Archived from the original on 9 April 2017. Retrieved 1 January 2019.
  39. 1 2 3 4 5 6 7 8 9 10 11 12 "Tesla Market Cap | TSLA". ycharts.com. Archived from the original on 20 February 2021. Retrieved 1 January 2021.
  40. 1 2 "Facebook Market Cap". ycharts.com. Archived from the original on 3 October 2022. Retrieved 3 October 2022.
  41. 1 2 3 4 5 6 7 8 9 10 11 12 13 14 15 16 17 18 19 20 21 "Facebook Market Cap". ycharts.com. Archived from the original on 24 August 2017. Retrieved 1 January 2019.
  42. 1 2 3 4 5 6 7 8 9 10 "Taiwan Semiconductor Manufacturing Market Cap | TSM". ycharts.com. Archived from the original on 8 October 2020. Retrieved 4 October 2020.
  43. 1 2 "Eli Lilly Market Cap". ycharts.com. Archived from the original on 4 November 2023. Retrieved 9 October 2023.
  44. 1 2 3 4 5 "Visa Market Cap". ycharts.com. Archived from the original on 2 October 2019. Retrieved 2 October 2019.
  45. 1 2 3 4 "UnitedHealth Group Market Cap". ycharts.com. Archived from the original on 15 March 2023. Retrieved 10 April 2022.
  46. 1 2 3 4 5 6 7 8 9 10 11 "Johnson & Johnson Market Cap". ycharts.com. Archived from the original on 31 March 2019. Retrieved 1 January 2019.
  47. "Exxon Mobil Market Cap". Archived from the original on 30 September 2019. Retrieved 1 July 2018.
  48. 1 2 3 4 5 6 7 8 9 10 11 12 13 14 15 16 17 18 "Tencent Holdings Market Cap". Archived from the original on 1 July 2018. Retrieved 1 January 2019.
  49. "Meta Platforms Market Cap". Archived from the original on 3 October 2022. Retrieved 3 October 2022.
  50. 1 2 3 4 5 6 7 8 9 10 11 12 13 14 15 16 "Alibaba Group Holding Market Cap (BABA)". ycharts.com. Archived from the original on 16 August 2017. Retrieved 1 January 2019.
  51. 1 2 3 4 5 6 7 "Visa Mobil Market Cap". Archived from the original on 2 October 2019. Retrieved 3 October 2019.
  52. 1 2 3 4 5 6 7 "JPMorgan Chase Market Cap". ycharts.com. Archived from the original on 31 March 2019. Retrieved 1 January 2019.
  53. 1 2 "Alphabet Inc. Market Cap Class A". ycharts.com. Archived from the original on 1 April 2019. Retrieved 1 January 2019.
  54. "Exxon Mobil Market Cap". Archived from the original on 30 September 2019. Retrieved 30 June 2018.
  55. "Financial Times FT500 2017-04-01". Archived from the original on 8 November 2017. Retrieved 8 April 2017.
  56. "Financial Times FT500 2017-06-30". Archived from the original on 8 November 2017. Retrieved 3 July 2017.
  57. "Financial Times FT500 2017-09-29". Archived from the original on 9 October 2017. Retrieved 9 October 2017.
  58. 1 2 "Tencent and Alibaba top Asia's market cap ranking in 2017". nikkei.com. Archived from the original on 19 September 2023. Retrieved 23 January 2018.
  59. "Financial Times FT500 2016-03-31". Archived from the original on 10 January 2020. Retrieved 28 April 2016.
  60. "Financial Times FT500 2016-06-16". Archived from the original on 8 November 2017. Retrieved 8 April 2017.
  61. "Financial Times FT500 2016-09-30". Archived from the original on 8 November 2017. Retrieved 8 April 2017.
  62. "Financial Times FT500 2016-12-31". Archived from the original on 8 November 2017. Retrieved 8 April 2017.
  63. "Financial Times". Archived from the original on 1 August 2016. Retrieved 21 June 2015.
  64. "Financial Times". Archived from the original on 3 August 2016. Retrieved 31 July 2015.
  65. "FT500". Archived from the original on 10 January 2020. Retrieved 14 September 2016.
  66. "FT500". Archived from the original on 15 December 2018. Retrieved 3 October 2016.
  67. 376,801.4 if unlisted classes of shares included, see http://im.ft-static.com/content/images/b2a77270-169d-11e5-b07f-00144feabdc0.xls Archived 3 August 2016 at the Wayback Machine
  68. "Financial Times". Archived from the original on 1 August 2016. Retrieved 4 July 2014.
  69. "Financial Times". Archived from the original on 3 August 2016. Retrieved 17 August 2014.
  70. "Financial Times". Archived from the original on 9 August 2019. Retrieved 8 October 2014.
  71. "Financial Times". Archived from the original on 3 August 2016. Retrieved 19 January 2015.
  72. "Financial Times" (PDF). Archived (PDF) from the original on 5 February 2020. Retrieved 20 June 2013.
  73. "Financial Times" (PDF). Archived (PDF) from the original on 13 July 2018. Retrieved 4 November 2013.
  74. "Financial Times" (PDF). Archived (PDF) from the original on 13 July 2018. Retrieved 4 November 2013.
  75. "Financial Times" (PDF). Archived (PDF) from the original on 15 January 2017. Retrieved 5 January 2014.
  76. "Financial Times" (PDF). Archived (PDF) from the original on 5 February 2020. Retrieved 16 August 2012.
  77. "Financial Times" (PDF). Archived (PDF) from the original on 6 November 2012. Retrieved 16 August 2012.
  78. "Financial Times" (PDF). Archived (PDF) from the original on 14 April 2020. Retrieved 19 October 2012.
  79. "Financial Times Global 500 December 2012" (PDF). Archived (PDF) from the original on 5 February 2020. Retrieved 30 January 2013.
  80. "Financial Times" (PDF). Archived (PDF) from the original on 11 March 2012. Retrieved 11 July 2011.
  81. "Financial Times" (PDF). Archived (PDF) from the original on 5 February 2020. Retrieved 9 August 2011.
  82. "Financial Times" (PDF). Archived (PDF) from the original on 14 April 2020. Retrieved 9 October 2011.
  83. "Financial Times" (PDF). Archived (PDF) from the original on 20 September 2018. Retrieved 19 January 2012.
  84. "Financial Times" (PDF). Archived (PDF) from the original on 11 October 2010. Retrieved 14 September 2010.
  85. "Financial Times" (PDF). Archived (PDF) from the original on 28 September 2010. Retrieved 14 September 2010.
  86. "Financial Times" (PDF). Archived (PDF) from the original on 15 December 2018. Retrieved 14 October 2010.
  87. "Financial Times" (PDF). Archived (PDF) from the original on 15 December 2018. Retrieved 8 January 2011.
  88. "Financial Times" (PDF). Archived (PDF) from the original on 29 December 2009. Retrieved 10 May 2009.
  89. "Financial Times" (PDF). Archived (PDF) from the original on 20 May 2011. Retrieved 3 August 2009.
  90. "Financial Times" (PDF). Archived (PDF) from the original on 25 July 2011. Retrieved 4 March 2010.
  91. "Financial Times" (PDF). Archived (PDF) from the original on 13 March 2010. Retrieved 4 March 2010.
  92. "Financial Times" (PDF). Archived (PDF) from the original on 10 September 2008. Retrieved 1 May 2008.
  93. "Financial Times" (PDF). Archived (PDF) from the original on 10 September 2008. Retrieved 16 July 2008.
  94. "Financial Times" (PDF). Archived (PDF) from the original on 5 February 2009. Retrieved 12 October 2008.
  95. "Financial Times" (PDF). Archived (PDF) from the original on 27 March 2009. Retrieved 25 January 2009.
  96. "Financial Times" (PDF). Archived (PDF) from the original on 23 July 2012. Retrieved 17 November 2007.
  97. "Financial Times" (PDF). Archived (PDF) from the original on 8 February 2012. Retrieved 17 November 2007.
  98. "Financial Times" (PDF). Archived (PDF) from the original on 8 February 2012. Retrieved 17 November 2007.
  99. "Financial Times" (PDF). Archived (PDF) from the original on 10 September 2008. Retrieved 1 May 2008.
  100. "Financial Times" (PDF). Archived (PDF) from the original on 10 September 2008. Retrieved 17 November 2007.
  101. "Financial Times" (PDF). Archived (PDF) from the original on 10 September 2008. Retrieved 17 November 2007.
  102. "Financial Times" (PDF). Archived (PDF) from the original on 23 July 2012. Retrieved 17 November 2007.
  103. "Financial Times" (PDF). Archived (PDF) from the original on 23 July 2012. Retrieved 17 November 2007.
  104. "Help - FT Help - FT.com What happened to Press Cuttings?" (PDF). specials.ft.com. Archived from the original (PDF) on 20 July 2008. Retrieved 17 November 2007.
  105. "FT.com / Search".[ permanent dead link ]
  106. "Help - FT Help - FT.com What happened to Press Cuttings?" (PDF). specials.ft.com. Archived from the original (PDF) on 10 September 2008. Retrieved 17 November 2007.
  107. "Help - FT Help - FT.com What happened to Press Cuttings?" (PDF). specials.ft.com. Archived from the original (PDF) on 28 August 2008. Retrieved 17 November 2007.
  108. "Help - FT Help - FT.com What happened to Press Cuttings?". specials.ft.com. Archived from the original on 13 November 2007. Retrieved 17 November 2007.
  109. "Help - FT Help - FT.com What happened to Press Cuttings?". specials.ft.com. Archived from the original on 29 March 2010. Retrieved 17 November 2007.
  110. "Biggest companies in the world by market cap 1999". Archived from the original on 3 November 2022. Retrieved 3 November 2022.
  111. "Help - FT Help - FT.com What happened to Press Cuttings?". specials.ft.com. Archived from the original on 1 February 2010. Retrieved 17 November 2007.
  112. Financial Times , 22 January 1998
  113. Financial Times , January 1997