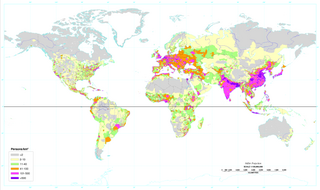
List of sovereign states and dependent territories in North America by population density

Last updated
World map showing North America LocationNorthAmerica.png
World map showing North America
A satellite composite image of North America North America satellite orthographic.jpg
A satellite composite image of North America
RankCountryPopulationArea (km2)Density
Bermuda 65,36553.31,226
8 Barbados 279,254431647
Puerto Rico 3,916,6329,104430
Martinique 432,9001,100393
Aruba 71,566193370
23 El Salvador 6,704,93221,040318
Virgin Islands 108,708352308
26 Saint Vincent and the Grenadines 117,534389302
28 Haiti 8,121,62227,750292
29 Saint Lucia 166,312616269
Guadeloupe 448,7131,780252
32 Jamaica 2,731,83210,991248
Netherlands Antilles 219,958960229
36 Trinidad and Tobago 1,088,6445,128212
43 Dominican Republic 8,950,03448,730183
Cayman Islands 44,270262168
47 Antigua and Barbuda 68,722443155
51 Saint Kitts and Nevis 38,958261149
British Virgin Islands 22,643153147
55 Guatemala 14,655,189108,890134
Anguilla 13,254102129
73 Cuba 11,346,670110,860102
80 Dominica 69,02975491
Montserrat 9,34110291
91 Costa Rica 4,016,17351,10078
107 Honduras 6,975,204112,09062
117 Mexico 106,202,9031,972,55053
Turks and Caicos Islands 20,55643047
127 Nicaragua 5,465,100129,49442
132 Panama 3,039,15078,20038
143 United States 298,212,9009,629,09131
Saint-Pierre and Miquelon 7,01224228
152 The Bahamas 301,79013,94021
171 Belize 279,45722,96612
185 Canada 32,805,0419,984,6703
Greenland 56,3752,166,0860.03
Navassa Island 05.20

Sources: Wikipedia (List of countries and dependencies by population density)

See also

Related Research Articles

Per capita income Average income of an economy

Per capita income (PCI) or average income measures the average income earned per person in a given area in a specified year. It is calculated by dividing the area's total income by its total population.

Population density

Population density is a measurement of population per unit area, or exceptionally unit volume; it is a quantity of type number density. It is frequently applied to living organisms, most of the time to humans. It is a key geographical term. In simple terms, population density refers to the number of people living in an area per square kilometre.

Urban area Human settlement with high population density and infrastructure of built environment

An urban area, or built-up area, is a human settlement with a high population density and infrastructure of built environment. Urban areas are created through urbanization and are categorized by urban morphology as cities, towns, conurbations or suburbs. In urbanism, the term contrasts to rural areas such as villages and hamlets; in urban sociology or urban anthropology it contrasts with natural environment. The creation of early predecessors of urban areas during the urban revolution led to the creation of human civilization with modern urban planning, which along with other human activities such as exploitation of natural resources led to a human impact on the environment. "Agglomeration effects" are in the list of the main consequences of increased rates of firm creation since. This is due to conditions created by a greater level of industrial activity in a given region. However, a favorable environment for human capital development would also be generated simultaneously.

This is a list of lists of countries and territories by various criteria. A country or territory is a geographical area, either in the sense of nation or state.

Demographics of Asia Overview of the demographics of Asia

The continent of Asia covers 29.4% of the Earth's land area and has a population of around 4.5 billion, accounting for about 60% of the world population. The combined population of both China and India are estimated to be over 2.7 billion people as of 2015. Asia's population is projected to grow to 5.26 billion by 2050, or about 54% of projected world population at that time. Population growth in Asia was close to 1.2% p.a. as of 2015, with highly disparate rates. Many West Asian countries have growth rates above 2% p.a., notably Pakistan at 2.4% p.a., while China has a growth rate below 0.5% p.a..