Analysis of variance (ANOVA) is a collection of statistical models and their associated estimation procedures used to analyze the differences among group means in a sample. ANOVA was developed by statistician and evolutionary biologist Ronald Fisher. The ANOVA is based on the law of total variance, where the observed variance in a particular variable is partitioned into components attributable to different sources of variation. In its simplest form, ANOVA provides a statistical test of whether two or more population means are equal, and therefore generalizes the t-test beyond two means.

Statistics is the discipline that concerns the collection, organization, displaying, analysis, interpretation and presentation of data. In applying statistics to a scientific, industrial, or social problem, it is conventional to begin with a statistical population or a statistical model to be studied. Populations can be diverse groups of people or objects such as "all people living in a country" or "every atom composing a crystal". Statistics deals with every aspect of data, including the planning of data collection in terms of the design of surveys and experiments. See glossary of probability and statistics.
The power of a binary hypothesis test is the probability that the test rejects the null hypothesis (H0) when a specific alternative hypothesis (H1) is true. The statistical power ranges from 0 to 1, and as statistical power increases, the probability of making a type II error (wrongly failing to reject the null hypothesis) decreases. For a type II error probability of β, the corresponding statistical power is 1 − β. For example, if experiment 1 has a statistical power of 0.7, and experiment 2 has a statistical power of 0.95, then there is a stronger probability that experiment 1 had a type II error than experiment 2, and experiment 2 is more reliable than experiment 1 due to the reduction in probability of a type II error. It can be equivalently thought of as the probability of accepting the alternative hypothesis (H1) when it is true—that is, the ability of a test to detect a specific effect, if that specific effect actually exists. That is,

The margin of error is a statistic expressing the amount of random sampling error in a survey's results. The larger the margin of error, the less confidence one should have that the poll's reported results are close to the "true" figures; that is, the figures for the whole population. The margin of error is positive whenever a population is incompletely sampled and the outcome measure has positive variance.
In statistics, a confidence interval (CI) is a type of interval estimate, computed from the statistics of the observed data, that might contain the true value of an unknown population parameter. The interval has an associated confidence level, or coverage that, loosely speaking, quantifies the level of confidence that the deterministic parameter is captured by the interval. More strictly speaking, the confidence level represents the frequency of possible confidence intervals that contain the true value of the unknown population parameter. In other words, if confidence intervals are constructed using a given confidence level from an infinite number of independent sample statistics, the proportion of those intervals that contain the true value of the parameter will be equal to the confidence level.
In statistics, the Mann–Whitney U test is a nonparametric test of the null hypothesis that it is equally likely that a randomly selected value from one sample will be less than or greater than a randomly selected value from a second sample.
In statistics, an effect size is a quantitative measure of the magnitude of a phenomenon. Examples of effect sizes are the correlation between two variables, the regression coefficient in a regression, the mean difference, or even the risk with which something happens, such as how many people survive after a heart attack for every one person that does not survive. For most types of effect size, a larger absolute value always indicates a stronger effect, with the main exception being if the effect size is an odds ratio. Effect sizes complement statistical hypothesis testing, and play an important role in power analyses, sample size planning, and in meta-analyses. They are the first item (magnitude) in the MAGIC criteria for evaluating the strength of a statistical claim. Especially in meta-analysis, where the purpose is to combine multiple effect sizes, the standard error (S.E.) of the effect size is of critical importance. The S.E. of the effect size is used to weigh effect sizes when combining studies, so that large studies are considered more important than small studies in the analysis. The S.E. of the effect size is calculated differently for each type of effect size, but generally only requires knowing the study's sample size (N), or the number of observations in each group.
The t-test is any statistical hypothesis test in which the test statistic follows a Student's t-distribution under the null hypothesis.

The standard error (SE) of a statistic is the standard deviation of its sampling distribution or an estimate of that standard deviation. If the parameter or the statistic is the mean, it is called the standard error of the mean (SEM).
A tolerance interval is a statistical interval within which, with some confidence level, a specified proportion of a sampled population falls. "More specifically, a 100×p%/100×(1−α) tolerance interval provides limits within which at least a certain proportion (p) of the population falls with a given level of confidence (1−α)." "A tolerance interval (TI) based on a sample is constructed so that it would include at least a proportion p of the sampled population with confidence 1−α; such a TI is usually referred to as p-content − (1−α) coverage TI." "A upper tolerance limit (TL) is simply a 1−α upper confidence limit for the 100 p percentile of the population."
Sample size determination is the act of choosing the number of observations or replicates to include in a statistical sample. The sample size is an important feature of any empirical study in which the goal is to make inferences about a population from a sample. In practice, the sample size used in a study is usually determined based on the cost, time, or convenience of collecting the data, and the need for it to offer sufficient statistical power. In complicated studies there may be several different sample sizes: for example, in a stratified survey there would be different sizes for each stratum. In a census, data is sought for an entire population, hence the intended sample size is equal to the population. In experimental design, where a study may be divided into different treatment groups, there may be different sample sizes for each group.
Most of the terms listed in Wikipedia glossaries are already defined and explained within Wikipedia itself. However, glossaries like this one are useful for looking up, comparing and reviewing large numbers of terms together. You can help enhance this page by adding new terms or writing definitions for existing ones.
The sign test is a statistical method to test for consistent differences between pairs of observations, such as the weight of subjects before and after treatment. Given pairs of observations for each subject, the sign test determines if one member of the pair tends to be greater than the other member of the pair.
In statistics, resampling is any of a variety of methods for doing one of the following:
- Estimating the precision of sample statistics by using subsets of available data (jackknifing) or drawing randomly with replacement from a set of data points (bootstrapping)
- Exchanging labels on data points when performing significance tests
- Validating models by using random subsets

In statistics, bootstrapping is any test or metric that relies on random sampling with replacement. Bootstrapping allows assigning measures of accuracy to sample estimates. This technique allows estimation of the sampling distribution of almost any statistic using random sampling methods. Generally, it falls in the broader class of resampling methods.
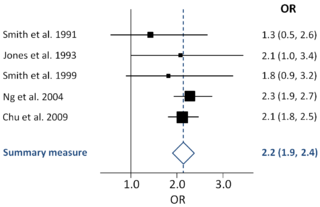
A forest plot, also known as a blobbogram, is a graphical display of estimated results from a number of scientific studies addressing the same question, along with the overall results. It was developed for use in medical research as a means of graphically representing a meta-analysis of the results of randomized controlled trials. In the last twenty years, similar meta-analytical techniques have been applied in observational studies and forest plots are often used in presenting the results of such studies also.
In statistics, the studentized range is the difference between the largest and smallest data in a sample measured in units of sample standard deviations.

Many animals, including humans, tend to live in groups, herds, flocks, bands, packs, shoals, or colonies of conspecific individuals. The size of these groups, as expressed by the number of people/etc in a group such as eight groups of nine people in each one, is an important aspect of their social environment. Group size tend to be highly variable even within the same species, thus we often need statistical measures to quantify group size and statistical tests to compare these measures between two or more samples. Group size measures are notoriously hard to handle statistically since groups sizes typically follow an aggregated (right-skewed) distribution: most groups are small, few are large, and a very few are very large.
Estimation statistics is a data analysis framework that uses a combination of effect sizes, confidence intervals, precision planning, and meta-analysis to plan experiments, analyze data and interpret results. It is distinct from null hypothesis significance testing (NHST), which is considered to be less informative. Estimation statistics, or simply estimation, is also known as the new statistics, a distinction introduced in the fields of psychology, medical research, life sciences and a wide range of other experimental sciences where NHST still remains prevalent, despite estimation statistics having been recommended as preferable for several decades.