Related Research Articles
California's 50th congressional district is a congressional district in the U.S. state of California, and encompasses parts of the Mid-Coast and northeastern parts of San Diego County. Scott Peters is currently the U.S. representative for California's 50th congressional district.
The recent and current politics of the U.S. state of California are complex and involve a number of entrenched interests. (For historical politics, see Politics of California before 1900). The first presidential election the state participated in was 1852. For the next few decades after the Civil War, California was a Republican-leaning but a very competitive state in presidential elections, as in voted for the nationwide winner all but thrice between statehood and 1912, with the exceptions of 1880, 1884, and 1912. Beginning with the 1916 election, the state shifted into a bellwether. Between 1916 and 1948, it voted for the nationwide winner every time, and was critical to Democratic victories in 1916 and 1948, as well.
The US state of Illinois is a Democratic stronghold and one of the "big three" Democratic states alongside California and New York. It is considered one of the most Democratic states in the nation and following the 2018 elections, all six statewide elected offices are held by a Democrat. However, there is a sharp division between Democratic cities, college towns, and population centers, and highly conservative rural regions, which continue to be dominated by Republicans, but are drowned out due to their relatively low population.
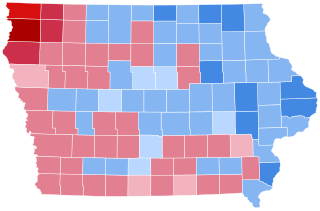
The 2008 United States presidential election in Iowa took place on November 4, 2008, as part of the 2008 United States presidential election. Voters chose seven representatives, or electors to the Electoral College, who voted for president and vice president.

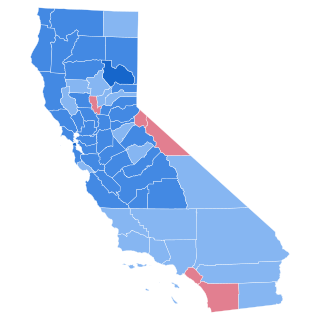
The 2008 United States presidential election in California took place on November 4, 2008, in California as part of the 2008 United States presidential election. Voters chose 55 electors, the most out of any of the 50 states, to the Electoral College, who voted for president and vice president.

The 2008 United States presidential election in New York took place on November 4, 2008, and was part of the 2008 United States presidential election. Voters chose 31 representatives, or electors to the Electoral College, who voted for president and vice president.
The 1964 United States presidential election in California took place on November 3, 1964 as part of the 1964 United States presidential election. State voters chose 40 representatives, or electors, to the Electoral College, who voted for president and vice president.

The 2008 United States presidential election in North Carolina was part of the national event on November 4, 2008, throughout all 50 states and D.C. In North Carolina, voters chose 15 representatives, or electors, to the Electoral College, who voted for president and vice president.
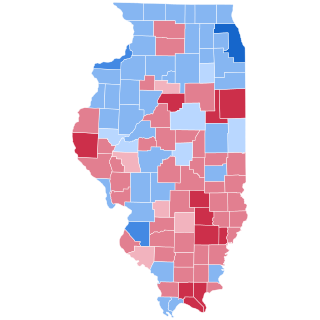
The 2008 United States presidential election in Illinois took place on November 4, 2008, and was part of the 2008 United States presidential election. Voters chose 21 representatives, or electors to the Electoral College, who voted for president and vice president.
The 2008 United States presidential election in New Mexico took place on November 4, 2008. Voters chose five representatives, or electors to the Electoral College, who voted for president and vice president.

The 2012 United States presidential election in Michigan took place on November 6, 2012, as part of the 2012 United States presidential election in which all 50 states plus the District of Columbia participated. Voters chose 16 electors to represent them in the Electoral College via a popular vote pitting incumbent Democratic President Barack Obama and his running mate, Vice President Joe Biden, against Republican challenger and former Massachusetts Governor Mitt Romney and his running mate, Congressman Paul Ryan.

The 2012 United States presidential election in Georgia took place on November 6, 2012, as part of the 2012 General Election in which all 50 states plus the District of Columbia participated. Georgia voters chose 16 electors to represent them in the Electoral College via a popular vote pitting incumbent Democratic President Barack Obama and his running mate, Vice President Joe Biden, against Republican challenger and former Massachusetts Governor Mitt Romney and his running mate, Congressman Paul Ryan.
The politics of Los Angeles County leans Democratic. Los Angeles County has voted Democratic in every Presidential election since 1988, with every Democratic nominee winning the county by a margin of at least 25 points since 1992. Los Angeles County has voted for the Democratic candidate in most of the presidential elections in the past four decades, although it did vote twice for Dwight Eisenhower, Richard Nixon, and Ronald Reagan, the latter two of whom were Californians. From 1920 to 1984 it could be considered as a reliable bellwether county which always voted for the eventual national winner. Los Angeles went against the overall national picture in 1988, 2000, 2004 and 2016.
Politics in the San Francisco Bay Area is widely regarded as one of the most liberal in the country. According to the California Secretary of State, the Democratic Party holds a voter registration advantage in every congressional district, State Senate district, State Assembly district, State Board of Equalization district, all nine counties, and all of the 101 incorporated municipalities in the Bay Area. The Republican Party holds a voter registration advantage in one State Assembly sub-district.

Michael Ted Levin is an American politician and attorney serving as the U.S. representative for California's 49th congressional district since 2019. A member of the Democratic Party, he represents most of northern coastal San Diego County, as well as part of southern Orange County.

The 2020 United States House of Representatives elections in California was held on November 3, 2020, to elect the 53 U.S. representatives from the state of California, one from each of the state's 53 congressional districts. The elections coincided with the 2020 U.S. presidential election, as well as other elections to the United States House of Representatives, elections to the United States Senate, and various state and local elections.

The 2020 United States presidential election in California was held on Tuesday, November 3, 2020, as part of the 2020 United States presidential election in which all 50 states plus the District of Columbia participated. California voters chose electors to represent them in the Electoral College via a popular vote, pitting the Republican Party's nominee, incumbent President Donald Trump, and running mate Vice President Mike Pence against Democratic Party nominee, former Vice President Joe Biden, and his running mate Kamala Harris, the junior senator from California. California had, in the 2020 election 55 electoral votes in the Electoral College, the most of any state. California was one of six states where Trump received more percentage of the two-party vote than he did in 2016. This election also marked the first time since 2004 that the Republican candidate won more than one million votes in Los Angeles County, due to increased turnout statewide.

The 2020 United States presidential election in Colorado was held on Tuesday, November 3, 2020, as part of the 2020 United States presidential election in which all 50 states plus the District of Columbia participated. Colorado voters chose electors to represent them in the Electoral College via a popular vote, pitting the Republican Party's nominee, incumbent President Donald Trump from Florida, and his running mate Vice President Mike Pence from Indiana, against Democratic Party nominee, former Vice President Joe Biden from Delaware, and his running mate, Senator Kamala Harris from California. Colorado had nine electoral votes in the Electoral College.
The 2020 United States presidential election in Nebraska was held on Tuesday, November 3, 2020, as part of the 2020 United States presidential election in which all 50 states plus the District of Columbia participated. Nebraska voters chose electors to represent them in the Electoral College via a popular vote, pitting the Republican Party's nominee, incumbent President Donald Trump, and running mate Vice President Mike Pence against Democratic Party nominee, former Vice President Joe Biden, and his running mate California Senator Kamala Harris. Nebraska has five electoral votes in the Electoral College, two from the state at large, and one each from the three congressional districts.

The 2022 United States House of Representatives elections in California were held on November 8, 2022, to elect representatives for the 52 seats in California. This marked the first time in the state's history where it lost a seat.
References
- ↑ Leip, David. "Dave Leip's Atlas of U.S. Presidential Elections". uselectionatlas.org.
- ↑ "Supplement to the Statement of Vote Political Districts within Counties for President" (PDF). CA.gov. p. 24. Retrieved January 10, 2020.
- ↑ "Coronado Voters Pick Biden over Trump in Early Results - Republican Candidate Picked in 1992-2016 Elections". 7 November 2020.
- ↑ Libby, Sarah (November 5, 2012). "Where to Find Us on Election Day". Voice of San Diego. Retrieved December 28, 2012.
- ↑ Amid the celebrations, farewell | The San Diego Union-Tribune
- 1 2 "Final Maps". California Citizens Redistricting Commission. CAWeb Publishing Service. Retrieved 2023-07-03.
- ↑ "State Assembly Districts (San Diego County Portion)". December 26, 2021. Retrieved July 3, 2023.
- 1 2 Weber, Shirly N. (2023). Report of Registration Odd-Numbered Year Report (PDF). California Secretary of State.
- ↑ U.S. Census Bureau. American Community Survey, 2011 American Community Survey 5-Year Estimates, Table B02001. U.S. Census website. Retrieved October 26, 2013.
- 1 2 3 4 5 6 "Report of Registration - State Reporting Districts" (PDF). sdvote.com. County of San Diego. 6 September 2014. Retrieved 28 April 2018.
- ↑ "404 Not Found | Jim's Blog". www.jamesewelch.com. Retrieved 2022-09-23.
{{cite web}}: Cite uses generic title (help)