Rodger's method

Last updated

Rodger's method is a statistical procedure for examining research data post hoc following an 'omnibus' analysis (e.g., after an analysis of variance  – anova). The various components of this methodology were fully worked out by R. S. Rodger in the 1960s and 70s, and seven of his articles about it were published in the British Journal of Mathematical and Statistical Psychology between 1967 and 1978. [1] [2] [3] [4] [5] [6] [7]

Statistics study of the collection, organization, analysis, interpretation, and presentation of data

Statistics is a branch of mathematics dealing with data collection, organization, analysis, interpretation and presentation. In applying statistics to, for example, a scientific, industrial, or social problem, it is conventional to begin with a statistical population or a statistical model process to be studied. Populations can be diverse topics such as "all people living in a country" or "every atom composing a crystal". Statistics deals with all aspects of data, including the planning of data collection in terms of the design of surveys and experiments. See glossary of probability and statistics.

In a scientific study, post hoc analysis consists of statistical analyses that were not specified before the data was seen. This typically creates a multiple testing problem because each potential analysis is effectively a statistical test. Multiple testing procedures are sometimes used to compensate, but that is often difficult or impossible to do precisely. Post hoc analysis that is conducted and interpreted without adequate consideration of this problem is sometimes called data dredging by critics because the statistical associations that it finds are often spurious.

Analysis of variance (ANOVA) is a collection of statistical models and their associated estimation procedures used to analyze the differences among group means in a sample. ANOVA was developed by statistician and evolutionary biologist Ronald Fisher. In the ANOVA setting, the observed variance in a particular variable is partitioned into components attributable to different sources of variation. In its simplest form, ANOVA provides a statistical test of whether the population means of several groups are equal, and therefore generalizes the t-test to more than two groups. ANOVA is useful for comparing (testing) three or more group means for statistical significance. It is conceptually similar to multiple two-sample t-tests, but is more conservative, resulting in fewer type I errors, and is therefore suited to a wide range of practical problems.

Contents

Statistical procedures for finding differences between groups, along with interactions between the groups that were included in an experiment or study, can be classified along two dimensions: 1) were the statistical contrasts that will be evaluated decided upon prior to collecting the data (planned) or while trying to figure out what those data are trying to reveal (post hoc), and 2) does the procedure use a decision-based (i.e., per contrast) error rate or does it instead use an experiment-wise error rate. Rodger's method, and some others, are classified according to these dimensions in the table below.

Table 1: Some multiple comparison procedures
Planned contrastsPost hoc contrasts
Decision-based error ratet testsDuncan's method
Rodger's method
Experiment-wise error rateBonferroni's inequality
Dunnett's method
Newman–Keuls method
Tukey's range method
Scheffé's method

Statistical power

In early 1990s, one set of researchers made this statement about their decision to use Rodger's method: “We chose Rodger’s method because it is the most powerful post hoc method available for detecting true differences among groups. This was an especially important consideration in the present experiments in which interesting conclusions could rest on null results” (Williams, Frame, & LoLordo, 1992, p. 43). [8] The most definitive evidence for the statistical power advantage that Rodger's method possesses (as compared with eight other multiple comparison procedures) is provided in a 2013 article by Rodger and Roberts. [9]

Type 1 error rate

Statistical power is an important consideration when choosing what statistical procedure to use, but it isn't the only important one. All statistical procedures permit researchers to make statistical errors and they are not all equal in their ability to control the rate of occurrence of several important types of statistical error. As Table 1 shows, statisticians can't agree on how error rate ought to be defined, but particular attention has been traditionally paid to what are called 'type 1 errors' and whether or not a statistical procedure is susceptible to type 1 error rate inflation.

On this matter, the facts about Rodger's method are straightforward and unequivocal. Rodger's method permits an absolutely unlimited amount of post hoc data snooping and this is accompanied by a guarantee that the long run expectation of type 1 errors will never exceed the commonly used rates of either 5 or 1 percent. Whenever a researcher falsely rejects a true null contrast (whether it is a planned or post hoc one) the probability of that being a type 1 error is 100%. It is the average number of such errors over the long run that Rodger's method guarantees cannot exceed Eα = 0.05 or 0.01. This statement is a logical tautology, a necessary truth, that follows from the manner in which Rodger's method was originally conceived and subsequently built. Type 1 error rate inflation is statistically impossible with Rodger's method, but every statistical decision a researcher makes that might be a type 1 error will either actually be one or it won't.

Decision-based error rate

The two features of Rodger's method that have been mentioned thus far, its increased statistical power and the impossibility of type 1 error rate inflation when using it, are direct by-products of the decision-based error rate that it utilizes. "An error occurs, in the statistical context, if and only if a decision is made that a specified relationship among population parameters either is, or is not, equal to some number (usually, zero), and the opposite is true. Rodger’s very sensible, and cogently argued, position is that statistical error rate should be based exclusively on those things in which errors may occur, and that (necessarily, by definition) can only be the statistical decisions that researchers make" (Roberts, 2011, p. 69). [10]

Implied true population means

There is a unique aspect of Rodger's method that is statistically valuable and is not dependent on its decision-based error rate. As Bird stated: "Rodger (1965, 1967a, 1967b, 1974) explored the possibility of examining the logical implications of statistical inferences on a set of J  1 linearly independent contrasts. Rodger’s approach was formulated within the Neyman-Pearson hypothesis-testing framework [...] and required that the test of each contrast Ψi (i = 1, ... , J  1) should result in a ‘decision’ between the null hypothesis (iH0: Ψi = 0) and a particular value δi specified a priori by the alternative hypothesis (iH1: Ψi = δi). Given the resulting set of decisions, it is possible to determine the implied values of all other contrasts" (Bird, 2011, p. 434). [11]

The statistical value that Rodger derived from the ‘implication equation’ that he invented is prominently displayed in the form of 'implied means' that are logically implied, and mathematically entailed, by the J  1 statistical decisions that the user of his method makes. These implied true population means constitute a very precise statement about the outcome of one's research, and assist other researchers in determining the size of effect that their related research ought to seek.

Whither Rodger’s method?

Since the inception of Rodger's method, some researchers who use it have had their work published in prestigious scientific journals, and this continues to happen. Nevertheless, it is fair to currently conclude that “Rodger’s work on deduced inference has been largely ignored” (Bird, 2011, p. 434). Bird uses implication equations, similar to Rodger's, to deduce interval inferences concerning any contrasts not included in an analysis from the upper and lower limits of confidence intervals on J  1 linearly independent planned contrasts; a procedure that Rodger himself opposes. [12]

A very different desired outcome for Rodger's method was conveyed in this statement by Roberts: "Will Rodger’s method continue to be used by only a few researchers, become extinct, or supplant most or all of the currently popular post hoc procedures following ANOVA? This article and the SPS computer program constitute an attempted intervention in the competition for dominance and survival that occurs among ideas. My hope is that the power and other virtues of Rodger’s method will become much more widely known and that, as a consequence, it will become commonly used. ... Better ideas and the ‘mousetraps’ they are instantiated in, ought, eventually, to come to the fore" (Roberts, 2011, p. 78).

The possible futures for Rodger's method mentioned in the two previous paragraphs are therefore not exhaustive, and the possibilities on a more comprehensive list are no longer mutually exclusive.

Related Research Articles

Biostatistics are the application of statistics to a wide range of topics in biology. It encompasses the design of biological experiments, especially in medicine, pharmacy, agriculture and fishery; the collection, summarization, and analysis of data from those experiments; and the interpretation of, and inference from, the results. A major branch is medical biostatistics, which is exclusively concerned with medicine and health.

The theory of statistics provides a basis for the whole range of techniques, in both study design and data analysis, that are used within applications of statistics. The theory covers approaches to statistical-decision problems and to statistical inference, and the actions and deductions that satisfy the basic principles stated for these different approaches. Within a given approach, statistical theory gives ways of comparing statistical procedures; it can find a best possible procedure within a given context for given statistical problems, or can provide guidance on the choice between alternative procedures.

Statistics is a field of inquiry that studies the collection, analysis, interpretation, and presentation of data. It is applicable to a wide variety of academic disciplines, from the physical and social sciences to the humanities; it is also used and misused for making informed decisions in all areas of business and government.

A statistical hypothesis, sometimes called confirmatory data analysis, is a hypothesis that is testable on the basis of observing a process that is modeled via a set of random variables. A statistical hypothesis test is a method of statistical inference. Commonly, two statistical data sets are compared, or a data set obtained by sampling is compared against a synthetic data set from an idealized model. A hypothesis is proposed for the statistical relationship between the two data sets, and this is compared as an alternative to an idealized null hypothesis that proposes no relationship between two data sets. The comparison is deemed statistically significant if the relationship between the data sets would be an unlikely realization of the null hypothesis according to a threshold probability—the significance level. Hypothesis tests are used in determining what outcomes of a study would lead to a rejection of the null hypothesis for a pre-specified level of significance. The process of distinguishing between the null hypothesis and the alternative hypothesis is aided by identifying two conceptual types of errors. The first type occurs when the null hypothesis is falsely rejected. The second type of error occurs when the null hypothesis is falsely assumed to be true. By specifying a threshold probability ('alpha') on, e.g., the admissible risk of making a type 1 error, the statistical decision process can be controlled.

In statistics, family-wise error rate (FWER) is the probability of making one or more false discoveries, or type I errors when performing multiple hypotheses tests.

In statistical hypothesis testing, a type I error is the rejection of a true null hypothesis, while a type II error is the failure to reject a false null hypothesis. More simply stated, a type I error is to falsely infer the existence of something that is not there, while a type II error is to falsely infer the absence of something that is present.

Omnibus tests are a kind of statistical test. They test whether the explained variance in a set of data is significantly greater than the unexplained variance, overall. One example is the F-test in the analysis of variance. There can be legitimate significant effects within a model even if the omnibus test is not significant. For instance, in a model with two independent variables, if only one variable exerts a significant effect on the dependent variable and the other does not, then the omnibus test may be non-significant. This fact does not affect the conclusions that may be drawn from the one significant variable. In order to test effects within an omnibus test, researchers often use contrasts.

In statistics, the Bonferroni correction is one of several methods used to counteract the problem of multiple comparisons.

Null distribution

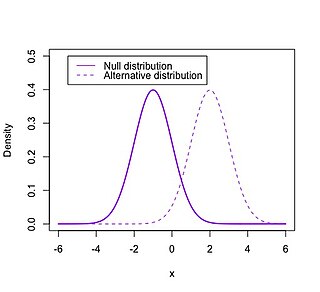
In statistical hypothesis testing, the null distribution is the probability distribution of the test statistic when the null hypothesis is true. For example, in an F-test, the null distribution is an F-distribution. Null distribution is a tool scientists often use when conducting experiments. The null distribution is the distribution of two sets of data under a null hypothesis. If the results of the two sets of data are not outside the parameters of the expected results, then the null hypothesis is said to be true.

Multiple comparisons problem

In statistics, the multiple comparisons, multiplicity or multiple testing problem occurs when one considers a set of statistical inferences simultaneously or infers a subset of parameters selected based on the observed values. In certain fields it is known as the look-elsewhere effect.

Statistical conclusion validity is the degree to which conclusions about the relationship among variables based on the data are correct or ‘reasonable’. This began as being solely about whether the statistical conclusion about the relationship of the variables was correct, but now there is a movement towards moving to ‘reasonable’ conclusions that use: quantitative, statistical, and qualitative data. Fundamentally, two types of errors can occur: type I and type II. Statistical conclusion validity concerns the qualities of the study that make these types of errors more likely. Statistical conclusion validity involves ensuring the use of adequate sampling procedures, appropriate statistical tests, and reliable measurement procedures.

Mauchly's sphericity test is a statistical test used to validate a repeated measures analysis of variance (ANOVA).

Repeated measures design is a research design that involves multiple measures of the same variable taken on the same or matched subjects either under different conditions or over two or more time periods. For instance, repeated measurements are collected in a longitudinal study in which change over time is assessed.

In statistics, a shrinkage estimator is an estimator that, either explicitly or implicitly, incorporates the effects of shrinkage. In loose terms this means that a naive or raw estimate is improved by combining it with other information. The term relates to the notion that the improved estimate is made closer to the value supplied by the 'other information' than the raw estimate. In this sense, shrinkage is used to regularize ill-posed inference problems.

In statistics, when performing multiple comparisons, a false positive ratio is the probability of falsely rejecting the null hypothesis for a particular test. The false positive rate is calculated as the ratio between the number of negative events wrongly categorized as positive and the total number of actual negative events.

The Newman–Keuls or Student–Newman–Keuls (SNK) method is a stepwise multiple comparisons procedure used to identify sample means that are significantly different from each other. It was named after Student (1927), D. Newman, and M. Keuls. This procedure is often used as a post-hoc test whenever a significant difference between three or more sample means has been revealed by an analysis of variance (ANOVA). The Newman–Keuls method is similar to Tukey's range test as both procedures use studentized range statistics. Unlike Tukey's range test, the Newman–Keuls method uses different critical values for different pairs of mean comparisons. Thus, the procedure is more likely to reveal significant differences between group means and to commit type I errors by incorrectly rejecting a null hypothesis when it is true. In other words, the Neuman-Keuls procedure is more powerful but less conservative than Tukey's range test.

In statistics, one purpose for the analysis of variance (ANOVA) is to analyze differences in means between groups. The test statistic, F, assumes independence of observations, homogeneous variances, and population normality. ANOVA on ranks is a statistic designed for situations when the normality assumption has been violated.

In statistics, a false coverage rate (FCR) is the average rate of false coverage, i.e. not covering the true parameters, among the selected intervals.

References

  1. Rodger, R. S. (1974). Multiple contrasts, factors, error rate and power. British Journal of Mathematical and Statistical Psychology, 27, 179–198.
  2. Rodger, R. S. (1975a). The number of non-zero, post hoc contrasts from ANOVA and error-rate I. British Journal of Mathematical and Statistical Psychology, 28, 71–78.
  3. Rodger, R. S. (1975b). Setting rejection rate for contrasts selected post hoc when some nulls are false. British Journal of Mathematical and Statistical Psychology, 28, 214–232.
  4. Rodger, R. S. (1978). Two-stage sampling to set sample size for post hoc tests in ANOVA with decision-based error rates. British Journal of Mathematical and Statistical Psychology, 31, 153–178.
  5. Rodger, R. S. (1969). Linear hypotheses in 2xa frequency tables. British Journal of Mathematical and Statistical Psychology, 22, 29–48.
  6. Rodger, R. S. (1967a). Type I errors and their decision basis. British Journal of Mathematical and Statistical Psychology, 20, 51–62.
  7. Rodger, R. S. (1967b). Type II errors and their decision basis. British Journal of Mathematical and Statistical Psychology, 20, 187–204.
  8. Williams, D. A., Frame, K. A., & LoLordo, V. M. (1992). Discrete signals for the unconditioned stimulus fail to overshadow contextual or temporal conditioning. Journal of Experimental Psychology: Animal Behavior Processes, 18(1), 41–55.
  9. Rodger, R.S. and Roberts, M. (2013). Comparison of power for multiple comparison procedures. Journal of Methods and Measurement in the Social Sciences, 4(1), 20–47.
  10. Roberts, M. (2011). Simple, Powerful Statistics: An instantiation of a better ‘mousetrap’. Journal of Methods and Measurement in the Social Sciences, 2(2), 63–79.
  11. Bird, K. D. (2011). Deduced inference in the analysis of experimental data. Psychological Methods, 16(4), 432–443.
  12. Rodger, R. S. (2012). Paired comparisons, confusion, constraint, contradictions, and confidence intervals. Unpublished manuscript.