The Dow Jones Industrial Average (DJIA), or simply the Dow, is a stock market index that indicates the value of 30 large, publicly owned companies based in the United States, and how they have traded in the stock market during various periods of time. The value of the Dow is not a weighted arithmetic mean and does not represent its component companies' market capitalization, but rather the sum of the price of one share of stock for each component company. The sum is corrected by a factor which changes whenever one of the component stocks has a stock split or stock dividend, so as to generate a consistent value for the index.
A market trend is a perceived tendency of financial markets to move in a particular direction over time. These trends are classified as secular for long time frames, primary for medium time frames, and secondary for short time frames. Traders attempt to identify market trends using technical analysis, a framework which characterizes market trends as predictable price tendencies within the market when price reaches support and resistance levels, varying over time.
The Dow theory on stock price movement is a form of technical analysis that includes some aspects of sector rotation. The theory was derived from 255 Wall Street Journal editorials written by Charles H. Dow (1851–1902), journalist, founder and first editor of The Wall Street Journal and co-founder of Dow Jones and Company. Following Dow's death, William Peter Hamilton, Robert Rhea and E. George Schaefer organized and collectively represented Dow theory, based on Dow's editorials. Dow himself never used the term Dow theory nor presented it as a trading system.
The relative strength index (RSI) is a technical indicator used in the analysis of financial markets. It is intended to chart the current and historical strength or weakness of a stock or market based on the closing prices of a recent trading period. The indicator should not be confused with relative strength.
Contrarian Investing is an investment strategy that is characterized by purchasing and selling in contrast to the prevailing sentiment of the time.

MACD, short for moving average convergence/divergence, is a trading indicator used in technical analysis of stock prices, created by Gerald Appel in the late 1970s. It is supposed to reveal changes in the strength, direction, momentum, and duration of a trend in a stock's price.
Market timing is the strategy of making buying or selling decisions of financial assets by attempting to predict future market price movements. The prediction may be based on an outlook of market or economic conditions resulting from technical or fundamental analysis. This is an investment strategy based on the outlook for an aggregate market, rather than for a particular financial asset.
This article is a summary of the closing milestones of the Dow Jones Industrial Average, a United States stock market index. Since first closing at 62.76 on February 16, 1885, the Dow Jones Industrial Average has increased, despite several periods of decline.
Nearly 78 years have passed since Paul L. Dysart, Jr. invented the Negative Volume Index and Positive Volume Index indicators. The indicators remain useful to identify primary market trends and reversals.
The Coppock curve or Coppock indicator is a technical analysis indicator for long-term stock market investors created by E.S.C. Coppock, first published in Barron's Magazine on October 15, 1962.
Option strategies are the simultaneous, and often mixed, buying or selling of one or more options that differ in one or more of the options' variables. Call options, simply known as calls, give the buyer a right to buy a particular stock at that option's strike price. Conversely, put options, simply known as puts, give the buyer the right to sell a particular stock at the option's strike price. This is often done to gain exposure to a specific type of opportunity or risk while eliminating other risks as part of a trading strategy. A very straightforward strategy might simply be the buying or selling of a single option, however option strategies often refer to a combination of simultaneous buying and or selling of options.
The McClellan oscillator is a market breadth indicator used in technical analysis by financial analysts of the New York Stock Exchange to evaluate the balance between the advancing and declining stocks. The McClellan oscillator is based on the Advance-Decline Data and it could be applied to stock market exchanges, indexes, portfolio of stocks or any basket of stocks.
In the statistics of time series, and in particular the analysis of financial time series for stock trading purposes, a moving-average crossover occurs when, on plotting two moving averages each based on different degrees of smoothing, the traces of these moving averages cross. It does not predict future direction but shows trends. This indicator uses two moving averages, a slower moving average and a faster moving average. The faster moving average is a short term moving average. For end-of-day stock markets, for example, it may be 5-, 10- or 25-day period while the slower moving average is medium or long term moving average. A short term moving average is faster because it only considers prices over short period of time and is thus more reactive to daily price changes. On the other hand, a long term moving average is deemed slower as it encapsulates prices over a longer period and is more lethargic. However, it tends to smooth out price noises which are often reflected in short term moving averages.
Stock market cycles are the long-term price patterns of stock markets and are often associated with general business cycles. They are key to technical analysis where the approach to investing is based on cycles or repeating price patterns.
A callable bull/bear contract, or CBBC in short form, is a derivative financial instrument that provides investors with a leveraged investment in underlying assets, which can be a single stock, or an index. CBBC is usually issued by third parties, mostly investment banks, but neither by stock exchanges nor by asset owners. It was first introduced in Europe and Australia in 2001, and it is now popular in United Kingdom, Germany, Switzerland, Italy, and Hong Kong. CBBC is actively traded among investors in Europe and Hong Kong, which is partially due to the fact that it can cater to individual investors' behavioral biases.
Advisors Sentiment survey is a field of market sentiment. Advisors Sentiment was devised by Abe Cohen of Chartcraft in 1963 and is still operated by Chartcraft, now under their brand name of Investors Intelligence. The survey surveys independent investment newsletters. Findings are reported weekly as the percentage of advisors that are bullish, bearish and those that expect a correction. The survey is anecdotal evidence as to extremes in investor confidence, conditions which are often seen at major market turning points.
Put/call ratio is a technical indicator demonstrating investors' sentiment. The ratio represents a proportion between all the put options and all the call options purchased on any given day. The put/call ratio can be calculated for any individual stock, as well as for any index, or can be aggregated. The ratio may be calculated using the numbers of puts and calls or on a dollar-weighted basis.
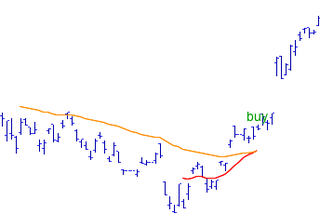
The price action is a method of billable negotiation in the analysis of the basic movements of the price, to generate signals of entry and exit in trades and that stands out for its reliability and for not requiring the use of indicators. It is a form of technical analysis, since it ignores the fundamental factors of a security and looks primarily at the security's price history. What differentiates it from most forms of technical analysis is that its main focus is the relation of a security's current price to its past prices as opposed to values derived from that price history. This past history includes swing highs and swing lows, trend lines, and support and resistance levels.
Smart money index (SMI) or smart money flow index is a technical analysis indicator demonstrating investors' sentiment. The index was invented and popularized by money manager Don Hays. The indicator is based on intra-day price patterns.

Golden Star is a technical signal used in technical analysis of stock prices charts that first was introduced in 2007 by J. Stromberg at the website getagraph.com. The signal derives from the well known Golden Cross that uses the 200 days moving average and the 50 days moving averages to define what has been argued by many to be the best technical signal of them all. Some, however, disagree, and as late as in April 2016 Kate Rooney publish the article "Don't trust the Dow's 'golden cross': Belski", at CNN where Belski states.