Surveying or land surveying is the technique, profession, art and science of determining the terrestrial or three-dimensional positions of points and the distances and angles between them. A land surveying professional is called a land surveyor. These points are usually on the surface of the Earth, and they are often used to establish maps and boundaries for ownership, locations, such as building corners or the surface location of subsurface features, or other purposes required by government or civil law, such as property sales.

A chart is a graphical representation of data, in which "the data is represented by symbols, such as bars in a bar chart, lines in a line chart, or slices in a pie chart". A chart can represent tabular numeric data, functions or some kinds of qualitative structure and provides different info.

A theatre lighting designer works with the director, choreographer, set designer, costume designer, and sound designer to create the lighting, atmosphere, and time of day for the production in response to the text, while keeping in mind issues of visibility, safety, and cost. The LD also works closely with the stage manager or show control programming, if show control systems are used in that production. Outside stage lighting, the job of a Lighting Designer can be much more diverse and they can be found working on rock and pop tours, corporate launches, art installation and on massive celebration spectaculars, for example the Olympic Games opening and closing ceremonies.
A waypoint is an intermediate point or place on a route or line of travel, a stopping point or point at which course is changed, first use of the term tracing to 1880. In modern terms, it most often refers to coordinates which specify one's position on the globe at the end of each "leg" (stage) of an air flight or sea passage, the generation and checking of which are generally done computationally.

Magnetic declination, or magnetic variation, is the angle on the horizontal plane between magnetic north and true north. This angle varies depending on position on the Earth's surface and changes over time.
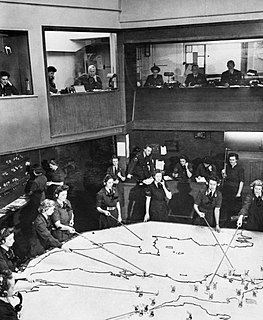
Piloting or pilotage is navigating, using fixed points of reference on the sea or on land, usually with reference to a nautical chart or aeronautical chart to obtain a fix of the position of the vessel or aircraft with respect to a desired course or location. Horizontal fixes of position from known reference points may be obtained by sight or by radar. Vertical position may be obtained by depth sounder to determine depth of the water body below a vessel or by altimeter to determine an aircraft's altitude, from which its distance above the ground can be deduced. Piloting a vessel is usually practiced close to shore or on inland waterways. Pilotage of an aircraft is practiced under visual meteorological conditions for flight.

A scatter plot is a type of plot or mathematical diagram using Cartesian coordinates to display values for typically two variables for a set of data. If the points are coded (color/shape/size), one additional variable can be displayed. The data are displayed as a collection of points, each having the value of one variable determining the position on the horizontal axis and the value of the other variable determining the position on the vertical axis.
A weather map displays various meteorological features across a particular area at a particular point in time and has various symbols which all have specific meanings. Such maps have been in use since the mid-19th century and are used for research and weather forecasting purposes. Maps using isotherms show temperature gradients, which can help locate weather fronts. Isotach maps, analyzing lines of equal wind speed, on a constant pressure surface of 300 or 250 hPa show where the jet stream is located. Use of constant pressure charts at the 700 and 500 hPa level can indicate tropical cyclone motion. Two-dimensional streamlines based on wind speeds at various levels show areas of convergence and divergence in the wind field, which are helpful in determining the location of features within the wind pattern. A popular type of surface weather map is the surface weather analysis, which plots isobars to depict areas of high pressure and low pressure. Cloud codes are translated into symbols and plotted on these maps along with other meteorological data that are included in synoptic reports sent by professionally trained observers.
Tab or tabs may refer to:
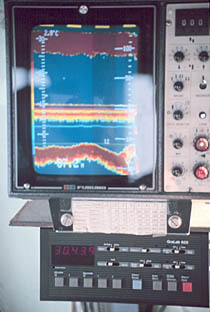
A fishfinder or sounder (Australia) is an instrument used to locate fish underwater by detecting reflected pulses of sound energy, as in sonar. A modern fishfinder displays measurements of reflected sound on a graphical display, allowing an operator to interpret information to locate schools of fish, underwater debris, and the bottom of body of water. Fishfinder instruments are used both by sport and commercial fishermen. Modern electronics allows a high degree of integration between the fishfinder system, marine radar, compass and GPS navigation systems.
A navigation system is a system that aids in navigation. Navigation systems may be entirely on board a vehicle or vessel bridge, or they may be located elsewhere and communicate via radio or other signals with a vehicle or vessel, or they may use a combination of these methods.

Stick charts were made and used by the Marshallese to navigate the Pacific Ocean by canoe off the coast of the Marshall Islands. The charts represented major ocean swell patterns and the ways the islands disrupted those patterns, typically determined by sensing disruptions in ocean swells by islands during sea navigation. Most stick charts were made from the midribs of coconut fronds that were tied together to form an open framework. Island locations were represented by shells tied to the framework, or by the lashed junction of two or more sticks. The threads represented prevailing ocean surface wave-crests and directions they took as they approached islands and met other similar wave-crests formed by the ebb and flow of breakers. Individual charts varied so much in form and interpretation that the individual navigator who made the chart was the only person who could fully interpret and use it. The use of stick charts ended after World War II when new electronic technologies made navigation more accessible and travel among islands by canoe lessened.
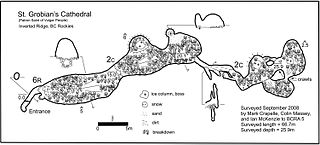
A cave survey is a map of all or part of a cave system, which may be produced to meet differing standards of accuracy depending on the cave conditions and equipment available underground. Cave surveying and cartography, i.e. the creation of an accurate, detailed map, is one of the most common technical activities undertaken within a cave and is a fundamental part of speleology. Surveys can be used to compare caves to each other by length, depth and volume, may reveal clues on speleogenesis, provide a spatial reference for other areas of scientific study and assist visitors with route-finding.
An aeronautical chart is a map designed to assist in navigation of aircraft, much as nautical charts do for watercraft, or a roadmap for drivers. Using these charts and other tools, pilots are able to determine their position, safe altitude, best route to a destination, navigation aids along the way, alternative landing areas in case of an in-flight emergency, and other useful information such as radio frequencies and airspace boundaries. There are charts for all land masses on Earth, and long-distance charts for trans-oceanic travel.
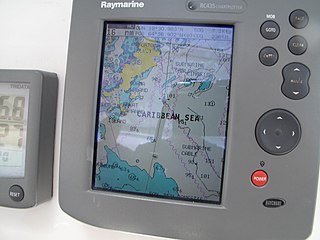
A Chartplotter is a device used in marine navigation that integrates GPS data with an electronic navigational chart (ENC).
Laboratory quality control is designed to detect, reduce, and correct deficiencies in a laboratory's internal analytical process prior to the release of patient results, in order to improve the quality of the results reported by the laboratory. Quality control is a measure of precision, or how well the measurement system reproduces the same result over time and under varying operating conditions. Laboratory quality control material is usually run at the beginning of each shift, after an instrument is serviced, when reagent lots are changed, after calibration, and whenever patient results seem inappropriate. Quality control material should approximate the same matrix as patient specimens, taking into account properties such as viscosity, turbidity, composition, and color. It should be simple to use, with minimal vial to vial variability, because variability could be misinterpreted as systematic error in the method or instrument. It should be stable for long periods of time, and available in large enough quantities for a single batch to last at least one year. Liquid controls are more convenient than lyophilized controls because they do not have to be reconstituted minimizing pipetting error.
Resection is a method for determining an unknown position measuring angles with respect to known positions. Measurements can be made with a compass and topographic map, Theodolite or with a total station using known points of a Geodetic network or landmarks of a map.