Related Research Articles
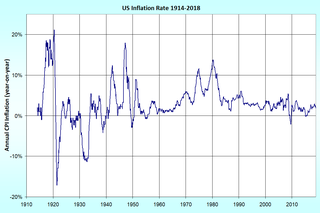
In economics, inflation is a sustained increase in the general price level of goods and services in an economy over a period of time. When the general price level rises, each unit of currency buys fewer goods and services; consequently, inflation reflects a reduction in the purchasing power per unit of money – a loss of real value in the medium of exchange and unit of account within the economy. The measure of inflation is the inflation rate, the annualized percentage change in a general price index, usually the consumer price index, over time. The opposite of inflation is deflation.

In economics, a commodity is an economic good or service that has full or substantial fungibility: that is, the market treats instances of the good as equivalent or nearly so with no regard to who produced them. Most commodities are raw materials, basic resources, agricultural, or mining products, such as iron ore, sugar, or grains like rice and wheat. Commodities can also be mass-produced unspecialized products such as chemicals and computer memory.
Purchasing power parity (PPP) is a way of measuring economic variables in different countries so that irrelevant exchange rate variations do not distort comparisons. Purchasing power exchange rates are such that it would cost exactly the same number of, for example, US dollars to buy euros and then buy a basket of goods in the market as it would cost to purchase the same goods directly with dollars. The purchasing power exchange rate used in this conversion equals the ratio of the currencies' respective purchasing powers.
Purchasing power is the amount of goods and services that can be purchased with a unit of currency. For example, if one had taken one unit of currency to a store in the 1950s, it would have been possible to buy a greater number of items than would be the case today, indicating that the currency had a greater purchasing power in the 1950s. Currency can be either a commodity money, like gold or silver, or fiat money emitted by government sanctioned agencies.
In economics, the GDP deflator is a measure of the level of prices of all new, domestically produced, final goods and services in an economy in a year. GDP stands for gross domestic product, the total monetary value of all final goods and services produced within the territory of a country over a particular period of time.

The Big Mac Index is published by The Economist as an informal way of measuring the purchasing power parity (PPP) between two currencies and provides a test of the extent to which market exchange rates result in goods costing the same in different countries. It "seeks to make exchange-rate theory a bit more digestible".

In economics, marginal cost is the change in the total cost that arises when the quantity produced is incremented by one unit; that is, it is the cost of producing one more unit of a good. Intuitively, marginal cost at each level of production includes the cost of any additional inputs required to produce the next unit. At each level of production and time period being considered, marginal costs include all costs that vary with the level of production, whereas other costs that do not vary with production are fixed and thus have no marginal cost. For example, the marginal cost of producing an automobile will generally include the costs of labor and parts needed for the additional automobile and not the fixed costs of the factory that have already been incurred. In practice, marginal analysis is segregated into short and long-run cases, so that, over the long run, all costs become marginal.Where there are economies of scale, prices set at marginal cost will fail to cover total costs, thus requiring a subsidy. Marginal cost pricing is not a matter of merely lowering the general level of prices with the aid of a subsidy; with or without subsidy it calls for a drastic restructuring of pricing practices, with opportunities for very substantial improvements in efficiency at critical points.
The terms of trade (TOT) is the relative price of imports in terms of exports and is defined as the ratio of export prices to import prices. It can be interpreted as the amount of import goods an economy can purchase per unit of export goods.
Real gross domestic product is a macroeconomic measure of the value of economic output adjusted for price changes. This adjustment transforms the money-value measure, nominal GDP, into an index for quantity of total output. Although GDP is total output, it is primarily useful because it closely approximates the total spending: the sum of consumer spending, investment made by industry, excess of exports over imports, and government spending. Due to inflation, GDP increases and does not actually reflect the true growth in an economy. That is why the GDP must be divided by the inflation rate to get the growth of the real GDP. Different organizations use different types of 'Real GDP' measures, for example the United Nations UNCTAD uses 2005 Constant prices and exchange rates while the FRED uses 2009 constant prices and exchange rates, and recently the World Bank switched from 2005 to 2010 constant prices and exchange rates.
A cost-of-living index is a theoretical price index that measures relative cost of living over time or regions. It is an index that measures differences in the price of goods and services, and allows for substitutions with other items as prices vary.
In economics, a real value, of a good or other entity, is one which has been adjusted for inflation, enabling comparison of quantities as if prices had not changed. Changes in real terms therefore exclude the effect of inflation. In contrast with a real value, a nominal value has not been adjusted for inflation, and so changes in nominal value reflect at least in part the effect of inflation.
In economics and finance, an index is a statistical measure of changes in a representative group of individual data points. These data may be derived from any number of sources, including company performance, prices, productivity, and employment. Economic indices track economic health from different perspectives. Influential global financial indices such as the Global Dow, and the NASDAQ Composite track the performance of selected large and powerful companies in order to evaluate and predict economic trends. The Dow Jones Industrial Average and the S&P 500 primarily track U.S. markets, though some legacy international companies are included. The consumer price index tracks the variation in prices for different consumer goods and services over time in a constant geographical location, and is integral to calculations used to adjust salaries, bond interest rates, and tax thresholds for inflation. The GDP Deflator Index, or real GDP, measures the level of prices of all new, domestically produced, final goods and services in an economy. Market performance indices include the labour market index/job index and proprietary stock market index investment instruments offered by brokerage houses.
Alpha is a measure of the active return on an investment, the performance of that investment compared with a suitable market index. An alpha of 1% means the investment's return on investment over a selected period of time was 1% better than the market during that same period; a negative alpha means the investment underperformed the market. Alpha, along with beta, is one of two key coefficients in the capital asset pricing model used in modern portfolio theory and is closely related to other important quantities such as standard deviation, R-squared and the Sharpe ratio.
In economics, supply is the amount of something that firms, producers, labourers, providers of financial assets, or other economic agents are willing and able to provide to the marketplace. Supply is often plotted graphically with the quantity provided plotted horizontally and the price plotted vertically.
In economics, the Törnqvist index is a price or quantity index. In practice, Törnqvist index values are calculated for consecutive periods, then these are strung together, or "chained". Thus, the core calculation does not refer to a single base year.
Production is a process of combining various material inputs and immaterial inputs in order to make something for consumption. It is the act of creating an output, a good or service which has value and contributes to the utility of individuals.
Productivity in economics is the ratio of what is produced to what is used in producing it. Productivity is the measure on production efficiency. A productivity model is a measurement method which is used in practice for measuring productivity. A productivity model must be able to compute Output / Input when there are many different outputs and inputs.
A chained volume series is a series of economic data from successive years, put in real terms by computing the production volume for each year in the prices of the preceding year, and then 'chain linking' the data together to obtain a time-series of production figures from which the effects of price changes have, at least in theory, been removed. In other words, from the raw GDP or GNP data, which reflect changes in both production volume and prices, a series is obtained which reflects only production volume.
This glossary of economics is a list of definitions of terms and concepts used in economics, its sub-disciplines, and related fields.
References
External references: OECD glossary entry
| This economics-related article is a stub. You can help Wikipedia by expanding it. |