$142.9billion (2015) (social security, 25.9%; income and capital gains, 23.6%; value-added sales tax, 20.1%; trade and duties, 15.1%; financial tax, 6.3%; excise and other, 9.0%)[25]
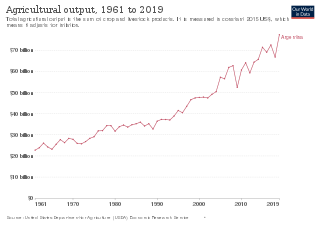
Argentina benefits from rich natural resources. Argentina's economic performance has historically been very uneven, with high economic growth alternating with severe recessions, particularly since the late twentieth century. Income maldistribution and poverty have increased since this period. Early in the twentieth century, Argentina had one of the ten highest per capita GDP levels globally. It was on par with Canada and Australia, and had surpassed both France and Italy.
Argentina's currency declined by about 50% in 2018 to more than 38 Argentine pesos per U.S. Dollar. As of that year, it is under a stand-by program from the International Monetary Fund. In 2019, the currency fell further by 25%. In 2020, it fell by 90%, in 2021, 68%,[28] and a further 52% in 2022 (until July 20).[29]
Argentina is considered an emerging market by the FTSE Global Equity Index (2018), and one of the G-20 major economies. In 2021, MCSI re-classified Argentina as a standalone market due to prolonged severe capital controls.[30]
Before the 1880s, Argentina was a relatively isolated backwater, dependent on the salted meat, wool, leather, and hide industries for both the more significant part of its foreign exchange and the generation of domestic income and profits. The Argentine economy began to experience swift growth after 1880 through the export of livestock and grain raw materials, and British and French investment, marking the beginning of a fifty-year era of significant economic expansion and mass European immigration.
From 1880 to 1905, this expansion resulted in a 7.5-fold growth in GDP during its most vigorous period, averaging about 8% annually. One important measure of development, GDP per capita, rose from 35% of the United States average to about 80% during that period. Growth then slowed considerably, such that by 1941 Argentina's real per capita GDP was roughly half that of the U.S. Even so, from 1890 to 1950, the country's per capita income was similar to that of Western Europe; although income in Argentina remained considerably less evenly distributed. According to a study by Baten and Pelger and Twrdek (2009), where the authors compare anthropometric values, i.e., height with real wages, Argentina's GDP increased for the decades after 1870. Before 1910 however, the heights have been left unaffected. This, in turn, suggests that the increase in the population's welfare did not occur during the income expansion of the given period.
The Great Depression caused Argentine GDP to fall by a fourth between 1929 and 1932. Having recovered its lost ground by the late 1930s partly through import substitution, the economy continued to grow modestly during World War II (contrary to the recession caused by the previous world war). The war led to reduced availability of imports and higher prices for Argentine exports that combined to create a US$1.6 billion cumulative surplus, a third of which was blocked as inconvertible deposits in the Bank of England by the Roca–Runciman Treaty. Benefiting from innovative self-financing and government loans alike, value-added in manufacturing nevertheless surpassed that of agriculture for the first time in 1943, employed over 1 million by 1947, and allowed the need for imported consumer goods to decline from 40% of the total to 10% by 1950.
The populist administration of Juan Perónnationalized the Central Bank, railways, and other strategic industries and services from 1945 to 1955. Inflation first became a chronic problem during this period, averaging 26% annually from 1944 to 1974. The GDP per capita increased until the early 1950s, where commodity prices dropped and the effects of nationalization led to stagnation.[31][32][33]
The economy continued to decline during the military dictatorship from 1976 to 1983 and for some time afterward. The dictatorship's chief economist, José Alfredo Martínez de Hoz, advanced a controversial, neoliberal policy of financial liberalization that increased the debt burden and failed to curb inflation, which reached 344% in 1983.[34] While black markets and shortages disappeared as price and exchange controls were removed,[35] the currency devalued tenfold[36] and the economy failed to grow.
External economic shocks and a dependency on volatile short-term capital and debt to maintain the overvalued fixed exchange rate diluted benefits, causing erratic economic growth from 1995 and the eventual collapse in 2001. That year and the next, the economy suffered its sharpest decline since 1930; by 2002, Argentina had defaulted on its debt. Its GDP had declined by nearly 20% in four years, unemployment reached 25%, and the peso had depreciated 70% after being devalued and floated.
The economy nearly doubled from 2002 to 2011, growing an average of 7.1% annually and around 9% for five consecutive years between 2003 and 2007. Real wages rose by around 72% from their low point in 2003 to 2013. The global recession did affect the economy in 2009, with growth slowing to nearly zero; but high economic growth then resumed, and GDP expanded by around 9% in both 2010 and 2011. Foreign exchange controls, austerity measures, persistent inflation, and downturns in Brazil, Europe, and other important trade partners, contributed to slower growth beginning in 2012, however. Growth averaged just 1.3% from 2012 to 2014, and rose to 2.4% in 2015.
The Argentine government bond market is based on GDP-linked bonds, and investors, both foreign and domestic, netted record yields amid renewed growth. Argentine debt restructuring offers in 2005 and 2010 resumed payments on the majority of its almost US$100 billion in defaulted bonds and other debt from 2001.
Historical growth of Argentina from 1961 to 2016
Holdouts controlling 7% of the bonds, including some small investors, hedge funds, and vulture funds led by Paul Singer'sCayman Islands-based NML Capital Limited, rejected the 2005 and 2010 offer to exchange their defaulted bonds. Singer, who demanded US$832 million for Argentine bonds purchased for US$49 million in the secondary market in 2008, attempted to seize Argentine government assets abroad and sued to stop payments from Argentina to the 93% who had accepted the earlier swaps despite the steep discount. According to estimates by Morgan Stanley, bondholders who instead accepted the 2005 offer of 30 cents on the dollar had by 2012 received returns of about 90%. Argentina settled with virtually all holdouts in February 2016 at the cost of US$9.3 billion; NML received US$2.4 billion, a 392% return on the original value of the bonds.
While the Argentine Government considers debt leftover from illegitimate governments unconstitutional odious debt, it has continued servicing this debt despite the annual cost of around US$14 billion and despite being nearly locked out of international credit markets with annual bond issues since 2002 averaging less than US$2 billion (which precludes most debt rollover).
Nevertheless, Argentina has continued to hold successful bond issues, as the country's stock market, consumer confidence, and overall economy continue to grow. The country's successful, US$16.5 billion bond sale in April 2016 was the largest in emerging market history.
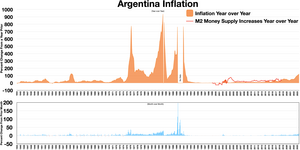
In May 2018, the official estimated inflation had peaked up to 25 percent a year, and on 4 May Argentina's central bank raised interest rates on pesos to 40 percent from 27.25 percent, which is the highest in the world, since the national currency had lost 18% of its value since the beginning of the year.
In 2019 the inflation was considered the highest in 28 years according to the index, ascending to 53.8%.
To the cause of the quarantine in 2020, in April, 143,000 SMEs will not be able to pay salaries and fixed expenses for the month, even with government assistance, so they will have to borrow or increase their capital contribution, and approximately 35,000 companies consider closing their business. even so, the president remains firm in his decision to maintain the state of total quarantine. Despite cuts in the payment chain, some project 180 total days and calculate 5% of companies that fell in May.
In February 2023, the rate of inflation in Argentina surpassed 100% for the first time since the early 1990s.[37]
In December 2023, Argentina was seeing a projected 200% annualized inflation rate of the Argentine Peso. With this inflation in mind, Javier Milei (Argentina's newly sworn in president as of 10 December 2023, with 55.69% of the vote in the runoff election[38]) weakened the Argentine Peso by 50% to 800 per dollar, along with cuts to energy subsidies, cancellations of public works, and more[39]. Although an impactful policy, Argentinians knew Milei would enact significant economic policies, as he openly supported extreme economic policies as a self-described anarcho-capitalist[40].
Argentina's 2023 annual inflation was the highest in the world at 211.4%.[41]
Data
Argentina Inflation
Year over Year inflation
M2 money supply increases Year over Year
Month over Month inflation
The following table shows the main economic indicators in 1980–2023 (with IMF staff estimates in 2024–2028). Inflation below 5% is in green.[42]
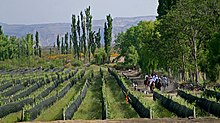
Soy field in Argentina's fertile Pampas. The versatile legume makes up about half the nation's crop production.Vineyard in Mendoza Province. The country is the fifth largest producer in the world.
Argentina is one of the world's major agricultural producers, ranking among the top producers in most of the following, exporters of beef, citrus fruit, grapes, honey, maize, sorghum, soybeans, squash, sunflower seeds, wheat, and yerba mate.[44] Agriculture accounted for 9% of GDP in 2010, and around one fifth of all exports (not including processed food and feed, which are another third). Commercial harvests reached 103 million tons in 2010, of which over 54million were oilseeds (mainly soy and sunflower), and over 46 million were cereals (mainly maize, wheat, and sorghum).[45]
In 2018, Argentina was the 3rd largest producer of soy in the world, with 37.7 million tons produced (behind only the US and Brazil); the 4th largest producer of maize in the world, with 43.5 million tons produced (behind only the US, China and Brazil); the 12th largest producer of wheat in the world, with 18.5 million tons produced; the 11th largest producer in the world of sorghum, with 1.5 million tons produced; the 10th largest producer of grape in the world, with 1.9 million tons produced, besides having produced 19 million tons of sugarcane, mainly in the province of Tucumán[47] - Argentina produces near 2 million tons of sugar with the produced cane. In the same year Argentina produced 4.1 million tons of barley, being one of the 20 largest producers in the world of this cereal.[48] The country is also one of the world's largest producers of sunflower seed: in 2010, it was the 3rd largest producer in the world with 2.2 million tons.[49] In 2018, Argentina also produced 2.3 million tons of potato, almost 2 million tons of lemon, 1.3 million tons of rice, 1 million tons of orange, 921 thousand tons of peanut, 813 thousand tons of cotton, 707 thousand tons of onion, 656 thousand tons of tomato, 565 thousand tons of pear, 510 thousand tons of apple, 491 thousand tons of oats, 473 thousand tons of beans, 431 thousand tons of tangerine, 302 thousand tons of yerba mate, 283 thousand tons of carrot, 226 thousand tons of peach, 194 thousand tons of cassava, 174 thousand tons of olives, 174 thousand tons of banana, 148 thousand tons of garlic, 114 thousand tons of grapefruit, 110 thousand tons of artichoke, in addition to smaller productions of other agricultural products.[50]
In livestock, Argentina was, in 2019, the 4th world producer of beef, with a production of 3 million tons (only behind USA, Brazil and China), the 4th world producer of honey, the 10th world producer of wool, the world's 13th largest producer of chicken meat, the world's 23rd largest producer of pork, the 18th largest producer of cow's milk and the world's 14th largest producer of chicken egg.[51]
Soy and its byproducts, mainly animal feed and vegetable oils, are major export raw materials with one fourth of the total; cereals added another 10%. Cattle-raising is also a major industry, though mostly for domestic consumption; beef, leather and dairy were 5% of total exports.[52] Sheep-raising and wool are important in Patagonia, though these activities have declined by half since 1990. Biodiesel, however, has become one of the fastest growing agro-industrial activities, with over US$2 billion in exports in 2011.[52]
Government policy towards the lucrative agrarian sector is a subject of, at times, contentious debate in Argentina. A grain embargo by farmers protesting an increase in export taxes for their products began in March 2008,[56] and, following a series of failed negotiations, strikes and lockouts largely subsided only with the 16 July, defeat of the export tax-hike in the Senate.[57]
Argentine fisheries bring in about a million tons of catch annually,[58] and are centered on Argentine hake, which makes up 50% of the catch; pollock, squid, and centolla crab are also widely harvested. Forestry has long history in every Argentine region, apart from the pampas, accounting for almost 14 million m³ of roundwood harvests.[59]Eucalyptus, pine, and elm (for cellulose) are also grown, mainly for domestic furniture, as well as paper products (1.5million tons). Fisheries and logging each account for 2% of exports.[58]
The Vaca Muertatight oil (shale oil) field holds 2.58×10m (16.2×10^bbl) of oil and 8.7×10^m (308×10^cuft) of natural gas. It is estimated to be the third largest in the world.
In mining, in 2019, Argentina was the 4th largest world producer of lithium,[63] the 9th largest world producer of silver,[64] the 17th largest world producer of gold[65] and the 7th largest world producer of boron.[66]
The World Bank lists the top producing countries each year, based on the total value of production. According to the 2019 list, Argentina has the 31st most valuable industry in the world (57.7 billion dollars), behind Mexico, Brazil and Venezuela, but ahead of Colombia, Peru and Chile.[67]
In 2019, Argentina was the 31st world producer of steel, the 28th producer of vehicles, the 22nd world producer of beer, the 4th world producer of soybean oil and the 3rd world producer of sunflower oil, among other industrial products.[68][69][70][71]
Manufacturing is the largest single sector in the nation's economy (15% of GDP), and is well-integrated into Argentine agriculture, with half the nation's industrial exports being agricultural in nature.[52] Based on food processing and textiles during its early development in the first half of the 20th century, industrial production has become highly diversified in Argentina.[72] Leading sectors by production value are: Food processing and beverages; motor vehicles and auto parts; refinery products, and biodiesel; chemicals and pharmaceuticals; steel and aluminium; and industrial and farm machinery; electronics and home appliances. These latter include over three million big ticket items, as well as an array of electronics, kitchen appliances and cellular phones, among others.[58]
Argentina's auto industry produced 791,000 motor vehicles in 2013, and exported 433,000 (mainly to Brazil, which in turn exported a somewhat larger number to Argentina); Argentina's domestic new auto market reached a record 964,000 in 2013.[73] This marked a peak in vehicle production, by 2021 production had fallen to 434,753 vehicles.[74] Vehicles remain Argentina's top export to Brazil, accounting for $3.1bil in exports in 2021.[75]
Most manufacturing is organized in the 314 industrial parks operating nationwide as of 2012, a fourfold increase over the past decade.[76] Nearly half the industries are based in the Greater Buenos Aires area, although Córdoba, Rosario, and Ushuaia are also significant industrial centers; the latter city became the nation's leading center of electronics production during the 1980s.[77] The production of computers, laptops, and servers grew by 160% in 2011, to nearly 3.4 million units, and covered two-thirds of local demand.[78] Argentina has also become an important manufacturer of cell phones, providing about 80% of all devices sold in the country.[79]Farm machinery, another important rubric historically dominated by imports, was similarly replaced by domestic production, which covered 60% of demand by 2013.[80] Production of cell phones, computers, and similar products is actually an "assembly" industry, with the majority of the higher technology components being imported, and the designs of products originating from foreign countries. High labour costs for Argentina assembly work tend to limit product sales penetration to Latin America, where regional trade treaties exist.[citation needed]
Construction permits nationwide covered over 15 million m2 (160million ft²) in 2013. The construction sector accounts for over 5% of GDP, and two-thirds of construction is for residential buildings.[81]
Argentine electric output totaled over 133billion kWh in 2013.[58] This was generated in large part through well developed natural gas and hydroelectric resources. Nuclear energy is also of high importance,[82] and the country is one of the largest producers and exporters, alongside Canada and Russia of cobalt-60, a radioactiveisotope widely used in cancer therapy.
Services
The service sector is the largest contributor to total GDP, accounting for over 60%. Argentina enjoys a diversified service sector, which includes well-developed social, corporate, financial, insurance, real estate, transport, communication services, and tourism.
The telecommunications sector has been growing at a fast pace, and the economy benefits from widespread access to communications services. These include: 77% of the population with access to mobile phones,[83] 95% of whom use smartphones;[84] Internet (over 32 million users, or 75% of the population);[85] and broadband services (accounting for nearly all 14 million accounts).[86] Regular telephone services, with 9.5million lines,[87] and mail services are also robust. Total telecom revenues reached more than $17.8billion in 2013,[88] and while only one in three retail stores in Argentina accepted online purchases in 2013 E-commerce reached US$4.5billion in sales.[89]
Trade in services remained in deficit, however, with US$15billion in service exports in 2013 and US$19billion in imports.[23]Business Process Outsourcing became the leading Argentine service export, and reached US$3billion.[90] Advertising revenues from contracts abroad were estimated at over US$1.2billion.[91]
Tourism is an increasingly important sector and provided 4% of direct economic output (over US$17billion) in 2012; around 70% of tourism sector activity by value is domestic.[92]
Argentine banking, whose deposits exceeded US$120billion in December 2012,[93] developed around public sector banks, but is now dominated by the private sector. The private sector banks account for most of the 80 active institutions (over 4,000 branches) and holds nearly 60% of deposits and loans, and as many foreign-owned banks as local ones operate in the country.[94] The largest bank in Argentina by far, however, has long been the public Banco de la Nación Argentina. Not to be confused with the Central Bank, this institution now accounts for 30% of total deposits and a fifth of its loan portfolio.[94]
During the 1990s, Argentina's financial system was consolidated and strengthened. Deposits grew from less than US$15billion in 1991 to over US$80billion in 2000, while outstanding credit (70% of it to the private sector) tripled to nearly US$100billion.[95]
The banks largely lent US dollars and took deposits in Argentine pesos, and when the peso lost most of its value in early 2002, many borrowers again found themselves hard pressed to keep up. Delinquencies tripled to about 37%.[95] Over a fifth of deposits had been withdrawn by December 2001, when Economy MinisterDomingo Cavallo imposed a near freeze on cash withdrawals. The lifting of the restriction a year later was bittersweet, being greeted calmly, if with some umbrage, at not having these funds freed at their full U.S. dollar value.[96] Some fared worse, as owners of the now-defunct Velox Bank defrauded their clients of up to US$800million.[97]
Credit in Argentina is still relatively tight. Lending has been increasing 40% a year since 2004, and delinquencies are down to less than 2%.[93] Still, credit outstanding to the private sector is, in real terms, slightly below its 1998 peak,[95] and as a percent of GDP (around 18%)[93] quite low by international standards. The prime rate, which had hovered around 10% in the 1990s, hit 67% in 2002. Although it returned to normal levels quickly, inflation, and more recently, global instability, have been affecting it again. The prime rate was over 20% for much of 2009, and around 17% since the first half of 2010.[93]
Partly a function of this and past instability, Argentines have historically held more deposits overseas than domestically. The estimated US$173billion in overseas accounts and investment exceeded the domestic monetary base (M3) by nearly US$10billion in 2012.[23]
According to World Economic Forum's 2017 Travel & Tourism Competitiveness Report, tourism generated over US$22billion, or 3.9% of GDP, and the industry employed more than 671,000 people, or approximately 3.7% of the total workforce.[98] Tourism from abroad contributed US$5.3billion, having become the third largest source of foreign exchange in 2004. Around 5.7million foreign visitors arrived in 2017, reflecting a doubling in visitors since 2002 despite a relative appreciation of the peso.[92]
Argentines, who have long been active travelers within their own country,[99] accounted for over 80%, and international tourism has also seen healthy growth (nearly doubling since 2001).[92] Stagnant for over two decades, domestic travel increased strongly in the last few years,[100] and visitors are flocking to a country seen as affordable, exceptionally diverse, and safe.[101]
Foreign tourism, both to and from Argentina, is increasing as well. INDEC recorded 5.2 million foreign tourist arrivals and 6.7million departures in 2013; of these, 32% arrived from Brazil, 19% from Europe, 10% from the United States and Canada, 10% from Chile, 24% from the rest of the Western Hemisphere, and 5% from the rest of the world. Around 48% of visitors arrived by commercial flight, 40% by motor travel (mainly from neighboring Brazil), and 12% by sea.[102]Cruise liner arrivals are the fastest growing type of foreign tourism to Argentina; a total of 160 liners carrying 510,000 passengers arrived at the Port of Buenos Aires in 2013, an eightfold increase in a just a decade.[103]
Electricity generation in Argentina totaled 133.3 billionkWh in 2013.[58] The electricity sector in Argentina constitutes the third largest power market in Latin America. It mainly still relies on centralised generation by natural gas power generation (51%), hydroelectricity (28%), and oil-fired generation (12%).[104]Resource estimates of unconventionalshale gas and tight oil in the Vaca Muerta oil field and elsewhere are estimated to be the world's third-largest.[60] In 2017, Argentina was the 18th largest producer in the world (and the largest producer in Latin America) of natural gas.[105] In 2020, the country was the 28th largest producer of oil in the world, extracting 70,000m3 (440,300bbl) per day.[106]
Despite the country's large untapped wind and solar potential new renewable energy technologies and distributed energy generation are barely exploited. Wind energy is the fastest growing among new renewable sources. Fifteen wind farms have been developed since 1994 in Argentina, the only country in the region to produce wind turbines. The 55 MW of installed capacity in these in 2010 will increase by 895 MW upon the completion of new wind farms begun that year.[107]Solar power is being promoted with the goal of expanding installed solar capacity from 6 MW to 300, and total renewable energy capacity from 625 MW to 3,000 MW.[108] At the end of 2021 Argentina was the 21st country in the world in terms of installed hydroelectric power (11.3 GW), the 26th country in the world in terms of installed wind energy (3.2 GW) and the 43rd country in the world in terms of installed solar energy (1.0 GW).[109]
Argentina is in the process of commissioning large centralised energy generation and transmission projects. An important number of these projects are being financed by the government through trust funds, while independent private initiative is limited as it has not fully recovered yet from the effects of the Argentine economic crisis.
The first of the three nuclear reactors was inaugurated in 1974, and in 2015 nuclear power generated 5% of the country's energy output.[104]
The electricity sector was unbundled in generation, transmission and distribution by the reforms carried out in the early 1990s. Generation occurs in a competitive and mostly liberalized market, in which 75% of the generation capacity is owned by private utilities. In contrast, the transmission and distribution sectors are highly regulated and much less competitive than generation.
Argentina's transport infrastructure is relatively advanced, and at a higher standard than the rest of Latin America.[110] There are over 230,000km (144,000mi) of roads (not including private rural roads) of which 72,000km (45,000mi) are paved,[111] and 2,800 kilometres (1,700mi) are expressways, many of which are privatized tollways.[112] Having tripled in length in the last decade, multilane expressways now connect several major cities with more under construction.[112][113] Expressways are, however, currently inadequate to deal with local traffic,[113] as over 12million motor vehicles were registered nationally as of 2012 (the highest, proportionately, in the region).[114]
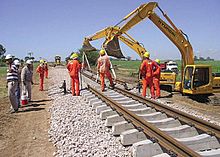
The railway network has a total length of 37,856 kilometres (23,523mi), though at the network's peak this figure was 47,000km (29,204mi).[53][115] After decades of declining service and inadequate maintenance, most intercity passenger services shut down in 1992 following the privatization of the country's railways and the breaking up of the state rail company, while thousands of kilometers fell into disuse. Outside Greater Buenos Aires most rail lines still in operation are freight related, carrying around 23 million tons a year.[58][116] The metropolitan rail lines in and around Buenos Aires remained in great demand owing in part to their easy access to the Buenos Aires Underground, and the commuter rail network with its 833 kilometres (518mi) length carries around 1.4million passengers daily.[117]
Inaugurated in 1913, the Buenos Aires Underground was the first underground rail system built in Latin America, the Spanish speaking world and the Southern Hemisphere.[129] No longer the most extensive in South America, its 60 kilometres (37mi) of track carry a million passengers daily.[130]
Argentina has around 11,000km (6,835mi) of navigable waterways, and these carry more cargo than do the country's freight railways.[131] This includes an extensive network of canals, though Argentina is blessed with ample natural waterways as well, the most significant among these being the Río de la Plata, Paraná, Uruguay, Río Negro, and Paraguay rivers. The Port of Buenos Aires, inaugurated in 1925, is the nation's largest; it handled 11million tons of freight and transported 1.8million passengers in 2013.[103]
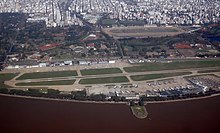
Aerolíneas Argentinas is the country's main airline, providing both extensive domestic and international service. LADE is a military-run commercial airline that flies extensive domestic services. The nation's 33 airports handled air travel totalling 25.8million passengers in 2013, of which domestic flights carried over 14.5million; the nation's two busiest airports, Jorge Newbery and Ministro Pistarini International Airports, boarded around 9million flights each.[132]
In 2022, Argentina was the 44th largest exporter (by merchandise exports) in the world (US$88 billion), 0.4% of the global total.[133]
Argentine exports are fairly well diversified. However, although agricultural raw materials are over 20% of the total exports, agricultural goods still account for over 50% of exports when processed foods are included. Soy products alone (soybeans, vegetable oil) account for almost one fourth of the total. Cereals, mostly maize and wheat, which were Argentina's leading export during much of the twentieth century, make up less than one tenth now.[134]
Industrial goods today account for over a third of Argentine exports. Motor vehicles and auto parts are the leading industrial export, and over 12% of the total merchandise exports. Chemicals, steel, aluminum, machinery, and plastics account for most of the remaining industrial exports. Trade in manufactures has historically been in deficit for Argentina, however, and despite the nation's overall trade surplus, its manufacturing trade deficit exceeded US$30 billion in 2011.[135] Accordingly, the system of non-automatic import licensing was extended in 2011,[136] and regulations were enacted for the auto sector establishing a model by which a company's future imports would be determined by their exports (though not necessarily in the same rubric).[137]
A net energy importer until 1987, Argentina's fuel exports began increasing rapidly in the early 1990s and today account for about an eighth of the total; refined fuels make up about half of that. Exports of crude petroleum and natural gas have recently been around US$3billion a year.[134] Rapidly growing domestic energy demand and a gradual decline in oil production, resulted in a US$3 billion energy trade deficit in 2011 (the first in 17 years)[138] and a US$6 billion energy deficit in 2013.[139]
Argentine imports have historically been dominated by the need for industrial and technological supplies, machinery, and parts, which have averaged US$50billion since 2011 (two-thirds of total imports). Consumer goods including motor vehicles make up most of the rest.[134]Trade in services has historically in deficit for Argentina, and in 2013 this deficit widened to over US$4billion with a record US$19billion in service imports.[23] The nation's chronic current account deficit was reversed during the 2002 crisis, and an average current account surplus of US$7billion was logged between 2002 and 2009; this surplus later narrowed considerably, and has been slightly negative since 2011.[140]
Major Trade Partners
The following table shows the largest trading partners for Argentina in 2022 by total trade value in billions of USD.[141]
Foreign direct investment in Argentina is divided nearly evenly between manufacturing (36%), natural resources (34%), and services (30%). The chemical and plastics sector (10%) and the automotive sector (6%) lead foreign investment in local manufacturing; oil and gas (22%) and mining (5%), in natural resources; telecommunications (6%), finance (5%), and retail trade (4%), in services.[142] Spain was the leading source of foreign direct investment in Argentina, accounting for US$22billion (28%) in 2009; the U.S. was the second leading source, with $13billion (17%);[142] and China grew to become the third-largest source of FDI by 2011.[143] Investments from the Netherlands, Brazil, Chile, and Canada have also been significant; in 2012, foreign nationals held a total of around US$112billion in direct investment.[23]
Several bilateral agreements play an important role in promoting U.S. private investment. Argentina has an Overseas Private Investment Corporation (OPIC) agreement and an active program with the U.S. Export-Import Bank. Under the 1994 U.S.–Argentina Bilateral Investment Treaty, U.S. investors enjoy national treatment in all sectors except shipbuilding, fishing, nuclear-power generation, and uranium production. The treaty allows for international arbitration of investment disputes.
Foreign direct investment (FDI) in Argentina, which averaged US$5.7billion from 1992 to 1998 and reached in US$24billion in 1999 (reflecting the purchase of 98% of YPF stock by Repsol), fell during the crisis to US$1.6billion in 2003.[144] FDI then accelerated, reaching US$8billion in 2008.[145] The global crisis cut this figure to US$4billion in 2009; but inflows recovered to US$6.2billion in 2010.[146] and US$8.7billion in 2011, with FDI in the first half of 2012 up by a further 42%.[147]
FDI volume remained below the regional average as a percent of GDP even as it recovered, however; Kirchner Administration policies and difficulty in enforcing contractual obligations had been blamed for this modest performance.[148] The nature of foreign investment in Argentina nevertheless shifted significantly after 2000, and whereas over half of FDI during the 1990s consisted in privatizations and mergers and acquisitions, foreign investment in Argentina became the most technologically oriented in the region – with 51% of FDI in the form of medium and high-tech investment (compared to 36% in Brazil and 3% in Chile).[149]
Issues
The economy recovered strongly from the 2001–02 crisis, and was the 21st largest in purchasing power parity terms in 2011; its per capita income on a purchasing power basis was the highest in Latin America.[150] A lobby representing US creditors who refused to accept Argentina's debt-swap programmes has campaigned to have the country expelled from the G20.[151] These holdouts include numerous vulture funds which had rejected the 2005 offer, and had instead resorted to the courts in a bid for higher returns on their defaulted bonds. These disputes had led to a number of liens against central bank accounts in New York and, indirectly, to reduced Argentine access to international credit markets.[152]
The government under President Mauricio Macri announced to be seeking a new loan from the International Monetary Fund in order to avoid another economic crash similar to the one in 2001.[153] The May 2018 announcement comes at a time of high inflation and falling interest rates.[153] The loan would reportedly be worth $30 billion.[154]
Following 25 years of boom and bust stagnation, Argentina's economy doubled in size from 2002 to 2013,[150] and officially, income poverty declined from 54% in 2002 to 5% by 2013;[155] an alternative measurement conducted by CONICET found that income poverty declined instead to 15.4%.[156] Poverty measured by living conditions improved more slowly, however, decreasing from 17.7% in the 2001 Census to 12.5% in the 2010 Census.[157] Argentina's unemployment rate similarly declined from 25% in 2002 to an average of around 7% since 2011 largely because of both growing global demand for Argentine raw materials and strong growth in domestic activity.[158]
Given its ongoing dispute with holdout bondholders, the government has become wary of sending assets to foreign countries (such as the presidential plane, or artworks sent to foreign exhibitions) in case they might be impounded by courts at the behest of holdouts.[159]
The government has been accused of manipulating economic statistics.[160]
Reliability of official CPI estimates
Official CPI inflation figures released monthly by INDEC have been a subject of political controversy since 2007 through 2015.[158][161][162] Official inflation data are disregarded by leading union leaders, even in the people sector, when negotiating pay rises.[163] Some private-sector estimates put inflation for 2010 at around 25%, much higher than the official 10.9% rate for 2010.[163] Inflation estimates from Argentina's provinces are also higher than the government's figures.[163] The government backed up the validity of its data, but has called in the International Monetary Fund to help it design a new nationwide index to replace the current one.[163]
The official government CPI is calculated based on 520 products, however the controversy arises from these products not being specified, and thus how many of those products are subject to price caps and subsidies.[164] Economic analysts have been prosecuted for publishing estimates that disagree with official statistics.[165] The government enforces a fine of up to 500,000 pesos for providing what it calls "fraudulent inflation figures".[163] Beginning in 2015, the government again began to call for competitive bids from the private sector to provide a weekly independent inflation index.[166]
Inflation
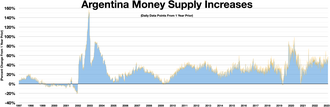
Argentina Money Supply Increases Year over Year Daily data points
High inflation has been a weakness of the Argentine economy for decades.[168] Inflation has been unofficially estimated to be running at around 25% annually since 2008, despite official statistics indicating less than half that figure;[169][170] these would be the highest levels since the 2002 devaluation.[168] A committee was established in 2010 in the Argentine Chamber of Deputies by opposition Deputies Patricia Bullrich, Ricardo Gil Lavedra, and others to publish an alternative index based on private estimates.[171] Food price increases, particularly that of beef, began to outstrip wage increases in 2010, leading Argentines to decrease beef consumption per capita from 69kg (152lb) to 57kg (125lb) annually and to increase consumption of other meats.[168][172]
Consumer inflation expectations of 28 to 30% led the national mint to buy banknotes of its highest denomination (100 pesos) from Brazil at the end of 2010 to keep up with demand. The central bank pumped at least 1billion pesos into the economy in this way during 2011.[173]
As of June 2015[update], the government said that inflation was at 15.3%;[174] approximately half that of some independent estimates.[175] Inflation remained at around 18.6% in 2015 according to an International Monetary Fund estimate;[176] but following a sharp devaluation enacted by the Mauricio Macri administration on 17 December, inflation reignited during the first half of 2016 – reaching 42% according to the Finance Ministry.[177]
Supermarkets in Argentina have adopted electronic price tags, allowing prices to be updated quicker.[178]
In the second quarter of 2019, reports suggested that the economy of the country is sinking, inflation is rising and the currency is depreciating. Despite the country receiving one of the largest IMF financial support programmes ever given to any nation, Argentina's poverty rose to 32% from 26% the previous year.[179][180] In August 2019, as an attempt to stabilise the economy, the government decided to impose restrictions on foreign currency purchases.[181]
The inflation rate in Argentina rose to 52.3 percent in February 2022 from 50.7 percent in the prior month, the steepest increase since September.[182] In August the interest rate was hiked to 69.5% as inflation further deteriorated hitting a 20-year high at 70% driven by many factors among them the 2021–2022 inflation surge and forecasted to top 90% by the end of the year.[183] Inflation hit past 100% in February 2023 for the first time since 1991.[184][185] On October 12, 2023, Argentina's central bank again increased the benchmark interest rate from 118% to 133% since September's inflation report (12.7% monthly and 138% annually) was worse than forecasted.[186]
Argentine workers have protested the inflation holding funerals to mourn the "death of (their) wages". Photographer Irina Werning wrote the following sentence "inflation destroys savings, impedes planning, and discourages investment." taking about the protest [187]
Income distribution
In relation to other Latin American countries, Argentina has a moderate to low level of income inequality. Its Gini coefficient is of about 0.427 (2014).[188] The social gap is worst in the suburbs of the capital, where beneficiaries of the economic rebound live in gated communities, and many of the poor live in slums known as villas miserias.[189]
In the mid-1970s, the most affluent 10% of Argentina's population had an income 12 times that of the poorest 10%. That figure had grown to 18 times by the mid-1990s, and by 2002, the peak of the crisis, the income of the richest segment of the population was 43 times that of the poorest.[189] These heightened levels of inequality had improved to 26 times by 2006,[190] and to 16 times at the end of 2010.[191] Economic recovery after 2002 was thus accompanied by significant improvement in income distribution: in 2002, the richest 10% absorbed 40% of all income, compared to 1.1% for the poorest 10%;[192] by 2010, the former received 29% of income, and the latter, 1.8%.[191]
Argentina has an inequality-adjusted human development index of 0.729, compared to 0.578 and 0.709 for neighboring Brazil and Chile, respectively.[193] The 2010 Census found that poverty by living conditions still affect 1 in 8 inhabitants, however;[157] and while the official, household survey income poverty rate (based on U$S 100 per person per month, net) was 4.7% in 2013,[155] the National Research Council estimated income poverty in 2010 at 22.6%,[156] with private consulting firms estimating that in 2011 around 21% fell below the income poverty line.[194] The World Bank estimated that, in 2013, 3.6% subsisted on less than US$3.10 per person per day.[195]
The economy of Brazil is historically the largest in Latin America and the Southern Hemisphere in nominal terms. The Brazilian economy is the second largest in the Americas. It is an upper-middle income developing mixed economy. In 2023, according to International Monetary Fund (IMF), Brazil has the 9th largest gross domestic product (GDP) in the world and has the 8th largest purchasing power parity in the world.
The economy of Canada is a highly developed mixed economy, with the world's tenth-largest economy as of 2023, and a nominal GDP of approximately US$2.117 trillion. Canada is one of the world's largest trading nations, with a highly globalized economy. In 2021, Canadian trade in goods and services reached $2.016 trillion. Canada's exports totalled over $637 billion, while its imported goods were worth over $631 billion, of which approximately $391 billion originated from the United States. In 2018, Canada had a trade deficit in goods of $22 billion and a trade deficit in services of $25 billion. The Toronto Stock Exchange is the tenth-largest stock exchange in the world by market capitalization, listing over 1,500 companies with a combined market capitalization of over US$3 trillion.
The economy of Chile is a market economy and high-income economy as ranked by the World Bank. The country is considered one of South America's most prosperous nations, leading the region in competitiveness, income per capita, globalization, economic freedom, and low perception of corruption. Although Chile has high economic inequality, as measured by the Gini index, it is close to the regional mean.
The economy of Colombia is the fourth largest in Latin America as measured by gross domestic product and the third-largest economic power in South America. Colombia has experienced a historic economic boom over the last decade. Throughout most of the 20th century, Colombia was Latin America's 4th and 3rd largest economy when measured by nominal GDP, real GDP, GDP (PPP), and real GDP at chained PPPs. Between 2012 and 2014, it became the 3rd largest in Latin America by nominal GDP. As of 2018, the GDP (PPP) per capita has increased to over US$14,000, and real gross domestic product at chained PPPs increased from US$250 billion in 1990 to nearly US$800 billion. Poverty levels were as high as 65% in 1990, but decreased to under 30% by 2014, and 27% by 2018. They decreased by an average of 1.35% per year since 1990.
The economy of the Dominican Republic is the seventh largest in Latin America, and is the largest in the Caribbean and Central American region. The Dominican Republic is an upper-middle income developing country with important sectors including mining, tourism, manufacturing, energy, real estate, infrastructure, telecommunications and agriculture. The Dominican Republic is on track to achieve its goal of becoming a high-income country by 2030, and is expected to grow 79% in this decade. The country is the site of the single largest gold mine in Latin America, the Pueblo Viejo mine.Although the service sector is currently the leading employer of Dominicans, agriculture remains an important sector in terms of the domestic market and is in second place in terms of export earnings. Tourism accounts for more than $7.4 billion in annual earnings in 2019. Free-trade zone earnings and tourism are the fastest-growing export sectors. A leading growth engine in the Free-trade zone sector is the production of medical equipment for export having a value-added per employee of $20,000 USD, total revenue of $1.5 billion USD, and a growth rate of 7.7% in 2019. The medical instrument export sector represents one of the highest-value added sectors of the country's economy, a true growth engine for the country's emerging market. Remittances are an important sector of the economy, contributing $8.2 billion in 2020. Most of these funds are used to cover household expenses, such as housing, food, clothing, health care and education. Secondarily, remittances have financed businesses and productive activities. Thirdly, this combined effect has induced investment by the private sector and helps fund the public sector through its value-added tax. The combined import market including the free-trade-zones amounts to a market of $20 billion a year in 2019. The combined export sector had revenues totaling $11 billion in 2019. The consumer market is equivalent to $61 billion in 2019. An important indicator is the average commercial loan interest rate, which directs short-term investment and stimulates long-term investment in the economy. It is currently 8.30%, as of June 2021.
The economy of Ecuador is the eighth largest in Latin America and the 69th largest in the world by total GDP. Ecuador's economy is based on the export of oil, bananas, shrimp, gold, other primary agricultural products and money transfers from Ecuadorian emigrants employed abroad. In 2017, remittances constituted 2.7% of Ecuador's GDP. The total trade amounted to 42% of the Ecuador's GDP in 2017.
The economy of Indonesia is a mixed economy with dirigiste characteristics, and it is one of the emerging market economies in the world and the largest in Southeast Asia. As an upper-middle income country and member of the G20, Indonesia is classified as a newly industrialized country. Estimated at over 21 quadrillion rupiah in 2023, it is the 16th largest economy in the world by nominal GDP and the 7th largest in terms of GDP (PPP). Indonesia's internet economy reached US$77 billion in 2022, and is expected to cross the US$130 billion mark by 2025. Indonesia depends on the domestic market and government budget spending and its ownership of state-owned enterprises. The administration of prices of a range of basic goods also plays a significant role in Indonesia's market economy. However, since the 1990s, the majority of the economy has been controlled by individual Indonesians and foreign companies.
The economy of Mexico is a developing mixed-market economy. It is the 12th largest in the world in nominal GDP terms and by purchasing power parity according to the International Monetary Fund. Since the 1994 crisis, administrations have improved the country's macroeconomic fundamentals. Mexico was not significantly influenced by the 2002 South American crisis, and maintained positive, although low, rates of growth after a brief period of stagnation in 2001. However, Mexico was one of the Latin American nations most affected by the 2008 recession with its gross domestic product contracting by more than 6% in that year.
The economy of Paraguay is a market economy that is highly dependent on agriculture products. In recent years, Paraguay's economy has grown as a result of increased agricultural exports, especially soybeans. Paraguay has the economic advantages of a young population and vast hydroelectric power. Its disadvantages include the few available mineral resources, and political instability. The government welcomes foreign investment.
The economy of Tanzania is a lower-middle income economy that is overwhelmingly dependent on agriculture. Tanzania's economy has been transitioning from a planned economy to a market economy since 1985. Although total GDP has increased since these reforms began, GDP per capita dropped sharply at first, and only exceeded the pre-transition figure in around 2007.
The economy of Ukraine is an emerging, lower-middle income, mixed economy located in Eastern Europe. It grew rapidly from 2000 until 2008 when the Great Recession began worldwide and reached Ukraine. The economy recovered in 2010 and continued improving until 2013. From 2014 to 2015, the Ukrainian economy suffered a severe downturn, with GDP in 2015 being slightly above half of its value in 2013. In 2016, the economy again started to grow. By 2018, the Ukrainian economy was growing rapidly, and reached almost 80% of its size in 2008.
The economy of Uruguay features an export-oriented agricultural sector and a well-educated workforce, along with high levels of social spending. Tourism and banking are also prominent sectors; Uruguay acts as a regional hub for international finance and tourism. The country also has a history and representation of advanced workers-rights protection, with unions and the eight-hour work-day protected at the beginning of the 20th century.
The economy of Vietnam is a developing mixed socialist-oriented market economy incorporating industrial policies and strategic five-year plans, which is the 35th-largest in the world as measured by nominal gross domestic product (GDP) and 26th-largest in the world as measured by purchasing power parity (PPP) in 2022. It is a lower-middle income country with a low cost of living. Vietnam is a member of the Asia-Pacific Economic Cooperation, the Association of Southeast Asian Nations and the World Trade Organization.
The economy of Tunisia is in the process of being liberalized after decades of heavy state direction and participation in the country's economy. Prudent economic and fiscal planning has resulted in moderate but sustained growth for over a decade. Tunisia's economic growth historically has depended on oil, phosphates, agri-food products, car parts manufacturing, and tourism. In the World Economic Forum Global Competitiveness Report for 2015–2016, Tunisia ranks in 92nd place.
The economic history of Argentina is one of the most studied, owing to the "Argentine paradox". As a country, it had achieved advanced development in the early 20th century but experienced a reversal relative to other developed economies, which inspired an enormous wealth of literature and diverse analysis on the causes of this relative decline. Since independence from Spain in 1816, the country has defaulted on its debt nine times. Inflation has often risen to the double digits, even as high as 5,000%, resulting in several large currency devaluations.
The economy of Bolivia is the 95th-largest in the world in nominal terms and the 87th-largest in purchasing power parity. Bolivia is classified by the World Bank to be a lower middle income country. With a Human Development Index of 0.703, it is ranked 114th. Driven largely by its natural resources, Bolivia has become a region leader in measures of economic growth, fiscal stability and foreign reserves, although it remains a historically poor country. The Bolivian economy has had a historic single-commodity focus. From silver to tin to coca, Bolivia has enjoyed only occasional periods of economic diversification. Political instability and difficult topography have constrained efforts to modernize the agricultural sector. Similarly, relatively low population growth coupled with low life expectancy has kept the labor supply in flux and prevented industries from flourishing. Rampant inflation and corruption previously created development challenges, but in the early twenty-first century the fundamentals of its economy showed unexpected improvement, leading Moody's Investors Service to upgrade Bolivia's economic rating in 2010 from B2 to B1. The mining industry, especially the extraction of natural gas and zinc, currently dominates Bolivia's export economy.
Foreign trade of Argentina includes economic activities both within and outside Argentina especially with regards to merchandise exports and imports, as well as trade in services.
Agriculture is one of the bases of Argentina's economy.
Algeria's economy continued to recover in the first half of 2022, led by a return of oil production to pre-pandemic levels and a continued recovery of the service sector along with a more vigorous agricultural activity. The recovery should continue into 2023, supported by the nonhydrocarbon sector and public expenditure growth, according to the latest edition of the World Bank's Algeria Economic Update.
Latin America as a region has multiple nation-states, with varying levels of economic complexity. The Latin American economy is an export-based economy consisting of individual countries in the geographical regions of North America, Central America, South America, and the Caribbean. The socioeconomic patterns of what is now called Latin America were set in the colonial era when the region was controlled by the Spanish and Portuguese empires. Up until independence in the early nineteenth century, colonial Latin American regional economies thrived and worked things out. Many parts of the region had favorable factor endowments of deposits of precious metals, mainly silver, or tropical climatic conditions and locations near coasts that allowed for the development of cane sugar plantations. In the nineteenth century following independence, many economies of Latin America declined. In the late nineteenth century, much of Latin America was integrated into the world economy as an exporter of commodities. Foreign capital investment, construction of infrastructure, such as railroads, growth in the labor sector with immigration from abroad, strengthening of institutions, and expansion of education aided industrial growth and economic expansion. A number of regions have thriving economies, but "poverty and inequality have been deeply rooted in Latin American societies since the early colonial era."
↑ Ford, A. G. (1958). "Capital Exports and Growth for Argentina, 1880–1914". The Economic Journal. 68 (271): 589–593. doi:10.2307/2227581. JSTOR2227581.
This page is based on this Wikipedia article Text is available under the CC BY-SA 4.0 license; additional terms may apply. Images, videos and audio are available under their respective licenses.


