Analysis of variance (ANOVA) is a collection of statistical models and their associated estimation procedures used to analyze the differences among group means in a sample. ANOVA was developed by statistician and evolutionary biologist Ronald Fisher. In the ANOVA setting, the observed variance in a particular variable is partitioned into components attributable to different sources of variation. In its simplest form, ANOVA provides a statistical test of whether the population means of several groups are equal, and therefore generalizes the t-test to more than two groups. ANOVA is useful for comparing (testing) three or more group means for statistical significance. It is conceptually similar to multiple two-sample t-tests, but is more conservative, resulting in fewer type I errors, and is therefore suited to a wide range of practical problems.
Econometrics is the application of statistical methods to economic data in order to give empirical content to economic relationships. More precisely, it is "the quantitative analysis of actual economic phenomena based on the concurrent development of theory and observation, related by appropriate methods of inference". An introductory economics textbook describes econometrics as allowing economists "to sift through mountains of data to extract simple relationships". The first known use of the term "econometrics" was by Polish economist Paweł Ciompa in 1910. Jan Tinbergen is considered by many to be one of the founding fathers of econometrics. Ragnar Frisch is credited with coining the term in the sense in which it is used today.
Observational error is the difference between a measured value of a quantity and its true value. In statistics, an error is not a "mistake". Variability is an inherent part of the results of measurements and of the measurement process.

Statistics is a branch of mathematics dealing with data collection, organization, analysis, interpretation and presentation. In applying statistics to, for example, a scientific, industrial, or social problem, it is conventional to begin with a statistical population or a statistical model process to be studied. Populations can be diverse topics such as "all people living in a country" or "every atom composing a crystal". Statistics deals with all aspects of data, including the planning of data collection in terms of the design of surveys and experiments. See glossary of probability and statistics.
Epidemiology is the study and analysis of the distribution and determinants of health and disease conditions in defined populations.

In statistics, an outlier is an observation point that is distant from other observations. An outlier may be due to variability in the measurement or it may indicate experimental error; the latter are sometimes excluded from the data set. An outlier can cause serious problems in statistical analyses.
Selection bias is the bias introduced by the selection of individuals, groups or data for analysis in such a way that proper randomization is not achieved, thereby ensuring that the sample obtained is not representative of the population intended to be analyzed. It is sometimes referred to as the selection effect. The phrase "selection bias" most often refers to the distortion of a statistical analysis, resulting from the method of collecting samples. If the selection bias is not taken into account, then some conclusions of the study may not be accurate.

In statistics, a collection of random variables is heteroscedastic if there are sub-populations that have different variabilities from others. Here "variability" could be quantified by the variance or any other measure of statistical dispersion. Thus heteroscedasticity is the absence of homoscedasticity.

In statistical modeling, regression analysis is a set of statistical processes for estimating the relationships among variables. It includes many techniques for modeling and analyzing several variables, when the focus is on the relationship between a dependent variable and one or more independent variables. More specifically, regression analysis helps one understand how the typical value of the dependent variable changes when any one of the independent variables is varied, while the other independent variables are held fixed.

The general linear model or multivariate regression model is a statistical linear model. It may be written as

Mathematical statistics is the application of probability theory, a branch of mathematics, to statistics, as opposed to techniques for collecting statistical data. Specific mathematical techniques which are used for this include mathematical analysis, linear algebra, stochastic analysis, differential equations, and measure theory.
Econometric models are statistical models used in econometrics. An econometric model specifies the statistical relationship that is believed to hold between the various economic quantities pertaining to a particular economic phenomenon. An econometric model can be derived from a deterministic economic model by allowing for uncertainty, or from an economic model which itself is stochastic. However, it is also possible to use econometric models that are not tied to any specific economic theory.

In statistics, ordinary least squares (OLS) is a type of linear least squares method for estimating the unknown parameters in a linear regression model. OLS chooses the parameters of a linear function of a set of explanatory variables by the principle of least squares: minimizing the sum of the squares of the differences between the observed dependent variable in the given dataset and those predicted by the linear function.

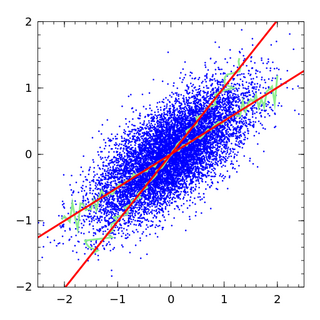
Regression dilution, also known as regression attenuation, is the biasing of the regression slope towards zero, caused by errors in the independent variable.

Multilevel models are statistical models of parameters that vary at more than one level. An example could be a model of student performance that contains measures for individual students as well as measures for classrooms within which the students are grouped. These models can be seen as generalizations of linear models, although they can also extend to non-linear models. These models became much more popular after sufficient computing power and software became available.
Repeated measures design is a research design that involves multiple measures of the same variable taken on the same or matched subjects either under different conditions or over two or more time periods. For instance, repeated measurements are collected in a longitudinal study in which change over time is assessed.

In statistics, errors-in-variables models or measurement error models are regression models that account for measurement errors in the independent variables. In contrast, standard regression models assume that those regressors have been measured exactly, or observed without error; as such, those models account only for errors in the dependent variables, or responses.
In probability theory, the Mills ratio of a continuous random variable is the function

In statistics, linear regression is a linear approach to modelling the relationship between a scalar response and one or more explanatory variables. The case of one explanatory variable is called simple linear regression. For more than one explanatory variable, the process is called multiple linear regression. This term is distinct from multivariate linear regression, where multiple correlated dependent variables are predicted, rather than a single scalar variable.


