Related Research Articles
Analysis of variance (ANOVA) is a collection of statistical models and their associated estimation procedures used to analyze the differences among means. ANOVA was developed by the statistician Ronald Fisher. ANOVA is based on the law of total variance, where the observed variance in a particular variable is partitioned into components attributable to different sources of variation. In its simplest form, ANOVA provides a statistical test of whether two or more population means are equal, and therefore generalizes the t-test beyond two means. In other words, the ANOVA is used to test the difference between two or more means.
Multivariate statistics is a subdivision of statistics encompassing the simultaneous observation and analysis of more than one outcome variable. Multivariate statistics concerns understanding the different aims and background of each of the different forms of multivariate analysis, and how they relate to each other. The practical application of multivariate statistics to a particular problem may involve several types of univariate and multivariate analyses in order to understand the relationships between variables and their relevance to the problem being studied.
Analysis of covariance (ANCOVA) is a general linear model which blends ANOVA and regression. ANCOVA evaluates whether the means of a dependent variable (DV) are equal across levels of a categorical independent variable (IV) often called a treatment, while statistically controlling for the effects of other continuous variables that are not of primary interest, known as covariates (CV) or nuisance variables. Mathematically, ANCOVA decomposes the variance in the DV into variance explained by the CV(s), variance explained by the categorical IV, and residual variance. Intuitively, ANCOVA can be thought of as 'adjusting' the DV by the group means of the CV(s).
A t-test is any statistical hypothesis test in which the test statistic follows a Student's t-distribution under the null hypothesis. It is most commonly applied when the test statistic would follow a normal distribution if the value of a scaling term in the test statistic were known. When the scaling term is estimated based on the data, the test statistic—under certain conditions—follows a Student's t distribution. The t-test's most common application is to test whether the means of two populations are different.

In statistics, multivariate analysis of variance (MANOVA) is a procedure for comparing multivariate sample means. As a multivariate procedure, it is used when there are two or more dependent variables, and is often followed by significance tests involving individual dependent variables separately.
The Mahalanobis distance is a measure of the distance between a point P and a distribution D, introduced by P. C. Mahalanobis in 1936. Mahalanobis's definition was prompted by the problem of identifying the similarities of skulls based on measurements in 1927.

In statistical modeling, regression analysis is a set of statistical processes for estimating the relationships between a dependent variable and one or more independent variables. The most common form of regression analysis is linear regression, in which one finds the line that most closely fits the data according to a specific mathematical criterion. For example, the method of ordinary least squares computes the unique line that minimizes the sum of squared differences between the true data and that line. For specific mathematical reasons, this allows the researcher to estimate the conditional expectation of the dependent variable when the independent variables take on a given set of values. Less common forms of regression use slightly different procedures to estimate alternative location parameters or estimate the conditional expectation across a broader collection of non-linear models.
Linear discriminant analysis (LDA), normal discriminant analysis (NDA), or discriminant function analysis is a generalization of Fisher's linear discriminant, a method used in statistics and other fields, to find a linear combination of features that characterizes or separates two or more classes of objects or events. The resulting combination may be used as a linear classifier, or, more commonly, for dimensionality reduction before later classification.
Structural equation modeling (SEM) is a label for a diverse set of methods used by scientists in both experimental and observational research across the sciences, business, and other fields. It is used most in the social and behavioral sciences. A definition of SEM is difficult without reference to highly technical language, but a good starting place is the name itself.

In statistics, data transformation is the application of a deterministic mathematical function to each point in a data set—that is, each data point zi is replaced with the transformed value yi = f(zi), where f is a function. Transforms are usually applied so that the data appear to more closely meet the assumptions of a statistical inference procedure that is to be applied, or to improve the interpretability or appearance of graphs.
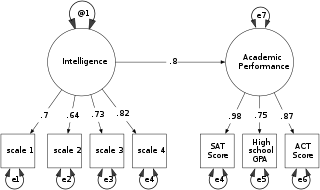
In statistics, confirmatory factor analysis (CFA) is a special form of factor analysis, most commonly used in social research. It is used to test whether measures of a construct are consistent with a researcher's understanding of the nature of that construct. As such, the objective of confirmatory factor analysis is to test whether the data fit a hypothesized measurement model. This hypothesized model is based on theory and/or previous analytic research. CFA was first developed by Jöreskog (1969) and has built upon and replaced older methods of analyzing construct validity such as the MTMM Matrix as described in Campbell & Fiske (1959).
In statistics, one-way analysis of variance is a technique that can be used to compare whether two sample's means are significantly different or not. This technique can be used only for numerical response data, the "Y", usually one variable, and numerical or (usually) categorical input data, the "X", always one variable, hence "one-way".
Repeated measures design is a research design that involves multiple measures of the same variable taken on the same or matched subjects either under different conditions or over two or more time periods. For instance, repeated measurements are collected in a longitudinal study in which change over time is assessed.
Multivariate analysis of covariance (MANCOVA) is an extension of analysis of covariance (ANCOVA) methods to cover cases where there is more than one dependent variable and where the control of concomitant continuous independent variables – covariates – is required. The most prominent benefit of the MANCOVA design over the simple MANOVA is the 'factoring out' of noise or error that has been introduced by the covariant. A commonly used multivariate version of the ANOVA F-statistic is Wilks' Lambda (Λ), which represents the ratio between the error variance and the effect variance.
In statistics, a mixed-design analysis of variance model, also known as a split-plot ANOVA, is used to test for differences between two or more independent groups whilst subjecting participants to repeated measures. Thus, in a mixed-design ANOVA model, one factor is a between-subjects variable and the other is a within-subjects variable. Thus, overall, the model is a type of mixed-effects model.
In randomized statistical experiments, generalized randomized block designs (GRBDs) are used to study the interaction between blocks and treatments. For a GRBD, each treatment is replicated at least two times in each block; this replication allows the estimation and testing of an interaction term in the linear model.
In statistics, an F-test of equality of variances is a test for the null hypothesis that two normal populations have the same variance. Notionally, any F-test can be regarded as a comparison of two variances, but the specific case being discussed in this article is that of two populations, where the test statistic used is the ratio of two sample variances. This particular situation is of importance in mathematical statistics since it provides a basic exemplar case in which the F-distribution can be derived. For application in applied statistics, there is concern that the test is so sensitive to the assumption of normality that it would be inadvisable to use it as a routine test for the equality of variances. In other words, this is a case where "approximate normality", is not good enough to make the test procedure approximately valid to an acceptable degree.
In probability and statistics, an elliptical distribution is any member of a broad family of probability distributions that generalize the multivariate normal distribution. Intuitively, in the simplified two and three dimensional case, the joint distribution forms an ellipse and an ellipsoid, respectively, in iso-density plots.
In statistics, one purpose for the analysis of variance (ANOVA) is to analyze differences in means between groups. The test statistic, F, assumes independence of observations, homogeneous variances, and population normality. ANOVA on ranks is a statistic designed for situations when the normality assumption has been violated.

In statistics, a sequence of random variables is homoscedastic if all its random variables have the same finite variance. This is also known as homogeneity of variance. The complementary notion is called heteroscedasticity. The spellings homoskedasticity and heteroskedasticity are also frequently used.
References
- ↑ Box, G.E.P. (1 December 1949). "A General Distribution Theory for a Class of Likelihood Criteria". Biometrika. 36 (3–4): 317–346. doi:10.1093/biomet/36.3-4.317.
- ↑ Rebecca M. Warner (2013). Applied Statistics: From Bivariate Through Multivariate Techniques. SAGE. p. 778. ISBN 978-1-4129-9134-6.
- ↑ Bryan F.J. Manly (6 July 2004). Multivariate Statistical Methods: A Primer, Third Edition. CRC Press. p. 54. ISBN 978-1-58488-414-9.
| | This statistics-related article is a stub. You can help Wikipedia by expanding it. |