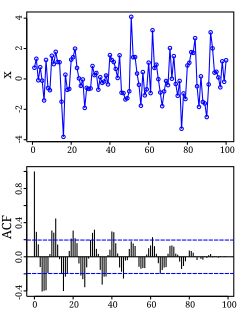
Autocorrelation, also known as serial correlation, is the correlation of a signal with a delayed copy of itself as a function of delay. Informally, it is the similarity between observations as a function of the time lag between them. The analysis of autocorrelation is a mathematical tool for finding repeating patterns, such as the presence of a periodic signal obscured by noise, or identifying the missing fundamental frequency in a signal implied by its harmonic frequencies. It is often used in signal processing for analyzing functions or series of values, such as time domain signals.

In statistics, correlation or dependence is any statistical relationship, whether causal or not, between two random variables or bivariate data. In the broadest sense correlation is any statistical association, though it commonly refers to the degree to which a pair of variables are linearly related. Familiar examples of dependent phenomena include the correlation between the height of parents and their offspring, and the correlation between the price of a good and the quantity the consumers are willing to purchase, as it is depicted in the so-called demand curve.

In statistics, the Pearson correlation coefficient, also referred to as Pearson's r, the Pearson product-moment correlation coefficient (PPMCC), or the bivariate correlation, is a measure of linear correlation between two sets of data. It is the covariance of two variables, divided by the product of their standard deviations; thus it is essentially a normalised measurement of the covariance, such that the result always has a value between −1 and 1. As with covariance itself, the measure can only reflect a linear correlation of variables, and ignores many other types of relationship or correlation. As a simple example, one would expect the age and height of a sample of teenagers from a high school to have a Pearson correlation coefficient significantly greater than 0, but less than 1.

In statistics, Spearman's rank correlation coefficient or Spearman's ρ, named after Charles Spearman and often denoted by the Greek letter (rho) or as , is a nonparametric measure of rank correlation. It assesses how well the relationship between two variables can be described using a monotonic function.
In statistics, the Mann–Whitney U test is a nonparametric test of the null hypothesis that, for randomly selected values X and Y from two populations, the probability of X being greater than Y is equal to the probability of Y being greater than X.
In statistics, the Page test for multiple comparisons between ordered correlated variables is the counterpart of Spearman's rank correlation coefficient which summarizes the association of continuous variables. It is also known as Page's trend test or Page's L test. It is a repeated measure trend test.

In signal processing, cross-correlation is a measure of similarity of two series as a function of the displacement of one relative to the other. This is also known as a sliding dot product or sliding inner-product. It is commonly used for searching a long signal for a shorter, known feature. It has applications in pattern recognition, single particle analysis, electron tomography, averaging, cryptanalysis, and neurophysiology. The cross-correlation is similar in nature to the convolution of two functions. In an autocorrelation, which is the cross-correlation of a signal with itself, there will always be a peak at a lag of zero, and its size will be the signal energy.

In statistics, the Fisher transformation can be used to test hypotheses about the value of the population correlation coefficient ρ between variables X and Y. This is because, when the transformation is applied to the sample correlation coefficient, the sampling distribution of the resulting variable is approximately normal, with a variance that is stable over different values of the underlying true correlation.
In statistics, a contingency table is a type of table in a matrix format that displays the (multivariate) frequency distribution of the variables. They are heavily used in survey research, business intelligence, engineering, and scientific research. They provide a basic picture of the interrelation between two variables and can help find interactions between them. The term contingency table was first used by Karl Pearson in "On the Theory of Contingency and Its Relation to Association and Normal Correlation", part of the Drapers' Company Research Memoirs Biometric Series I published in 1904.
Greek letters are used in mathematics, science, engineering, and other areas where mathematical notation is used as symbols for constants, special functions, and also conventionally for variables representing certain quantities. In these contexts, the capital letters and the small letters represent distinct and unrelated entities. Those Greek letters which have the same form as Latin letters are rarely used: capital A, B, E, Z, H, I, K, M, N, O, P, T, Y, X. Small ι, ο and υ are also rarely used, since they closely resemble the Latin letters i, o and u. Sometimes font variants of Greek letters are used as distinct symbols in mathematics, in particular for ε/ϵ and π/ϖ. The archaic letter digamma (Ϝ/ϝ/ϛ) is sometimes used.
The Wilcoxon signed-rank test is a non-parametric statistical hypothesis test used to compare two related samples, matched samples, or repeated measurements on a single sample to assess whether their population mean ranks differ. It can be used as an alternative to the paired Student's t-test when the distribution of the difference between two samples' means cannot be assumed to be normally distributed. A Wilcoxon signed-rank test is a nonparametric test that can be used to determine whether two dependent samples were selected from populations having the same distribution.
The following is a glossary of terms used in the mathematical sciences statistics and probability.
In statistics, a rank correlation is any of several statistics that measure an ordinal association—the relationship between rankings of different ordinal variables or different rankings of the same variable, where a "ranking" is the assignment of the ordering labels "first", "second", "third", etc. to different observations of a particular variable. A rank correlation coefficient measures the degree of similarity between two rankings, and can be used to assess the significance of the relation between them. For example, two common nonparametric methods of significance that use rank correlation are the Mann–Whitney U test and the Wilcoxon signed-rank test.
The Kendall tau rank distance is a metric that counts the number of pairwise disagreements between two ranking lists. The larger the distance, the more dissimilar the two lists are. Kendall tau distance is also called bubble-sort distance since it is equivalent to the number of swaps that the bubble sort algorithm would take to place one list in the same order as the other list. The Kendall tau distance was created by Maurice Kendall.
In statistics, the Kendall rank correlation coefficient, commonly referred to as Kendall's τ coefficient, is a statistic used to measure the ordinal association between two measured quantities. A τ test is a non-parametric hypothesis test for statistical dependence based on the τ coefficient.
In probability theory and statistics, partial correlation measures the degree of association between two random variables, with the effect of a set of controlling random variables removed. If we are interested in finding to what extent there is a numerical relationship between two variables of interest, using their correlation coefficient will give misleading results if there is another, confounding, variable that is numerically related to both variables of interest. This misleading information can be avoided by controlling for the confounding variable, which is done by computing the partial correlation coefficient. This is precisely the motivation for including other right-side variables in a multiple regression; but while multiple regression gives unbiased results for the effect size, it does not give a numerical value of a measure of the strength of the relationship between the two variables of interest.
In statistics, Goodman and Kruskal's gamma is a measure of rank correlation, i.e., the similarity of the orderings of the data when ranked by each of the quantities. It measures the strength of association of the cross tabulated data when both variables are measured at the ordinal level. It makes no adjustment for either table size or ties. Values range from −1 to +1. A value of zero indicates the absence of association.

In statistics and in probability theory, distance correlation or distance covariance is a measure of dependence between two paired random vectors of arbitrary, not necessarily equal, dimension. The population distance correlation coefficient is zero if and only if the random vectors are independent. Thus, distance correlation measures both linear and nonlinear association between two random variables or random vectors. This is in contrast to Pearson's correlation, which can only detect linear association between two random variables.
A correlation coefficient is a numerical measure of some type of correlation, meaning a statistical relationship between two variables. The variables may be two columns of a given data set of observations, often called a sample, or two components of a multivariate random variable with a known distribution.
In statistics, Somers’ D, sometimes incorrectly referred to as Somer’s D, is a measure of ordinal association between two possibly dependent random variables X and Y. Somers’ D takes values between when all pairs of the variables disagree and when all pairs of the variables agree. Somers’ D is named after Robert H. Somers, who proposed it in 1962.


