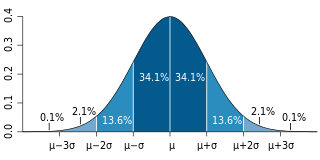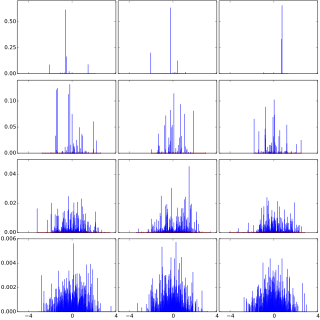
In probability theory and statistics, a probability distribution is the mathematical function that gives the probabilities of occurrence of different possible outcomes for an experiment. It is a mathematical description of a random phenomenon in terms of its sample space and the probabilities of events.

In statistics, a power law is a functional relationship between two quantities, where a relative change in one quantity results in a relative change in the other quantity proportional to a power of the change, independent of the initial size of those quantities: one quantity varies as a power of another. For instance, considering the area of a square in terms of the length of its side, if the length is doubled, the area is multiplied by a factor of four. The rate of change exhibited in these relationships is said to be multiplicative.
A statistical model is a mathematical model that embodies a set of statistical assumptions concerning the generation of sample data. A statistical model represents, often in considerably idealized form, the data-generating process. When referring specifically to probabilities, the corresponding term is probabilistic model.

Statistical inference is the process of using data analysis to infer properties of an underlying distribution of probability. Inferential statistical analysis infers properties of a population, for example by testing hypotheses and deriving estimates. It is assumed that the observed data set is sampled from a larger population.
Statistics, like all mathematical disciplines, does not infer valid conclusions from nothing. Inferring interesting conclusions about real statistical populations almost always requires some background assumptions. Those assumptions must be made carefully, because incorrect assumptions can generate wildly inaccurate conclusions.

In signal processing, white noise is a random signal having equal intensity at different frequencies, giving it a constant power spectral density. The term is used, with this or similar meanings, in many scientific and technical disciplines, including physics, acoustical engineering, telecommunications, and statistical forecasting. White noise refers to a statistical model for signals and signal sources, rather than to any specific signal. White noise draws its name from white light, although light that appears white generally does not have a flat power spectral density over the visible band.

A fractal landscape or fractal surface is generated using a stochastic algorithm designed to produce fractal behavior that mimics the appearance of natural terrain. In other words, the surface resulting from the procedure is not a deterministic, but rather a random surface that exhibits fractal behavior.
Linear trend estimation is a statistical method that is used to analyze data patterns. When a series of measurements of a process are treated as a sequence or time series, trend estimation can be used to make and justify statements about tendencies in the data by relating the measurements to the times at which they occurred. This model can then be used to describe the behavior of the observed data.
Structured Systems Analysis and Design Method (SSADM) is a systems approach to the analysis and design of information systems. SSADM was produced for the Central Computer and Telecommunications Agency, a UK government office concerned with the use of technology in government, from 1980 onwards.
The Akaike information criterion (AIC) is an estimator of prediction error and thereby relative quality of statistical models for a given set of data. Given a collection of models for the data, AIC estimates the quality of each model, relative to each of the other models. Thus, AIC provides a means for model selection.

Mathematical statistics is the application of probability theory, a branch of mathematics, to statistics, as opposed to techniques for collecting statistical data. Specific mathematical techniques which are used for this include mathematical analysis, linear algebra, stochastic analysis, differential equations, and measure theory.
The term conceptual model refers to any model that is formed after a conceptualization or generalization process. Conceptual models are often abstractions of things in the real world, whether physical or social. Semantic studies are relevant to various stages of concept formation. Semantics is fundamentally a study of concepts, the meaning that thinking beings give to various elements of their experience.
In time series analysis, the Box–Jenkins method, named after the statisticians George Box and Gwilym Jenkins, applies autoregressive moving average (ARMA) or autoregressive integrated moving average (ARIMA) models to find the best fit of a time-series model to past values of a time series.
In robust statistics, robust regression seeks to overcome some limitations of traditional regression analysis. A regression analysis models the relationship between one or more independent variables and a dependent variable. Standard types of regression, such as ordinary least squares, have favourable properties if their underlying assumptions are true, but can give misleading results otherwise. Robust regression methods are designed to limit the effect that violations of assumptions by the underlying data-generating process have on regression estimates.

A preferential attachment process is any of a class of processes in which some quantity, typically some form of wealth or credit, is distributed among a number of individuals or objects according to how much they already have, so that those who are already wealthy receive more than those who are not. "Preferential attachment" is only the most recent of many names that have been given to such processes. They are also referred to under the names Yule process, cumulative advantage, the rich get richer, and the Matthew effect. They are also related to Gibrat's law. The principal reason for scientific interest in preferential attachment is that it can, under suitable circumstances, generate power law distributions. If preferential attachment is non-linear, measured distributions may deviate from a power law. These mechanisms may generate distributions which are approximately power law over transient periods.

In probability theory, Dirichlet processes are a family of stochastic processes whose realizations are probability distributions. In other words, a Dirichlet process is a probability distribution whose range is itself a set of probability distributions. It is often used in Bayesian inference to describe the prior knowledge about the distribution of random variables—how likely it is that the random variables are distributed according to one or another particular distribution.
Production is the process of combining various inputs, both material and immaterial in order to create output. Ideally this output will be a good or service which has value and contributes to the utility of individuals. The area of economics that focuses on production is called production theory, and it is closely related to the consumption theory of economics.
In probability and statistics, the Tweedie distributions are a family of probability distributions which include the purely continuous normal, gamma and inverse Gaussian distributions, the purely discrete scaled Poisson distribution, and the class of compound Poisson–gamma distributions which have positive mass at zero, but are otherwise continuous. Tweedie distributions are a special case of exponential dispersion models and are often used as distributions for generalized linear models.
Design of robust and reliable networks and network services relies on an understanding of the traffic characteristics of the network. Throughout history, different models of network traffic have been developed and used for evaluating existing and proposed networks and services.
In statistics, a zero-inflated model is a statistical model based on a zero-inflated probability distribution, i.e. a distribution that allows for frequent zero-valued observations.


