In physics, the cross section is a measure of the probability that a specific process will take place when some kind of radiant excitation intersects a localized phenomenon. For example, the Rutherford cross-section is a measure of probability that an alpha particle will be deflected by a given angle during an interaction with an atomic nucleus. Cross section is typically denoted σ (sigma) and is expressed in units of area, more specifically in barns. In a way, it can be thought of as the size of the object that the excitation must hit in order for the process to occur, but more exactly, it is a parameter of a stochastic process.

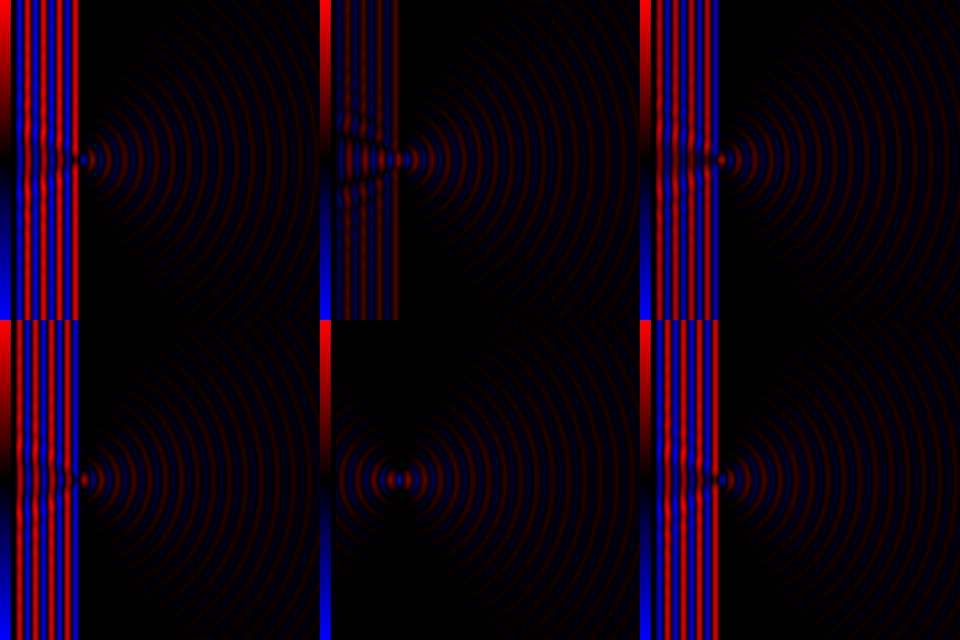
Diffraction refers to various phenomena that occur when a wave encounters an obstacle or opening. It is defined as the interference or bending of waves around the corners of an obstacle or through an aperture into the region of geometrical shadow of the obstacle/aperture. The diffracting object or aperture effectively becomes a secondary source of the propagating wave. Italian scientist Francesco Maria Grimaldi coined the word diffraction and was the first to record accurate observations of the phenomenon in 1660.

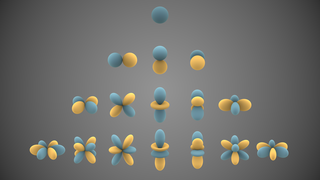
In mathematics and physical science, spherical harmonics are special functions defined on the surface of a sphere. They are often employed in solving partial differential equations in many scientific fields.
In physics and chemistry, Bragg's law, Wulff–Bragg's condition or Laue–Bragg interference, a special case of Laue diffraction, gives the angles for coherent scattering of waves from a crystal lattice. It encompasses the superposition of wave fronts scattered by lattice planes, leading to a strict relation between wavelength and scattering angle, or else to the wavevector transfer with respect to the crystal lattice. Such law had initially been formulated for X-rays upon crystals. However, It applies to all sorts of quantum beams, including neutron and electron waves at atomic distances, as well as visible light at artificial periodic microscale lattices.
In probability theory, the Borel–Kolmogorov paradox is a paradox relating to conditional probability with respect to an event of probability zero. It is named after Émile Borel and Andrey Kolmogorov.
The solar zenith angle is the angle between the sun’s rays and the vertical direction. It is closely related to the solar altitude angle, which is the angle between the sun’s rays and a horizontal plane. Since these two angles are complementary, the cosine of either one of them equals the sine of the other. They can both be calculated with the same formula, using results from spherical trigonometry. At solar noon, the zenith angle is at a minimum and is equal to latitude minus solar declination angle. This is the basis by which ancient mariners navigated the oceans.
The solar azimuth angle is the azimuth angle of the Sun's position. This horizontal coordinate defines the Sun's relative direction along the local horizon, whereas the solar zenith angle defines the Sun's apparent altitude.
In mathematics, the associated Legendre polynomials are the canonical solutions of the general Legendre equation

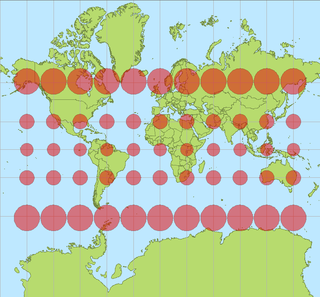
In cartography, a Tissot's indicatrix is a mathematical contrivance presented by French mathematician Nicolas Auguste Tissot in 1859 and 1871 in order to characterize local distortions due to map projection. It is the geometry that results from projecting a circle of infinitesimal radius from a curved geometric model, such as a globe, onto a map. Tissot proved that the resulting diagram is an ellipse whose axes indicate the two principal directions along which scale is maximal and minimal at that point on the map.

In electromagnetics, directivity is a parameter of an antenna or optical system which measures the degree to which the radiation emitted is concentrated in a single direction. It is the ratio of the radiation intensity in a given direction from the antenna to the radiation intensity averaged over all directions. Therefore, the directivity of a hypothetical isotropic radiator is 1, or 0 dBi.

In astronomy, position angle is the convention for measuring angles on the sky. The International Astronomical Union defines it as the angle measured relative to the north celestial pole (NCP), turning positive into the direction of the right ascension. In the standard (non-flipped) images, this is a counterclockwise measure relative to the axis into the direction of positive declination.
Cylindrical multipole moments are the coefficients in a series expansion of a potential that varies logarithmically with the distance to a source, i.e., as . Such potentials arise in the electric potential of long line charges, and the analogous sources for the magnetic potential and gravitational potential.
Ellipsoidal coordinates are a three-dimensional orthogonal coordinate system that generalizes the two-dimensional elliptic coordinate system. Unlike most three-dimensional orthogonal coordinate systems that feature quadratic coordinate surfaces, the ellipsoidal coordinate system is based on confocal quadrics.
In special functions, a topic in mathematics, spin-weighted spherical harmonics are generalizations of the standard spherical harmonics and—like the usual spherical harmonics—are functions on the sphere. Unlike ordinary spherical harmonics, the spin-weighted harmonics are U(1) gauge fields rather than scalar fields: mathematically, they take values in a complex line bundle. The spin-weighted harmonics are organized by degree l, just like ordinary spherical harmonics, but have an additional spin weights that reflects the additional U(1) symmetry. A special basis of harmonics can be derived from the Laplace spherical harmonics Ylm, and are typically denoted by sYlm, where l and m are the usual parameters familiar from the standard Laplace spherical harmonics. In this special basis, the spin-weighted spherical harmonics appear as actual functions, because the choice of a polar axis fixes the U(1) gauge ambiguity. The spin-weighted spherical harmonics can be obtained from the standard spherical harmonics by application of spin raising and lowering operators. In particular, the spin-weighted spherical harmonics of spin weight s = 0 are simply the standard spherical harmonics:

Diffraction processes affecting waves are amenable to quantitative description and analysis. Such treatments are applied to a wave passing through one or more slits whose width is specified as a proportion of the wavelength. Numerical approximations may be used, including the Fresnel and Fraunhofer approximations.
In physics and mathematics, the solid harmonics are solutions of the Laplace equation in spherical polar coordinates, assumed to be (smooth) functions . There are two kinds: the regular solid harmonics, which are well-defined at the origin and the irregular solid harmonics, which are singular at the origin. Both sets of functions play an important role in potential theory, and are obtained by rescaling spherical harmonics appropriately:

Geographical distance or geodetic distance is the distance measured along the surface of the earth. The formulae in this article calculate distances between points which are defined by geographical coordinates in terms of latitude and longitude. This distance is an element in solving the second (inverse) geodetic problem.
Quantum mechanics was first applied to optics, and interference in particular, by Paul Dirac. Richard Feynman, in his Lectures on Physics, uses Dirac's notation to describe thought experiments on double-slit interference of electrons. Feynman's approach was extended to N-slit interferometers for either single-photon illumination, or narrow-linewidth laser illumination, that is, illumination by indistinguishable photons, by Frank Duarte. The N-slit interferometer was first applied in the generation and measurement of complex interference patterns.
In optics, the Fraunhofer diffraction equation is used to model the diffraction of waves when the diffraction pattern is viewed at a long distance from the diffracting object, and also when it is viewed at the focal plane of an imaging lens.
In physics and engineering, the radiative heat transfer from one surface to another is the equal to the difference of incoming and outgoing radiation from the first surface. In general, the heat transfer between surfaces is governed by temperature, surface emissivity properties and the geometry of the surfaces. The relation for heat transfer can be written as an integral equation with boundary conditions based upon surface conditions. Kernel functions can be useful in approximating and solving this integral equation.


