Iowa's 3rd congressional district | |||
---|---|---|---|
Representative |
| ||
Distribution |
| ||
Population (2022) | 814,070 | ||
Median household income | $74,960 [1] | ||
Ethnicity |
| ||
Cook PVI | R+3 [2] |
Iowa's 3rd congressional district is a congressional district in the U.S. state of Iowa that covers its southwestern quadrant, which roughly consists of an area stretching from Des Moines to the borders with Missouri.
From 2013 to 2023, the district covered the southwestern corner of the state, from the Des Moines metropolitan area on the northeastern end to the greater Council Bluffs area on the southwestern end.
The district has been represented in the United States House of Representatives by Republican Zach Nunn since 2023. With a Cook Partisan Voting Index rating of R+3, it is the equal least Republican leaning district (along with the 1st) of Iowa’s four congressional districts, a state currently represented in congress only by Republicans. [2]
Election results from statewide races:
Office | Year | District result | Winner | |
---|---|---|---|---|
Statewide | Nationwide | |||
President | 2000 | Al Gore 49% – George W. Bush 48% | Gore | Bush |
2004 | George W. Bush 50% – John Kerry 50% | Bush | ||
2008 | Barack Obama 54% – John McCain 44% | Obama | Obama | |
2012 | Barack Obama 51% – Mitt Romney 47% | |||
2016 | Donald Trump 48% – Hillary Clinton 45% | Trump | Trump | |
2020 | Donald Trump 49.1% – Joe Biden 49.0% | Biden |
Year [3] | Winner | Second | Percentage | ||||
---|---|---|---|---|---|---|---|
Party affiliation | Candidate | Votes | Party affiliation | Candidate | Votes | ||
1920 | Republican | Burton E. Sweet | 67,859 | Farmer–Labor | Roy Jacobs | 1,974 | 97% – 3% |
1922 | Thomas J. B. Robinson | 34,518 | Democratic | Fred P. Hageman | 24,304 | 58% – 41% | |
1924 | 54,921 | Willis N. Birdsall | 25,215 | 69% – 31% | |||
1926 | 32,180 | Ellis E. Wilson | 13,696 | 70% – 30% | |||
1928 | 60,025 | Leo. F. Tierney | 38,469 | 61% – 39% | |||
1930 | 27,098 | W. L. Beecher | 15,908 | 63% – 37% | |||
1932 | Democratic | Albert C. Willford | 48,939 | Republican | Thomas J. B. Robinson | 47,776 | 51% – 49% |
1934 | Republican | John W. Gwynne | 42,063 | Democratic | Albert C. Willford | 35,159 | 51% – 43% |
1936 | 53,928 | 47,391 | 52% – 46% | ||||
1938 | 45,541 | W. F. Hayes | 30,158 | 60% – 40% | |||
1940 | 65,425 | Ernest J. Seemann | 43,709 | 60% – 40% | |||
1942 | 54,124 | William D. Kearney | 35,065 | 61% – 39% | |||
1944 | 74,901 | 56,985 | 58% – 42% | ||||
1946 | 48,346 | Dan J. P. Ryan | 29,661 | 62% – 38% | |||
1948 | H. R. Gross | 78,838 | 56,002 | 58% – 41% | |||
1950 | 73,490 | James O. Babcock | 40,786 | 64% – 36% | |||
1952 | 109,992 | George R. Laub | 56,871 | 66% – 34% | |||
1954 | 68,307 | 41,622 | 62% – 38% | ||||
1956 | 97,590 | Michael Micich | 69,076 | 59% – 41% | |||
1958 | 61,920 | 53,467 | 54% – 46% | ||||
1960 | 99,046 | Edward J. Gallagher, Jr. | 76,837 | 56% – 44% | |||
1962 | 66,337 | Neel F. Hill | 50,580 | 57% – 43% | |||
1964 | 83,455 | Stephen M. Peterson | 83,036 | 50.1% – 49.9% | |||
1966 | 79,343 | L. A. Pat Touchae | 48,530 | 62% – 38% | |||
1968 | 101,839 | John E. Van Eschen | 57,164 | 64% – 36% | |||
1970 | 66,087 | Lyle D. Taylor | 45,958 | 59% – 41% | |||
1972 | 109,113 | 86,848 | 56% – 44% | ||||
1974 | Chuck Grassley | 77,468 | Stephen Rapp | 74,859 | 51% – 49% | ||
1976 | 117,957 | 90,981 | 56% – 44% | ||||
1978 | 103,659 | John Knudson | 34,880 | 75% – 25% | |||
1980 | T. Cooper Evans | 107,869 | Lynn G. Cutler | 101,735 | 51% – 48% | ||
1982 | 104,072 | 83,581 | 55% – 45% | ||||
1984 | 133,737 | Joe Johnston | 86,574 | 61% – 39% | |||
1986 | Democratic | David R. Nagle | 83,504 | Republican | John McIntee | 69,386 | 55% – 45% |
1988 | 129,204 | Donald B. Redfern | 74,682 | 63% – 37% | |||
1990 | 100,947 | unopposed | 833 | 99% – 1% | |||
1992 | Republican | Jim Ross Lightfoot | 125,931 | Democratic | Elaine Baxter | 121,063 | 49% – 47% |
1994 | 111,862 | 79,310 | 58% – 41% | ||||
1996 | Democratic | Leonard Boswell | 115,914 | Republican | Mike Mahaffey | 111,895 | 49% – 48% |
1998 | 107,947 | Larry McKibben | 78,063 | 57% – 41% | |||
2000 | 156,327 | Jay Marcus | 83,810 | 63% – 34% | |||
2002 | 115,367 | Stan Thompson | 97,285 | 53% – 45% | |||
2004 | 168,007 | 136,099 | 55% – 45% | ||||
2006 | 114,689 | Jeff Lamberti | 103,182 | 52% – 47% | |||
2008 | 175,423 | Kim Schmett | 131,524 | 56% – 42% | |||
2010 | 122,147 | Brad Zaun | 111,925 | 50% – 46% | |||
2012 | Republican | Tom Latham | 202,000 | Democratic | Leonard Boswell | 168,632 | 51% – 42% |
2014 | David Young | 148,814 | Staci Appel | 119,109 | 52% – 42% | ||
2016 | 208,598 | Jim Mowrer | 155,002 | 53% – 40% | |||
2018 | Democratic | Cindy Axne | 169,888 | Republican | David Young | 164,667 | 49% – 47% |
2020 | 219,205 | 212,997 | 49% – 48% | ||||
2022 | Republican | Zach Nunn | 156,237 | Democratic | Cindy Axne | 154,084 | 50% – 49% |
Party | Candidate | Votes | % | |
---|---|---|---|---|
Democratic | Leonard Boswell* | 115,367 | 53.41 | |
Republican | Stan Thompson | 97,285 | 45.04 | |
Libertarian | Jeffrey J. Smith | 2,689 | 1.25 | |
Socialist Workers | Edwin B. Fruit | 569 | 0.26 | |
No party | Others | 75 | 0.04 | |
Total votes | 215,985 | 100.00 | ||
Turnout | ||||
Democratic hold | ||||
Party | Candidate | Votes | % | |
---|---|---|---|---|
Democratic | Leonard Boswell* | 168,007 | 55.21 | |
Republican | Stan Thompson | 136,009 | 44.72 | |
No party | Others | 213 | 0.07 | |
Total votes | 304,229 | 100.00 | ||
Turnout | ||||
Democratic hold | ||||
Party | Candidate | Votes | % | |
---|---|---|---|---|
Democratic | Leonard Boswell* | 115,769 | 51.85 | |
Republican | Jeff Lamberti | 103,722 | 46.45 | |
Socialist Workers | Helen Meyers | 3,591 | 1.61 | |
No party | Others | 205 | 0.09 | |
Total votes | 223,287 | 100.00 | ||
Turnout | ||||
Democratic hold | ||||
Party | Candidate | Votes | % | |
---|---|---|---|---|
Democratic | Leonard Boswell* | 176,904 | 56.31 | |
Republican | Kim Schmett | 132,136 | 42.06 | |
Socialist Workers | Frank Forrestal | 4,599 | 1.46 | |
No party | Others | 521 | 0.17 | |
Total votes | 314,160 | 100.00 | ||
Turnout | ||||
Democratic hold | ||||
Party | Candidate | Votes | % | |
---|---|---|---|---|
Democratic | Leonard Boswell* | 122,147 | 50.73 | |
Republican | Brad Zaun | 111,925 | 46.49 | |
Socialist Workers | Rebecca Williamson | 6,258 | 2.60 | |
No party | Others | 426 | 0.18 | |
Total votes | 240,756 | 100.00 | ||
Turnout | ||||
Democratic hold | ||||
Party | Candidate | Votes | % | |||
---|---|---|---|---|---|---|
Republican | Tom Latham* | 202,000 | 50.56 | |||
Democratic | Leonard Boswell* | 168,632 | 42.20 | |||
Independent | Scott G. Batcher | 9,352 | 2.34 | |||
Socialist Workers | David Rosenfeld | 6,286 | 1.57 | |||
No party | Others | 572 | 0.14 | |||
Total votes | 399,561 | 100.00 | ||||
Turnout | ||||||
Republican gain from Democratic | ||||||
Party | Candidate | Votes | % | |
---|---|---|---|---|
Republican | David Young | 148,814 | 52.8 | |
Democratic | Staci Appel | 119,109 | 42.2 | |
Libertarian | Edward Wright | 9,054 | 3.2 | |
No party preference | Bryan Jack Holder | 4,360 | 1.5 | |
Write-ins | 729 | 0.3 | ||
Total votes | 282,066 | 100 | ||
Republican hold | ||||
Party | Candidate | Votes | % | |
---|---|---|---|---|
Republican | David Young* | 208,598 | 53.45 | |
Democratic | Jim Mowrer | 155,002 | 39.71 | |
Libertarian | Bryan Jack Holder | 15,372 | 3.94 | |
Nominated by Petition | Claudia Addy | 6,348 | 1.63 | |
Nominated by Petition | Joe Grandanette | 4,518 | 1.16 | |
Write-ins | 449 | 0.12 | ||
Total votes | 390,287 | 100.00 | ||
Republican hold | ||||
Party | Candidate | Votes | % | ±% | |
---|---|---|---|---|---|
Democratic | Cindy Axne | 169,888 | 49.0 | +9.29 | |
Republican | David Young* | 164,667 | 47.49 | -5.96 | |
Libertarian | Bryan Jack Holder | 7,005 | 2.02 | −1.92 | |
Legal Marijuana Now | Mark Elworth, Jr. | 1,906 | 0.55 | +0.55 | |
Green | Paul Knupp | 1,795 | 0.52 | +0.52 | |
Independent | Joe Grandanette | 1,271 | 0.37 | −0.79 | |
Write-ins | 178 | 0.05 | +0.00 | ||
Plurality | 5,221 | 1.51 | |||
Turnout | 346,710 | 100 | |||
Democratic gain from Republican | Swing | +15.25 | |||
Party | Candidate | Votes | % | |
---|---|---|---|---|
Democratic | Cindy Axne (incumbent) | 219,205 | 48.9 | |
Republican | David Young | 212,997 | 47.6 | |
Libertarian | Bryan Jack Holder | 15,361 | 3.4 | |
Write-in | 384 | 0.1 | ||
Total votes | 447,947 | 100.0 | ||
Democratic hold | ||||
Party | Candidate | Votes | % | |
---|---|---|---|---|
Republican | Zach Nunn | 156,237 | 50.3% | |
Democratic | Cindy Axne (incumbent) | 154,084 | 49.6% | |
Write-in | 534 | 0.2% | ||
Total votes | 310,855 | 100% | ||
Republican gain from Democratic | ||||
Texas's 12th congressional district in the United States House of Representatives is in the north portion of the state of Texas. As of 2017, the 12th district contained 806,551 people and had a median income of $67,703. It consists of the western half of Tarrant County, as well as most of Parker County. The district also contains Texas Christian University. Fragments of the Dallas–Fort Worth metroplex are included in the district. The district is currently represented by Republican Kay Granger, who was first elected in 1996.
Texas's 19th congressional district of the United States House of Representatives includes the upper midwestern portion of the state of Texas. The district includes portions of the State from Lubbock to Abilene. The current Representative from the 19th district is Republican Jodey Arrington. With a Cook Partisan Voting Index rating of R+26, it is one of the most Republican districts in Texas.
Connecticut's 3rd congressional district is a congressional district in the U.S. state of Connecticut. Located in the central part of the state, the district includes the city of New Haven and its surrounding suburbs.
Ohio's 2nd congressional district is a district in southern Ohio. It is currently represented by Republican Brad Wenstrup.
Iowa's 1st congressional district is a congressional district in the U.S. state of Iowa that covers its southeastern part, bordering the states of Illinois and Missouri, and the Mississippi River. The district includes the cities of Davenport, Iowa City, Burlington, and Indianola. Republican Mariannette Miller-Meeks is the current U.S. representative. With a Cook Partisan Voting Index rating of R+3, it is one of the least Republican districts in Iowa, a state with an all-Republican congressional delegation.
Iowa's 2nd congressional district is a congressional district in the U.S. state of Iowa that covers most of its northeastern part. It includes Cedar Rapids, Dubuque, Waterloo, and Grinnell.
Iowa's 4th congressional district is a congressional district in the U.S. state of Iowa that covers the western border of the state, including Sioux City and Council Bluffs. Up north, it extends eastwards into Ames, Boone, Fort Dodge, and Marshalltown. It has been represented by Republican Randy Feenstra since 2021, who defeated longtime incumbent Steve King in 2020. With a Cook Partisan Voting Index rating of R+16, it is the most Republican district in Iowa, a state with an all-Republican congressional delegation.
Ohio's 5th congressional district is in northwestern and north central Ohio and borders Indiana. The district is currently represented by Republican Bob Latta.
Ohio's 8th congressional district sits on the west side of Ohio, bordering Indiana. The cities of Hamilton, Fairfield, Middletown, Springfield, Eaton, Greenville, Piqua, and Troy are part of the district. The district was represented by Republican John Boehner, the 53rd Speaker of the United States House of Representatives. On September 25, 2015, Boehner announced his resignation from the speakership and retirement from Congress, which became effective on October 31, 2015.
The 14th congressional district of Ohio is in the far northeast corner of the state, bordering Lake Erie and Pennsylvania. It is currently represented in the United States House of Representatives by Republican Dave Joyce.
Washington's 4th congressional district encompasses a large area of central Washington, covering the counties of Douglas, Okanogan, Grant, Yakima, Benton, and Klickitat; and parts of Adams and Franklin counties. The district is dominated by the Yakima and Tri-Cities areas. With a Cook Partisan Voting Index rating of R+11, it is the most Republican district in Washington.
The 5th congressional district of Illinois covers parts of Cook and Lake counties, as of the 2023 redistricting which followed the 2010 census. All or parts of Chicago, Inverness, Arlington Heights, Barrington Hills, Des Plaines, Palatine, Mount Prospect, Deer Park, Kildeer, Lake Zurich, Long Grove, and North Barrington are included.
Arkansas's 2nd congressional district is a congressional district located in the central part of the U.S. state of Arkansas and includes the state capital of Little Rock, its suburbs, and surrounding areas. The district leans Republican, with a Cook Partisan Voting Index rating of R+9. However, due to the influence of heavily Democratic Little Rock, it is still considered the least Republican congressional district in Arkansas, which has an all-Republican congressional delegation.
Arkansas's 3rd congressional district is a congressional district in the U.S. state of Arkansas. The district covers Northwest Arkansas and takes in Fort Smith, Fayetteville, Springdale, and Bentonville.
Arkansas's 4th congressional district is a congressional district located in the southwestern portion of the U.S. state of Arkansas. Notable towns in the district include Camden, Hope, Hot Springs, Magnolia, Pine Bluff, and Texarkana.
Oregon's 2nd congressional district is the largest of Oregon's six districts, and is the seventh largest district in the nation. It is the second-largest congressional district in the nation that does not cover an entire state, and has been represented by Republican Cliff Bentz of Ontario since 2021.
Pennsylvania's 14th congressional district is located in the southwestern part of the state and includes all of Fayette County, Greene County, and Washington County, and most of Indiana, Westmoreland, and Somerset counties. It is represented by Republican Guy Reschenthaler.
Connecticut's 4th congressional district is a congressional district in the U.S. state of Connecticut. Located in the southwestern part of the state, the district is largely suburban and extends from Bridgeport, the largest city in the state, to Greenwich – an area largely coextensive with the Connecticut side of the New York metropolitan area. The district also extends inland, toward Danbury and toward the Lower Naugatuck Valley.
Iowa's 6th congressional district is a former U.S. congressional district in the State of Iowa. It existed in elections from 1862 to 1992, when it was lost due to Iowa's population growth rate being lower than that of the country as a whole.
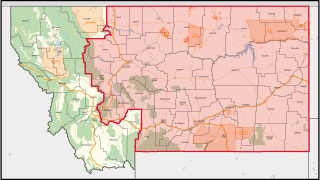
Montana's second congressional district is a congressional district in the United States House of Representatives that was apportioned after the 2020 United States census. The first candidates ran in the 2022 elections for a seat in the 118th United States Congress.