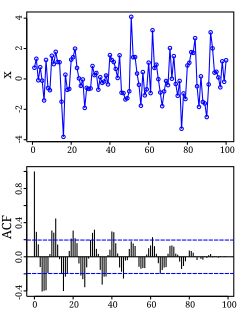
Autocorrelation, also known as serial correlation, is the correlation of a signal with a delayed copy of itself as a function of delay. Informally, it is the similarity between observations as a function of the time lag between them. The analysis of autocorrelation is a mathematical tool for finding repeating patterns, such as the presence of a periodic signal obscured by noise, or identifying the missing fundamental frequency in a signal implied by its harmonic frequencies. It is often used in signal processing for analyzing functions or series of values, such as time domain signals.

The power spectrum of a time series describes the distribution of power into frequency components composing that signal. According to Fourier analysis, any physical signal can be decomposed into a number of discrete frequencies, or a spectrum of frequencies over a continuous range. The statistical average of a certain signal or sort of signal as analyzed in terms of its frequency content, is called its spectrum.

In signal processing and statistics, a window function is a mathematical function that is zero-valued outside of some chosen interval, normally symmetric around the middle of the interval, usually near a maximum in the middle, and usually tapering away from the middle. Mathematically, when another function or waveform/data-sequence is "multiplied" by a window function, the product is also zero-valued outside the interval: all that is left is the part where they overlap, the "view through the window". Equivalently, and in actual practice, the segment of data within the window is first isolated, and then only that data is multiplied by the window function values. Thus, tapering, not segmentation, is the main purpose of window functions.

A time series is a series of data points indexed in time order. Most commonly, a time series is a sequence taken at successive equally spaced points in time. Thus it is a sequence of discrete-time data. Time Series analysis can be useful to see how a given asset, security or economic variable changes over time. Examples of time series are heights of ocean tides, counts of sunspots, and the daily closing value of the Dow Jones Industrial Average.
In econometrics, the autoregressive conditional heteroscedasticity (ARCH) model is a statistical model for time series data that describes the variance of the current error term or innovation as a function of the actual sizes of the previous time periods' error terms; often the variance is related to the squares of the previous innovations. The ARCH model is appropriate when the error variance in a time series follows an autoregressive (AR) model; if an autoregressive moving average (ARMA) model is assumed for the error variance, the model is a generalized autoregressive conditional heteroskedasticity (GARCH) model.
In the statistical analysis of time series, autoregressive–moving-average (ARMA) models provide a parsimonious description of a (weakly) stationary stochastic process in terms of two polynomials, one for the autoregression (AR) and the second for the moving average (MA). The general ARMA model was described in the 1951 thesis of Peter Whittle, Hypothesis testing in time series analysis, and it was popularized in the 1970 book by George E. P. Box and Gwilym Jenkins.
In statistics, econometrics and signal processing, an autoregressive (AR) model is a representation of a type of random process; as such, it is used to describe certain time-varying processes in nature, economics, etc. The autoregressive model specifies that the output variable depends linearly on its own previous values and on a stochastic term ; thus the model is in the form of a stochastic difference equation. Together with the moving-average (MA) model, it is a special case and key component of the more general autoregressive–moving-average (ARMA) and autoregressive integrated moving average (ARIMA) models of time series, which have a more complicated stochastic structure; it is also a special case of the vector autoregressive model (VAR), which consists of a system of more than one interlocking stochastic difference equation in more than one evolving random variable.
In statistics and econometrics, and in particular in time series analysis, an autoregressive integrated moving average (ARIMA) model is a generalization of an autoregressive moving average (ARMA) model. Both of these models are fitted to time series data either to better understand the data or to predict future points in the series (forecasting). ARIMA models are applied in some cases where data show evidence of non-stationarity in the sense of mean, where an initial differencing step can be applied one or more times to eliminate the non-stationarity of the mean function. When the seasonality shows in a time series, the seasonal-differencing could be applied to eliminate the seasonal component. Since the ARMA model, according to the Wold's decomposition theorem, is theoretically sufficient to describe a wide-sense stationary time series, we are motivated to make stationary a non-stationary time series, e.g., by using differencing, before we can use the ARMA model.
The Havriliak–Negami relaxation is an empirical modification of the Debye relaxation model in electromagnetism. Unlike the Debye model, the Havriliak–Negami relaxation accounts for the asymmetry and broadness of the dielectric dispersion curve. The model was first used to describe the dielectric relaxation of some polymers, by adding two exponential parameters to the Debye equation:
Vector autoregression (VAR) is a statistical model used to capture the relationship between multiple quantities as they change over time. VAR is a type of stochastic process model. VAR models generalize the single-variable (univariate) autoregressive model by allowing for multivariate time series. VAR models are often used in economics and the natural sciences.
A cyclostationary process is a signal having statistical properties that vary cyclically with time. A cyclostationary process can be viewed as multiple interleaved stationary processes. For example, the maximum daily temperature in New York City can be modeled as a cyclostationary process: the maximum temperature on July 21 is statistically different from the temperature on December 20; however, it is a reasonable approximation that the temperature on December 20 of different years has identical statistics. Thus, we can view the random process composed of daily maximum temperatures as 365 interleaved stationary processes, each of which takes on a new value once per year.
In applied mathematics, the Wiener–Khinchin theorem, also known as the Wiener–Khintchine theorem and sometimes as the Wiener–Khinchin–Einstein theorem or the Khinchin–Kolmogorov theorem, states that the autocorrelation function of a wide-sense-stationary random process has a spectral decomposition given by the power spectrum of that process.

A multifractal system is a generalization of a fractal system in which a single exponent is not enough to describe its dynamics; instead, a continuous spectrum of exponents is needed.
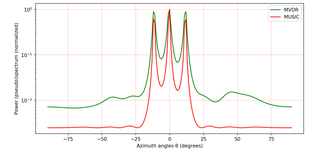
MUSIC is an algorithm used for frequency estimation and radio direction finding.
In statistical signal processing, the goal of spectral density estimation (SDE) is to estimate the spectral density of a random signal from a sequence of time samples of the signal. Intuitively speaking, the spectral density characterizes the frequency content of the signal. One purpose of estimating the spectral density is to detect any periodicities in the data, by observing peaks at the frequencies corresponding to these periodicities.

In probability theory and statistics, the skew normal distribution is a continuous probability distribution that generalises the normal distribution to allow for non-zero skewness.
In computer networks, self-similarity is a feature of network data transfer dynamics. When modeling network data dynamics the traditional time series models, such as an autoregressive moving average model, are not appropriate. This is because these models only provide a finite number of parameters in the model and thus interaction in a finite time window, but the network data usually have a long-range dependent temporal structure. A self-similar process is one way of modeling network data dynamics with such a long range correlation. This article defines and describes network data transfer dynamics in the context of a self-similar process. Properties of the process are shown and methods are given for graphing and estimating parameters modeling the self-similarity of network data.
Heat transfer physics describes the kinetics of energy storage, transport, and energy transformation by principal energy carriers: phonons, electrons, fluid particles, and photons. Heat is energy stored in temperature-dependent motion of particles including electrons, atomic nuclei, individual atoms, and molecules. Heat is transferred to and from matter by the principal energy carriers. The state of energy stored within matter, or transported by the carriers, is described by a combination of classical and quantum statistical mechanics. The energy is also transformed (converted) among various carriers. The heat transfer processes are governed by the rates at which various related physical phenomena occur, such as the rate of particle collisions in classical mechanics. These various states and kinetics determine the heat transfer, i.e., the net rate of energy storage or transport. Governing these process from the atomic level to macroscale are the laws of thermodynamics, including conservation of energy.
A frequency-selective surface (FSS) is any thin, repetitive surface designed to reflect, transmit or absorb electromagnetic fields based on the frequency of the field. In this sense, an FSS is a type of optical filter or metal-mesh optical filters in which the filtering is accomplished by virtue of the regular, periodic pattern on the surface of the FSS. Though not explicitly mentioned in the name, FSS's also have properties which vary with incidence angle and polarization as well - these are unavoidable consequences of the way in which FSS's are constructed. Frequency-selective surfaces have been most commonly used in the radio frequency region of the electromagnetic spectrum and find use in applications as diverse as the aforementioned microwave oven, antenna radomes and modern metamaterials. Sometimes frequency selective surfaces are referred to simply as periodic surfaces and are a 2-dimensional analog of the new periodic volumes known as photonic crystals.
Power spectral estimation forms the basis for distinguishing and tracking signals in the presence of noise and extracting information from available data. One dimensional signals are expressed in terms of a single domain while multidimensional signals are represented in wave vector and frequency spectrum. Therefore, spectral estimation in the case of multidimensional signals gets a bit tricky.


