The weighted arithmetic mean is similar to an ordinary arithmetic mean, except that instead of each of the data points contributing equally to the final average, some data points contribute more than others. The notion of weighted mean plays a role in descriptive statistics and also occurs in a more general form in several other areas of mathematics.

In probability and statistics, Student's t-distribution is any member of a family of continuous probability distributions that arises when estimating the mean of a normally distributed population in situations where the sample size is small and population standard deviation is unknown. It was developed by William Sealy Gosset under the pseudonym Student.
The power of a binary hypothesis test is the probability that the test rejects the null hypothesis (H0) when a specific alternative hypothesis (H1) is true. The statistical power ranges from 0 to 1, and as statistical power increases, the probability of making a type II error (wrongly accepting the null) decreases. For a type II error probability of β, the corresponding statistical power is 1 − β. For example, if experiment 1 has a statistical power of 0.7, and experiment 2 has a statistical power of 0.95, then there is a stronger probability that experiment 1 had a type II error than experiment 2, and experiment 2 is more reliable than experiment 1 due to the reduction in probability of a type II error. It can be equivalently thought of as the probability of accepting the alternative hypothesis (H1) when it is true—that is, the ability of a test to detect a specific effect, if that specific effect actually exists. That is,
In statistics, a sampling distribution or finite-sample distribution is the probability distribution of a given random-sample-based statistic. If an arbitrarily large number of samples, each involving multiple observations, were separately used in order to compute one value of a statistic for each sample, then the sampling distribution is the probability distribution of the values that the statistic takes on. In many contexts, only one sample is observed, but the sampling distribution can be found theoretically.
The t-test is any statistical hypothesis test in which the test statistic follows a Student's t-distribution under the null hypothesis.

The standard error (SE) of a statistic is the standard deviation of its sampling distribution or an estimate of that standard deviation. If the parameter or the statistic is the mean, it is called the standard error of the mean (SEM).
A tolerance interval is a statistical interval within which, with some confidence level, a specified proportion of a sampled population falls. "More specifically, a 100×p%/100×(1−α) tolerance interval provides limits within which at least a certain proportion (p) of the population falls with a given level of confidence (1−α)." "A tolerance interval (TI) based on a sample is constructed so that it would include at least a proportion p of the sampled population with confidence 1−α; such a TI is usually referred to as p-content − (1−α) coverage TI." "A upper tolerance limit (TL) is simply a 1−α upper confidence limit for the 100 p percentile of the population."
In probability theory and statistics, the coefficient of variation (CV), also known as relative standard deviation (RSD), is a standardized measure of dispersion of a probability distribution or frequency distribution. It is often expressed as a percentage, and is defined as the ratio of the standard deviation to the mean . The CV or RSD is widely used in analytical chemistry to express the precision and repeatability of an assay. It is also commonly used in fields such as engineering or physics when doing quality assurance studies and ANOVA gauge R&R. In addition, CV is utilized by economists and investors in economic models and in determining the volatility of a security.

In probability theory and statistics, the continuous uniform distribution or rectangular distribution is a family of symmetric probability distributions such that for each member of the family, all intervals of the same length on the distribution's support are equally probable. The support is defined by the two parameters, a and b, which are its minimum and maximum values. The distribution is often abbreviated U(a,b). It is the maximum entropy probability distribution for a random variable X under no constraint other than that it is contained in the distribution's support.
Sample size determination is the act of choosing the number of observations or replicates to include in a statistical sample. The sample size is an important feature of any empirical study in which the goal is to make inferences about a population from a sample. In practice, the sample size used in a study is determined based on the expense of data collection, and the need to have sufficient statistical power. In complicated studies there may be several different sample sizes involved in the study: for example, in a stratified survey there would be different sample sizes for each stratum. In a census, data are collected on the entire population, hence the sample size is equal to the population size. In experimental design, where a study may be divided into different treatment groups, this may be different sample sizes for each group.
In process improvement efforts, the process capability index or process capability ratio is a statistical measure of process capability: the ability of a process to produce output within specification limits. The concept of process capability only holds meaning for processes that are in a state of statistical control. Process capability indices measure how much "natural variation" a process experiences relative to its specification limits and allows different processes to be compared with respect to how well an organization controls them.
In statistics, a pivotal quantity or pivot is a function of observations and unobservable parameters such that the function's probability distribution does not depend on the unknown parameters. A pivot quantity need not be a statistic—the function and its value can depend on the parameters of the model, but its distribution must not. If it is a statistic, then it is known as an ancillary statistic.

In statistics, bootstrapping is any test or metric that relies on random sampling with replacement. Bootstrapping allows assigning measures of accuracy to sample estimates. This technique allows estimation of the sampling distribution of almost any statistic using random sampling methods. Generally, it falls in the broader class of resampling methods.
In statistics and in particular statistical theory, unbiased estimation of a standard deviation is the calculation from a statistical sample of an estimated value of the standard deviation of a population of values, in such a way that the expected value of the calculation equals the true value. Except in some important situations, outlined later, the task has little relevance to applications of statistics since its need is avoided by standard procedures, such as the use of significance tests and confidence intervals, or by using Bayesian analysis.
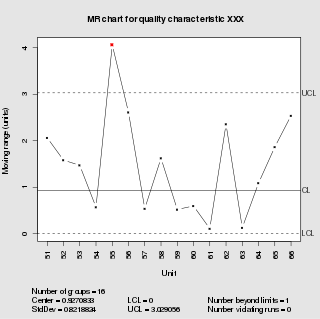
In statistical quality control, the individual/moving-range chart is a type of control chart used to monitor variables data from a business or industrial process for which it is impractical to use rational subgroups.
In probability and statistics, the Tweedie distributions are a family of probability distributions which include the purely continuous normal and gamma distributions, the purely discrete scaled Poisson distribution, and the class of mixed compound Poisson–gamma distributions which have positive mass at zero, but are otherwise continuous. For any random variable Y that obeys a Tweedie distribution, the variance var(Y) relates to the mean E(Y) by the power law,
In statistics, a generalized p-value is an extended version of the classical p-value, which except in a limited number of applications, provides only approximate solutions.


