Calculation of the rank product
Given n genes and k replicates, let the rank of gene g in the i-th replicate.

Compute the rank product via the geometric mean:
The rank product is a biologically motivated rank test for the detection of differentially expressed genes in replicated microarray experiments. It is a simple non-parametric statistical method based on ranks of fold changes. In addition to its use in expression profiling, it can be used to combine ranked lists in various application domains, including proteomics, metabolomics, statistical meta-analysis, and general feature selection.
Given n genes and k replicates, let the rank of gene g in the i-th replicate.
Compute the rank product via the geometric mean:
Simple permutation-based estimation is used to determine how likely a given RP value or better is observed in a random experiment.
Permutation re-sampling requires a computationally demanding number of permutations to get reliable estimates of the p-values for the most differentially expressed genes, if n is large. Eisinga, Breitling and Heskes (2013) provide the exact probability mass distribution of the rank product statistic. Calculation of the exact p-values offers a substantial improvement over permutation approximation, most significantly for that part of the distribution rank product analysis is most interested in, i.e., the thin right tail. However, exact statistical significance of large rank products may take unacceptable long amounts of time to compute. Heskes, Eisinga and Breitling (2014) provide a method to determine accurate approximate p-values of the rank product statistic in a computationally fast manner.
In cryptography, a block cipher is a deterministic algorithm that operates on fixed-length groups of bits, called blocks. Block ciphers are the elementary building blocks of many cryptographic protocols. They are ubiquitous in the storage and exchange of data, where such data is secured and authenticated via encryption.
In a chemical reaction, chemical equilibrium is the state in which both the reactants and products are present in concentrations which have no further tendency to change with time, so that there is no observable change in the properties of the system. This state results when the forward reaction proceeds at the same rate as the reverse reaction. The reaction rates of the forward and backward reactions are generally not zero, but they are equal. Thus, there are no net changes in the concentrations of the reactants and products. Such a state is known as dynamic equilibrium.
In linear algebra, an orthogonal matrix, or orthonormal matrix, is a real square matrix whose columns and rows are orthonormal vectors.

In mathematics, de Rham cohomology is a tool belonging both to algebraic topology and to differential topology, capable of expressing basic topological information about smooth manifolds in a form particularly adapted to computation and the concrete representation of cohomology classes. It is a cohomology theory based on the existence of differential forms with prescribed properties.
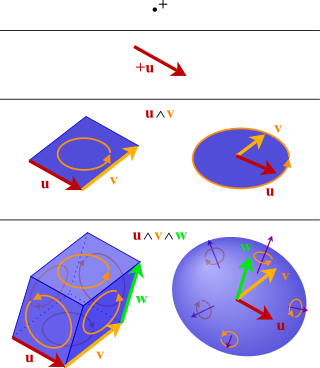
In mathematics, the exterior product or wedge product of vectors is an algebraic construction used in geometry to study areas, volumes, and their higher-dimensional analogs. The exterior product of two vectors u and v, denoted by u ∧ v, is called a bivector and lives in a space called the exterior square, a vector space that is distinct from the original space of vectors. The magnitude of u ∧ v can be interpreted as the area of the parallelogram with sides u and v, which in three dimensions can also be computed using the cross product of the two vectors. Like the cross product, the exterior product is anticommutative, meaning that u ∧ v = −(v ∧ u) for all vectors u and v, but, unlike the cross product, the exterior product is associative. One way to visualize a bivector is as a family of parallelograms all lying in the same plane, having the same area and orientation, which is a choice of rotational direction within the plane (clockwise or counterclockwise from some view).

In statistics, Spearman's rank correlation coefficient or Spearman's ρ, named after Charles Spearman and often denoted by the Greek letter (rho) or as , is a nonparametric measure of rank correlation. It assesses how well the relationship between two variables can be described using a monotonic function.

A DNA microarray is a collection of microscopic DNA spots attached to a solid surface. Scientists use DNA microarrays to measure the expression levels of large numbers of genes simultaneously or to genotype multiple regions of a genome. Each DNA spot contains picomoles of a specific DNA sequence, known as probes. These can be a short section of a gene or other DNA element that are used to hybridize a cDNA or cRNA sample under high-stringency conditions. Probe-target hybridization is usually detected and quantified by detection of fluorophore-, silver-, or chemiluminescence-labeled targets to determine relative abundance of nucleic acid sequences in the target. The original nucleic acid arrays were macro arrays approximately 9 cm × 12 cm and the first computerized image based analysis was published in 1981. It was invented by Patrick O. Brown. An example of its application is in SNPs arrays for polymorphisms in cardiovascular diseases, cancer, pathogens and GWAS analysis. It is also used for the identification of structural variations and the measurement of gene expression.
The equilibrium constant of a chemical reaction is the value of its reaction quotient at chemical equilibrium, a state approached by a dynamic chemical system after sufficient time has elapsed at which its composition has no measurable tendency towards further change. For a given set of reaction conditions, the equilibrium constant is independent of the initial analytical concentrations of the reactant and product species in the mixture. Thus, given the initial composition of a system, known equilibrium constant values can be used to determine the composition of the system at equilibrium. However, reaction parameters like temperature, solvent, and ionic strength may all influence the value of the equilibrium constant.
A permutation test is an exact statistical hypothesis test making use of the proof by contradiction. A permutation test involves two or more samples. The null hypothesis is that all samples come from the same distribution . Under the null hypothesis, the distribution of the test statistic is obtained by calculating all possible values of the test statistic under possible rearrangements of the observed data. Permutation tests are, therefore, a form of resampling.
The Friedman test is a non-parametric statistical test developed by Milton Friedman. Similar to the parametric repeated measures ANOVA, it is used to detect differences in treatments across multiple test attempts. The procedure involves ranking each row together, then considering the values of ranks by columns. Applicable to complete block designs, it is thus a special case of the Durbin test.

In the field of molecular biology, gene expression profiling is the measurement of the activity of thousands of genes at once, to create a global picture of cellular function. These profiles can, for example, distinguish between cells that are actively dividing, or show how the cells react to a particular treatment. Many experiments of this sort measure an entire genome simultaneously, that is, every gene present in a particular cell.
In probability theory, the Gillespie algorithm generates a statistically correct trajectory of a stochastic equation system for which the reaction rates are known. It was created by Joseph L. Doob and others, presented by Dan Gillespie in 1976, and popularized in 1977 in a paper where he uses it to simulate chemical or biochemical systems of reactions efficiently and accurately using limited computational power. As computers have become faster, the algorithm has been used to simulate increasingly complex systems. The algorithm is particularly useful for simulating reactions within cells, where the number of reagents is low and keeping track of every single reaction is computationally feasible. Mathematically, it is a variant of a dynamic Monte Carlo method and similar to the kinetic Monte Carlo methods. It is used heavily in computational systems biology.
In statistics, the Kendall rank correlation coefficient, commonly referred to as Kendall's τ coefficient, is a statistic used to measure the ordinal association between two measured quantities. A τ test is a non-parametric hypothesis test for statistical dependence based on the τ coefficient. It is a measure of rank correlation: the similarity of the orderings of the data when ranked by each of the quantities. It is named after Maurice Kendall, who developed it in 1938, though Gustav Fechner had proposed a similar measure in the context of time series in 1897.

Microarray analysis techniques are used in interpreting the data generated from experiments on DNA, RNA, and protein microarrays, which allow researchers to investigate the expression state of a large number of genes – in many cases, an organism's entire genome – in a single experiment. Such experiments can generate very large amounts of data, allowing researchers to assess the overall state of a cell or organism. Data in such large quantities is difficult – if not impossible – to analyze without the help of computer programs.

In statistics, the jackknife is a cross-validation technique and, therefore, a form of resampling. It is especially useful for bias and variance estimation. The jackknife pre-dates other common resampling methods such as the bootstrap. Given a sample of size , a jackknife estimator can be built by aggregating the parameter estimates from each subsample of size obtained by omitting one observation.
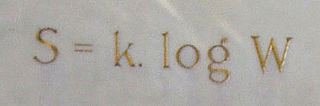
In statistical mechanics, Boltzmann's equation is a probability equation relating the entropy , also written as , of an ideal gas to the multiplicity, the number of real microstates corresponding to the gas's macrostate:
In statistics, the multiple comparisons, multiplicity or multiple testing problem occurs when one considers a set of statistical inferences simultaneously or estimates a subset of parameters selected based on the observed values.
Within computational biology, an MA plot is an application of a Bland–Altman plot for visual representation of genomic data. The plot visualizes the differences between measurements taken in two samples, by transforming the data onto M and A scales, then plotting these values. Though originally applied in the context of two channel DNA microarray gene expression data, MA plots are also used to visualise high-throughput sequencing analysis.

In statistics, a volcano plot is a type of scatter-plot that is used to quickly identify changes in large data sets composed of replicate data. It plots significance versus fold-change on the y and x axes, respectively. These plots are increasingly common in omic experiments such as genomics, proteomics, and metabolomics where one often has a list of many thousands of replicate data points between two conditions and one wishes to quickly identify the most meaningful changes. A volcano plot combines a measure of statistical significance from a statistical test with the magnitude of the change, enabling quick visual identification of those data-points that display large magnitude changes that are also statistically significant.

Network controllability concerns the structural controllability of a network. Controllability describes our ability to guide a dynamical system from any initial state to any desired final state in finite time, with a suitable choice of inputs. This definition agrees well with our intuitive notion of control. The controllability of general directed and weighted complex networks has recently been the subject of intense study by a number of groups in wide variety of networks, worldwide. Recent studies by Sharma et al. on multi-type biological networks identified control targets in phenotypically characterized Osteosarcoma showing important role of genes and proteins responsible for maintaining tumor microenvironment.


