External links
- Yahoo Finance page for ^SP600
- Bloomberg page for SML:IND
- Standard & Poor's page for S&P SmallCap 600 Index
| | This finance-related article is a stub. You can help Wikipedia by expanding it. |
The S&P SmallCap 600 Index (S&P 600) is a stock market index established by S&P Global Ratings. It covers roughly the small-cap range of American stocks, using a capitalization-weighted index.
To be included in the index, a stock must have a total market capitalization that ranges from $1 billion to $6.7 billion. [1] These market cap eligibility criteria are for addition to an index, not for continued membership. As a result, an index constituent that appears to violate criteria for addition to that index is not removed unless ongoing conditions warrant an index change. [1]
Additionally, same as S&P 500 and S&P 400, there is a financial viability requirement. Companies must have positive as-reported earnings over the most recent quarter, as well as over the most recent four quarters (summed together).
As of 29 December 2023 [update] , the index's median market cap was $1.74 billion and covered roughly three percent of the total US stock market. These smallcap stocks cover a narrower range of capitalization than the companies covered by the Russell 2000 Smallcap index which range from $169 million to $4 billion, [2] excluding some of the smallest companies. The S&P 400 MidCap index combined with the SmallCap 600 compose the S&P 1000, and the S&P 1000 plus the S&P 500 compose the S&P 1500. The index was launched on October 28, 1994 [3] and its ticker symbols are either SML, ^SML, SP600 or ^SP600 depending on the financial website.
| Category | All-Time Highs | |
|---|---|---|
| Closing | 1,466.02 | Monday, November 8, 2021 |
| Intraday | 1,477.45 | Monday, November 8, 2021 |
The following exchange-traded funds (ETFs) attempt to track the performance of the index:
Index Fund
Growth Index Fund
Value Index Fund
It can be compared to the Russell 2000 Index. [4] [5] [6]
The "S&P 600" generally quoted is a price return index; there are also total return and net total return versions of the index. These versions differ in how dividends are accounted for. The price return version does not account for dividends; it only captures the changes in the prices of the index components. The total return version reflects the effects of dividend reinvestment, while the net total return version takes into account dividend withholding taxes for foreign investors.
| Year | Price return | Total return |
|---|---|---|
| 2023 | 13.89% | 16.05% |
| 2022 | -17.42% | -16.10% |
| 2021 | 25.27% | 26.82% |
| 2020 | 9.57% | 11.29% |
| 2019 | 20.86% | 22.78% |
| 2018 | −9.75% | −8.48% |
| 2017 | 11.73% | 13.23% |
| 2016 | 24.75% | 26.56% |
| 2015 | −3.36% | −1.97% |
| 2014 | 4.44% | 5.76% |
| 2013 | 39.65% | 41.31% |
| 2012 | 14.81% | 16.33% |
| 2011 | −0.16% | 1.02% |
| 2010 | 24.98% | 26.31% |
| 2009 | 23.78% | 25.57% |
| 2008 | −31.99% | −31.07% |
| 2007 | −1.22% | −0.30% |
| 2006 | 14.07% | 15.12% |
| 2005 | 6.65% | 7.68% |
| 2004 | 21.59% | 22.65% |
| 2003 | 38.79% | |
| 2002 | −14.63% | |
| 2001 | 6.54% | |
| 2000 | 11.80% | |
| 1999 | 12.40% | |
| 1998 | −1.31% | |
| 1997 | 25.58% | |
| 1996 | 21.32% | |
| 1995 | 29.96% | |
| 1994 | −4.77% |
| | This finance-related article is a stub. You can help Wikipedia by expanding it. |
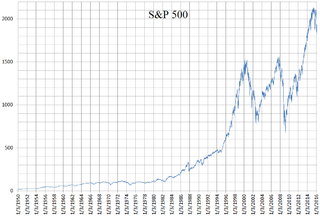
The Standard and Poor's 500, or simply the S&P 500, is a stock market index tracking the stock performance of 500 of the largest companies listed on stock exchanges in the United States. It is one of the most commonly followed equity indices and includes approximately 80% of the total market capitalization of U.S. public companies, with an aggregate market cap of more than $43 trillion as of January 2024.
An exchange-traded fund (ETF) is a type of investment fund that is also an exchange-traded product, i.e., it is traded on stock exchanges. ETFs own financial assets such as stocks, bonds, currencies, debts, futures contracts, and/or commodities such as gold bars. The list of assets that each ETF owns, as well as their weightings, is posted on the website of the issuer daily, or quarterly in the case of active non-transparent ETFs. Many ETFs provide some level of diversification compared to owning an individual stock.
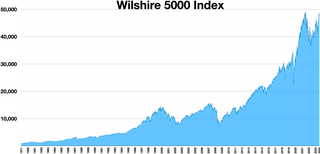
The Wilshire 5000 Total Market Index, or more simply the Wilshire 5000, is a market-capitalization-weighted index of the market value of all American stocks actively traded in the United States. As of December 31, 2023, the index contained 3,403 components. The index is intended to measure the performance of most publicly traded companies headquartered in the United States, with readily available price data. Hence, the index includes a majority of the common stocks and REITs traded primarily through New York Stock Exchange, NASDAQ, or the American Stock Exchange. Limited partnerships and ADRs are not included. It can be tracked by following the ticker ^FTW5000.
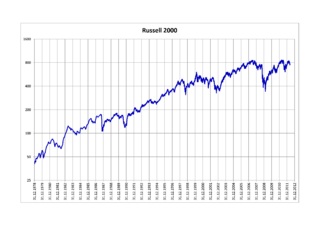
The Russell 2000 Index is a small-cap U.S. stock market index that makes up the smallest 2,000 stocks in the Russell Index. It was started by the Frank Russell Company in 1984. The index is maintained by FTSE Russell, a subsidiary of the London Stock Exchange Group (LSEG).
The Russell 3000 Index is a capitalization-weighted stock market index that seeks to be a benchmark of the entire U.S. stock market. It measures the performance of the 3,000 largest publicly held companies incorporated in America as measured by total market capitalization, and represents approximately 97% of the American public equity market. The index was launched on January 1, 1984, and is maintained by FTSE Russell, a subsidiary of the London Stock Exchange Group. The ticker symbol on most systems is ^RUA.
The Russell Midcap Index measures performance of the 800 smallest companies in the Russell 1000 Index. As of 30 November 2022, the stocks of the Russell Midcap Index have a weighted average market capitalization of approximately $22.64 billion, median market capitalization of $9.91 billion, and the market capitalization of the largest company is $54.74 billion. The index, which was launched on November 1, 1991, is maintained by FTSE Russell, a subsidiary of the London Stock Exchange Group.
The S&P 100 Index is a stock market index of United States stocks maintained by Standard & Poor's.
The S&P 1500, or S&P Composite 1500 Index, is a stock market index of US stocks made by Standard & Poor's. It includes all stocks in the S&P 500, S&P 400, and S&P 600. This index covers approximately 90% of the market capitalization of U.S. stocks and is a broad measure of the U.S. equity market.
iShares S&P 100 Index Fund is an exchange-traded fund of US stocks. The fund tracks the S&P 100 index.
Fundamentally based indexes or fundamental indexes, also called fundamentally weighted indexes, are indexes in which stocks are weighted according to factors related to their fundamentals such as earnings, dividends and assets, commonly used when performing corporate valuations. Indexes that use a composite of several fundamental factors attempt to average out sector biases that may arise from relying on a single fundamental factor. A key belief behind the fundamental index methodology is that underlying corporate accounting/valuation figures are more accurate estimators of a company's intrinsic value, rather than the listed market value of the company, i.e. that one should buy and sell companies in line with their accounting figures rather than according to their current market prices. In this sense fundamental indexing is linked to so-called fundamental analysis.
SPDR funds are a family of exchange-traded funds (ETFs) traded in the United States, Europe, Mexico and Asia-Pacific and managed by State Street Global Advisors (SSGA). Informally, they are also known as Spyders or Spiders. SPDR is a trademark of Standard and Poor's Financial Services LLC, a subsidiary of S&P Global. The name is an acronym for the first member of the family, the Standard & Poor's Depositary Receipts, now the SPDR S&P 500 Trust ETF, which is designed to track the S&P 500 stock market index.
An inverse exchange-traded fund is an exchange-traded fund (ETF), traded on a public stock market, which is designed to perform as the inverse of whatever index or benchmark it is designed to track. These funds work by using short selling, trading derivatives such as futures contracts, and other leveraged investment techniques.
The S&P MidCap 400 Index, more commonly known as the S&P 400, is a stock market index from S&P Dow Jones Indices.
The Russell Top 50 Index measures the performance of the largest companies in the Russell 3000 Index. It includes approximately 50 of the largest securities based on a combination of their market cap and current index membership and represents approximately 40% of the total market capitalization of the Russell 3000.
The Russell Microcap Index measures the performance of the microcap segment of the U.S. equity market. It makes up less than 3% of the U.S. equity market. It includes 1,000 of the smallest securities in the Russell 2000 Index based on a combination of their market cap and current index membership and it also includes up to the next 1,000 stocks. As of 31 December 2016, the weighted average market capitalization for a company in the index was $535 million; the median market cap was $228 million. The market cap of the largest company in the index was $3.6 billion.

SPDR Gold Shares is part of the SPDR family of exchange-traded funds (ETFs) managed and marketed by State Street Global Advisors. For a few years, the fund was the second-largest exchange-traded fund in the world, and it was briefly the largest. As of the close of 2014, it dropped out of the top ten.
The SPDR S&P 500 ETF trust is an exchange-traded fund which trades on the NYSE Arca under the symbol SPY. SPDR is an acronym for the Standard & Poor's Depositary Receipts, the former name of the ETF. It is designed to track the S&P 500 stock market index. This fund is the largest and oldest ETF in the USA. SPDR is a trademark of Standard and Poor's Financial Services LLC, a subsidiary of S&P Global. The ETF's CUSIP is 78462F103 and its ISIN is US78462F1030. The trustee of the SPDR S&P 500 ETF Trust is State Street Bank and Trust Company. The fund has a net expense ratio of 0.0945%.