Related Research Articles
Analysis of variance (ANOVA) is a collection of statistical models and their associated estimation procedures used to analyze the differences among means. ANOVA was developed by the statistician Ronald Fisher. ANOVA is based on the law of total variance, where the observed variance in a particular variable is partitioned into components attributable to different sources of variation. In its simplest form, ANOVA provides a statistical test of whether two or more population means are equal, and therefore generalizes the t-test beyond two means. In other words, the ANOVA is used to test the difference between two or more means.
Multivariate statistics is a subdivision of statistics encompassing the simultaneous observation and analysis of more than one outcome variable. Multivariate statistics concerns understanding the different aims and background of each of the different forms of multivariate analysis, and how they relate to each other. The practical application of multivariate statistics to a particular problem may involve several types of univariate and multivariate analyses in order to understand the relationships between variables and their relevance to the problem being studied.

The principal components of a collection of points in a real coordinate space are a sequence of unit vectors, where the -th vector is the direction of a line that best fits the data while being orthogonal to the first vectors. Here, a best-fitting line is defined as one that minimizes the average squared perpendicular distance from the points to the line. These directions constitute an orthonormal basis in which different individual dimensions of the data are linearly uncorrelated. Principal component analysis (PCA) is the process of computing the principal components and using them to perform a change of basis on the data, sometimes using only the first few principal components and ignoring the rest.

The method of least squares is a standard approach in regression analysis to approximate the solution of overdetermined systems by minimizing the sum of the squares of the residuals made in the results of each individual equation.
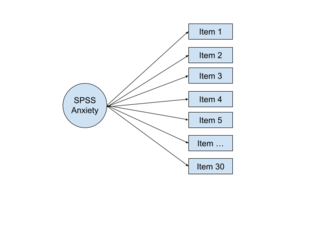
Factor analysis is a statistical method used to describe variability among observed, correlated variables in terms of a potentially lower number of unobserved variables called factors. For example, it is possible that variations in six observed variables mainly reflect the variations in two unobserved (underlying) variables. Factor analysis searches for such joint variations in response to unobserved latent variables. The observed variables are modelled as linear combinations of the potential factors plus "error" terms, hence factor analysis can be thought of as a special case of errors-in-variables models.
Chemometrics is the science of extracting information from chemical systems by data-driven means. Chemometrics is inherently interdisciplinary, using methods frequently employed in core data-analytic disciplines such as multivariate statistics, applied mathematics, and computer science, in order to address problems in chemistry, biochemistry, medicine, biology and chemical engineering. In this way, it mirrors other interdisciplinary fields, such as psychometrics and econometrics.
In statistics and optimization, errors and residuals are two closely related and easily confused measures of the deviation of an observed value of an element of a statistical sample from its "true value". The error of an observation is the deviation of the observed value from the true value of a quantity of interest. The residual is the difference between the observed value and the estimated value of the quantity of interest. The distinction is most important in regression analysis, where the concepts are sometimes called the regression errors and regression residuals and where they lead to the concept of studentized residuals. In econometrics, "errors" are also called disturbances.
In statistics, a studentized residual is the quotient resulting from the division of a residual by an estimate of its standard deviation. It is a form of a Student's t-statistic, with the estimate of error varying between points.

Cluster analysis or clustering is the task of grouping a set of objects in such a way that objects in the same group are more similar to each other than to those in other groups (clusters). It is a main task of exploratory data analysis, and a common technique for statistical data analysis, used in many fields, including pattern recognition, image analysis, information retrieval, bioinformatics, data compression, computer graphics and machine learning.
The Mahalanobis distance is a measure of the distance between a point P and a distribution D, introduced by P. C. Mahalanobis in 1936. Mahalanobis's definition was prompted by the problem of identifying the similarities of skulls based on measurements in 1927.
Partial least squares regression is a statistical method that bears some relation to principal components regression; instead of finding hyperplanes of maximum variance between the response and independent variables, it finds a linear regression model by projecting the predicted variables and the observable variables to a new space. Because both the X and Y data are projected to new spaces, the PLS family of methods are known as bilinear factor models. Partial least squares discriminant analysis (PLS-DA) is a variant used when the Y is categorical.
In statistics, the number of degrees of freedom is the number of values in the final calculation of a statistic that are free to vary.
The limit of detection is the lowest signal, or the lowest corresponding quantity to be determined from the signal, that can be observed with a sufficient degree of confidence or statistical significance. However, the exact threshold used to decide when a signal significantly emerges above the continuously fluctuating background noise remains arbitrary and is a matter of policy and often of debate among scientists, statisticians and regulators depending on the stakes in different fields.
The partition of sums of squares is a concept that permeates much of inferential statistics and descriptive statistics. More properly, it is the partitioning of sums of squared deviations or errors. Mathematically, the sum of squared deviations is an unscaled, or unadjusted measure of dispersion. When scaled for the number of degrees of freedom, it estimates the variance, or spread of the observations about their mean value. Partitioning of the sum of squared deviations into various components allows the overall variability in a dataset to be ascribed to different types or sources of variability, with the relative importance of each being quantified by the size of each component of the overall sum of squares.
The point distribution model is a model for representing the mean geometry of a shape and some statistical modes of geometric variation inferred from a training set of shapes.
In computational biology and bioinformatics, analysis of variance – simultaneous component analysis is a method that partitions variation and enables interpretation of these partitions by SCA, a method that is similar to principal components analysis (PCA). Analysis of variance (ANOVA) is a collection of statistical models and their associated estimation procedures used to analyze differences. Statistical coupling analysis (SCA) is a technique used in bioinformatics to measure covariation between pairs of amino acids in a protein multiple sequence alignment (MSA).
The Unscrambler X is a commercial software product for multivariate data analysis, used for calibration of multivariate data which is often in the application of analytical data such as near infrared spectroscopy and Raman spectroscopy, and development of predictive models for use in real-time spectroscopic analysis of materials. The software was originally developed in 1986 by Harald Martens and later by CAMO Software.
In multivariate statistics, exploratory factor analysis (EFA) is a statistical method used to uncover the underlying structure of a relatively large set of variables. EFA is a technique within factor analysis whose overarching goal is to identify the underlying relationships between measured variables. It is commonly used by researchers when developing a scale and serves to identify a set of latent constructs underlying a battery of measured variables. It should be used when the researcher has no a priori hypothesis about factors or patterns of measured variables. Measured variables are any one of several attributes of people that may be observed and measured. Examples of measured variables could be the physical height, weight, and pulse rate of a human being. Usually, researchers would have a large number of measured variables, which are assumed to be related to a smaller number of "unobserved" factors. Researchers must carefully consider the number of measured variables to include in the analysis. EFA procedures are more accurate when each factor is represented by multiple measured variables in the analysis.
The Jenks optimization method, also called the Jenks natural breaks classification method, is a data clustering method designed to determine the best arrangement of values into different classes. This is done by seeking to minimize each class's average deviation from the class mean, while maximizing each class's deviation from the means of the other classes. In other words, the method seeks to reduce the variance within classes and maximize the variance between classes.
References
- Wold, Svante, and Sjostrom, Michael, 1977, SIMCA: A method for analyzing chemical data in terms of similarity and analogy, in Kowalski, B.R., ed., Chemometrics Theory and Application, American Chemical Society Symposium Series 52, Wash., D.C., American Chemical Society, p. 243-282.