Statistical risk is a quantification of a situation's risk using statistical methods. These methods can be used to estimate a probability distribution for the outcome of a specific variable, or at least one or more key parameters of that distribution, and from that estimated distribution a risk function can be used to obtain a single non-negative number representing a particular conception of the risk of the situation.
Statistical risk is taken account of in a variety of contexts including finance and economics, and there are many risk functions that can be used depending on the context.
One measure of the statistical risk of a continuous variable, such as the return on an investment, is simply the estimated variance of the variable, or equivalently the square root of the variance, called the standard deviation. Another measure in finance, one which views upside risk as unimportant compared to downside risk, is the downside beta. In the context of a binary variable, a simple statistical measure of risk is simply the probability that a variable will take on the lower of two values.
There is a sense in which one risk A can be said to be unambiguously greater than another risk B (that is, greater for any reasonable risk function): namely, if A is a mean-preserving spread of B. This means that the probability density function of A can be formed, roughly speaking, by "spreading out" that of B. However, this is only a partial ordering: most pairs of risks cannot be unambiguously ranked in this way, and different risk functions applied to the estimated distributions of two such unordered risky variables will give different answers as to which is riskier.
In statistics, an estimator is a rule for calculating an estimate of a given quantity based on observed data: thus the rule, the quantity of interest and its result are distinguished. For example, the sample mean is a commonly used estimator of the population mean.
In statistics and probability theory, the median is the value separating the higher half from the lower half of a data sample, a population, or a probability distribution. For a data set, it may be thought of as "the middle" value. The basic feature of the median in describing data compared to the mean is that it is not skewed by a small proportion of extremely large or small values, and therefore provides a better representation of the center. Median income, for example, may be a better way to describe center of the income distribution because increases in the largest incomes alone have no effect on median. For this reason, the median is of central importance in robust statistics.
A parameter, generally, is any characteristic that can help in defining or classifying a particular system. That is, a parameter is an element of a system that is useful, or critical, when identifying the system, or when evaluating its performance, status, condition, etc.
Statistics is a field of inquiry that studies the collection, analysis, interpretation, and presentation of data. It is applicable to a wide variety of academic disciplines, from the physical and social sciences to the humanities; it is also used and misused for making informed decisions in all areas of business and government.
The method of least squares is a standard approach in regression analysis to approximate the solution of overdetermined systems by minimizing the sum of the squares of the residuals made in the results of each individual equation.
In statistics, point estimation involves the use of sample data to calculate a single value which is to serve as a "best guess" or "best estimate" of an unknown population parameter. More formally, it is the application of a point estimator to the data to obtain a point estimate.
Nonparametric statistics is the branch of statistics that is not based solely on parametrized families of probability distributions. Nonparametric statistics is based on either being distribution-free or having a specified distribution but with the distribution's parameters unspecified. Nonparametric statistics includes both descriptive statistics and statistical inference. Nonparametric tests are often used when the assumptions of parametric tests are violated.
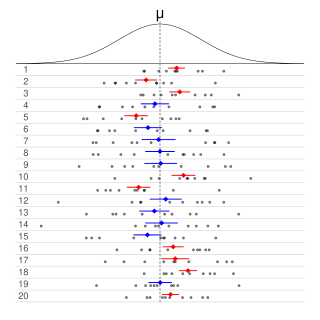
In frequentist statistics, a confidence interval (CI) is a range of estimates for an unknown parameter. A confidence interval is computed at a designated confidence level; the 95% confidence level is most common, but other levels, such as 90% or 99%, are sometimes used. The confidence level represents the long-run proportion of CIs that theoretically contain the true value of the parameter. For example, out of all intervals computed at the 95% level, 95% of them should contain the parameter's true value.
In mathematical optimization and decision theory, a loss function or cost function is a function that maps an event or values of one or more variables onto a real number intuitively representing some "cost" associated with the event. An optimization problem seeks to minimize a loss function. An objective function is either a loss function or its opposite, in which case it is to be maximized. The loss function could include terms from several levels of the hierarchy.
In statistics, a generalized linear model (GLM) is a flexible generalization of ordinary linear regression. The GLM generalizes linear regression by allowing the linear model to be related to the response variable via a link function and by allowing the magnitude of the variance of each measurement to be a function of its predicted value.
Mathematical statistics is the application of probability theory, a branch of mathematics, to statistics, as opposed to techniques for collecting statistical data. Specific mathematical techniques which are used for this include mathematical analysis, linear algebra, stochastic analysis, differential equations, and measure theory.
In probability theory and statistics, the continuous uniform distribution or rectangular distribution is a family of symmetric probability distributions. The distribution describes an experiment where there is an arbitrary outcome that lies between certain bounds. The bounds are defined by the parameters, a and b, which are the minimum and maximum values. The interval can either be closed (e.g. [a, b]) or open (e.g. (a, b)). Therefore, the distribution is often abbreviated U (a, b), where U stands for uniform distribution. The difference between the bounds defines the interval length; all intervals of the same length on the distribution's support are equally probable. It is the maximum entropy probability distribution for a random variable X under no constraint other than that it is contained in the distribution's support.
This glossary of statistics and probability is a list of definitions of terms and concepts used in the mathematical sciences of statistics and probability, their sub-disciplines, and related fields. For additional related terms, see Glossary of mathematics and Glossary of experimental design.
In statistics, Poisson regression is a generalized linear model form of regression analysis used to model count data and contingency tables. Poisson regression assumes the response variable Y has a Poisson distribution, and assumes the logarithm of its expected value can be modeled by a linear combination of unknown parameters. A Poisson regression model is sometimes known as a log-linear model, especially when used to model contingency tables.
In statistics, resampling is the creation of new samples based on one observed sample. Resampling methods are:
Permutation tests
Bootstrapping
Cross validation
Post-Modern Portfolio Theory (PMPT) is an extension of the traditional Modern Portfolio Theory (MPT), an application of mean-variance analysis (MVA). Both theories propose how rational investors can use diversification to optimize their portfolios.
In statistics, dispersion is the extent to which a distribution is stretched or squeezed. Common examples of measures of statistical dispersion are the variance, standard deviation, and interquartile range. For instance, when the variance of data in a set is large, the data is widely scattered. On the other hand, when the variance is small, the data in the set is clustered.
In probability and statistics, an elliptical distribution is any member of a broad family of probability distributions that generalize the multivariate normal distribution. Intuitively, in the simplified two and three dimensional case, the joint distribution forms an ellipse and an ellipsoid, respectively, in iso-density plots.
In statistics, linear regression is a linear approach for modelling the relationship between a scalar response and one or more explanatory variables. The case of one explanatory variable is called simple linear regression; for more than one, the process is called multiple linear regression. This term is distinct from multivariate linear regression, where multiple correlated dependent variables are predicted, rather than a single scalar variable.
This page is based on this Wikipedia article Text is available under the CC BY-SA 4.0 license; additional terms may apply. Images, videos and audio are available under their respective licenses.