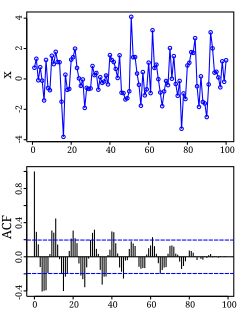
Autocorrelation, also known as serial correlation, is the correlation of a signal with a delayed copy of itself as a function of delay. Informally, it is the similarity between observations as a function of the time lag between them. The analysis of autocorrelation is a mathematical tool for finding repeating patterns, such as the presence of a periodic signal obscured by noise, or identifying the missing fundamental frequency in a signal implied by its harmonic frequencies. It is often used in signal processing for analyzing functions or series of values, such as time domain signals.
Information theory is the scientific study of the quantification, storage, and communication of information. The field was fundamentally established by the works of Harry Nyquist and Ralph Hartley, in the 1920s, and Claude Shannon in the 1940s. The field is at the intersection of probability theory, statistics, computer science, statistical mechanics, information engineering, and electrical engineering.
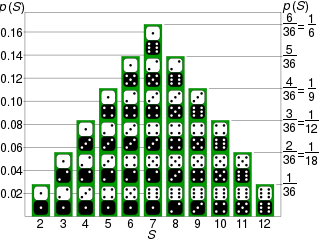
Probability is the branch of mathematics concerning numerical descriptions of how likely an event is to occur, or how likely it is that a proposition is true. The probability of an event is a number between 0 and 1, where, roughly speaking, 0 indicates impossibility of the event and 1 indicates certainty. The higher the probability of an event, the more likely it is that the event will occur. A simple example is the tossing of a fair (unbiased) coin. Since the coin is fair, the two outcomes are both equally probable; the probability of "heads" equals the probability of "tails"; and since no other outcomes are possible, the probability of either "heads" or "tails" is 1/2.

Signal processing is an electrical engineering subfield that focuses on analysing, modifying, and synthesizing signals such as sound, images, and scientific measurements. Signal processing techniques can be used to improve transmission, storage efficiency and subjective quality and to also emphasize or detect components of interest in a measured signal.

In signal processing, white noise is a random signal having equal intensity at different frequencies, giving it a constant power spectral density. The term is used, with this or similar meanings, in many scientific and technical disciplines, including physics, acoustical engineering, telecommunications, and statistical forecasting. White noise refers to a statistical model for signals and signal sources, rather than to any specific signal. White noise draws its name from white light, although light that appears white generally does not have a flat power spectral density over the visible band.

In probability theory and related fields, a stochastic or random process is a mathematical object usually defined as a family of random variables. Many stochastic processes can be represented by time series. However, a stochastic process is by nature continuous while a time series is a set of observations indexed by integers. A stochastic process may involve several related random variables.
Bayesian inference is a method of statistical inference in which Bayes' theorem is used to update the probability for a hypothesis as more evidence or information becomes available. Bayesian inference is an important technique in statistics, and especially in mathematical statistics. Bayesian updating is particularly important in the dynamic analysis of a sequence of data. Bayesian inference has found application in a wide range of activities, including science, engineering, philosophy, medicine, sport, and law. In the philosophy of decision theory, Bayesian inference is closely related to subjective probability, often called "Bayesian probability".
Pattern recognition is the automated recognition of patterns and regularities in data. It has applications in statistical data analysis, signal processing, image analysis, information retrieval, bioinformatics, data compression, computer graphics and machine learning. Pattern recognition has its origins in statistics and engineering; some modern approaches to pattern recognition include the use of machine learning, due to the increased availability of big data and a new abundance of processing power. However, these activities can be viewed as two facets of the same field of application, and together they have undergone substantial development over the past few decades. A modern definition of pattern recognition is:
The field of pattern recognition is concerned with the automatic discovery of regularities in data through the use of computer algorithms and with the use of these regularities to take actions such as classifying the data into different categories.

The power spectrum of a time series describes the distribution of power into frequency components composing that signal. According to Fourier analysis, any physical signal can be decomposed into a number of discrete frequencies, or a spectrum of frequencies over a continuous range. The statistical average of a certain signal or sort of signal as analyzed in terms of its frequency content, is called its spectrum.
Bayesian statistics is a theory in the field of statistics based on the Bayesian interpretation of probability where probability expresses a degree of belief in an event. The degree of belief may be based on prior knowledge about the event, such as the results of previous experiments, or on personal beliefs about the event. This differs from a number of other interpretations of probability, such as the frequentist interpretation that views probability as the limit of the relative frequency of an event after many trials.

In signal processing, independent component analysis (ICA) is a computational method for separating a multivariate signal into additive subcomponents. This is done by assuming that the subcomponents are non-Gaussian signals and that they are statistically independent from each other. ICA is a special case of blind source separation. A common example application is the "cocktail party problem" of listening in on one person's speech in a noisy room.
Failure rate is the frequency with which an engineered system or component fails, expressed in failures per unit of time. It is usually denoted by the Greek letter λ (lambda) and is often used in reliability engineering.
Reliability engineering is a sub-discipline of systems engineering that emphasizes the ability of equipment to function without failure. Reliability describes the ability of a system or component to function under stated conditions for a specified period of time. Reliability is closely related to availability, which is typically described as the ability of a component or system to function at a specified moment or interval of time.
In probability theory and statistics, a copula is a multivariate cumulative distribution function for which the marginal probability distribution of each variable is uniform on the interval [0, 1]. Copulas are used to describe the dependence between random variables. Their name comes from the Latin for "link" or "tie", similar but unrelated to grammatical copulas in linguistics. Copulas have been used widely in quantitative finance to model and minimize tail risk and portfolio-optimization applications.
In metrology, measurement uncertainty is the expression of the statistical dispersion of the values attributed to a measured quantity. All measurements are subject to uncertainty and a measurement result is complete only when it is accompanied by a statement of the associated uncertainty, such as the standard deviation. By international agreement, this uncertainty has a probabilistic basis and reflects incomplete knowledge of the quantity value. It is a non-negative parameter.
Uncertainty quantification (UQ) is the science of quantitative characterization and reduction of uncertainties in both computational and real world applications. It tries to determine how likely certain outcomes are if some aspects of the system are not exactly known. An example would be to predict the acceleration of a human body in a head-on crash with another car: even if we exactly knew the speed, small differences in the manufacturing of individual cars, how tightly every bolt has been tightened, etc., will lead to different results that can only be predicted in a statistical sense.
An optimal decision is a decision that leads to at least as good a known or expected outcome as all other available decision options. It is an important concept in decision theory. In order to compare the different decision outcomes, one commonly assigns a utility value to each of them.

A probability box is a characterization of an uncertain number consisting of both aleatoric and epistemic uncertainties that is often used in risk analysis or quantitative uncertainty modeling where numerical calculations must be performed. Probability bounds analysis is used to make arithmetic and logical calculations with p-boxes.
Probability bounds analysis (PBA) is a collection of methods of uncertainty propagation for making qualitative and quantitative calculations in the face of uncertainties of various kinds. It is used to project partial information about random variables and other quantities through mathematical expressions. For instance, it computes sure bounds on the distribution of a sum, product, or more complex function, given only sure bounds on the distributions of the inputs. Such bounds are called probability boxes, and constrain cumulative probability distributions.
In statistics, Whittle likelihood is an approximation to the likelihood function of a stationary Gaussian time series. It is named after the mathematician and statistician Peter Whittle, who introduced it in his PhD thesis in 1951. It is commonly utilized in time series analysis and signal processing for parameter estimation and signal detection.


