California's 26th congressional district

Last updated

California's 26th congressional district
California's 26th congressional district (since 2023).svg
California's 26th congressional district
Interactive map of district boundaries since 2023 (Used in the 2022 elections)
Representative
  Julia Brownley
DWestlake Village
Population (2022)758,064
Median household
income
$107,265 [1]
Ethnicity
Cook PVI D+8 [2]

California 26th congressional district is a congressional district in the U.S. state of California currently represented by Democrat Julia Brownley.

Contents

The district is located on the South Coast, comprising most of Ventura County as well as a small portion of Los Angeles County. Cities in the district include Camarillo, Oxnard, Santa Paula, Thousand Oaks, Westlake Village, Moorpark, and part of Simi Valley. In 2022, the district lost Ojai and most of Ventura and added Calabasas, Agoura Hills, and the sparsely populated northern half of Ventura County. [3]

From 2003 to 2013, the district spanned the foothills of the San Gabriel Valley from La Cañada Flintridge to Rancho Cucamonga. David Dreier, a Republican, represented the district during this period.

Recent election results from statewide races

YearOfficeResults
1992 President   Clinton 56.8 – 24.3%
Senator   Boxer 55.4 – 35.6%
Senator   Feinstein 61.5 – 30.1%
1994 Governor
Senator
1996 President
1998 Governor
Senator
2000 President [4]   Gore 70.3 – 25.4%
Senator [5]   Feinstein 69.9 – 21.7%
2002 Governor [6]   Simon 54.3 – 37.6%
2003 Recall [7] [8]  Green check.svg Yes 67.9 – 32.1%
  Schwarzenegger 61.1 – 20.3%
2004 President [9]   Bush 55.1 – 43.7%
Senator [10]   Boxer 48.2 – 47.3%
2006 Governor [11]   Schwarzenegger 65.1 – 30.5%
Senator [12]   Feinstein 48.0 – 47.4%
2008 President [13]   Obama 51.0 – 47.0%
2010 Governor   Whitman 50.4 – 43.8%
Senator   Fiorina 52.7 – 41.9%
2012 President   Obama 54.0 – 43.7%
Senator   Feinstein 56.2 – 43.8%
2014 Governor   Brown 55.1 – 45.9%
2016 President   Clinton 57.9 – 36.0%
Senator   Harris 60.8 – 39.2%
2018 Governor   Newsom 57.3 – 42.7%
Senator   Feinstein 52.1 – 47.9%
2020 President   Biden 61.4 – 36.5%
2021 Recall [14]  Red x.svg No 59.1 – 40.9%
2022 Governor   Newsom 53.7 – 46.3%
Senator   Padilla 55.2 – 44.8%

2005 special elections

[15]

Proposition 73

Parental notification before termination of minors' pregnancy.

  • 55.0% YES
  • 45.0% NO

Proposition 77

Redistricting according to a panel of retired judges.

  • 49.8% YES
  • 50.2% NO

Proposition 80

Regulation of electric grids and services through California.

  • 32.1% YES
  • 67.9% NO

List of members representing the district

MemberPartyTermCong
ress(es)
Electoral historyCounties
District created January 3, 1953
Sam Yorty, 1954.jpg
Sam Yorty
(Los Angeles)
Democratic January 3, 1953 –
January 3, 1955
83rd Redistricted from the 14th district and re-elected in 1952.
Retired to run for U.S. Senator.
Los Angeles
James Roosevelt, 1963.jpg
James Roosevelt
(Los Angeles)
Democratic January 3, 1955 –
September 30, 1965
84th
85th
86th
87th
88th
89th
Elected in 1954.
Re-elected in 1956.
Re-elected in 1958.
Re-elected in 1960.
Re-elected in 1962.
Re-elected in 1964.
Resigned to become U.S. delegate to UNESCO.
VacantSeptember 30, 1965 –
December 15, 1965
89th
Tom Rees.jpg
Thomas M. Rees
(Los Angeles)
Democratic December 15, 1965 –
January 3, 1975
89th
90th
91st
92nd
93rd
Elected to finish Roosevelt's term.
Re-elected in 1966.
Re-elected in 1968
Re-elected in 1970.
Re-elected in 1972.
Redistricted to the 23rd district .
John H. Rousselot.jpg
John H. Rousselot
(San Marino)
Republican January 3, 1975 –
January 3, 1983
94th
95th
96th
97th
Redistricted from the 24th district and re-elected in 1974.
Re-elected in 1976.
Re-elected in 1978.
Re-elected in 1980.
Redistricted to the 30th district and lost.
Howard Berman official photo.jpg
Howard Berman
(Los Angeles)
Democratic January 3, 1983 –
January 3, 1993
98th
99th
100th
101st
102nd
Re-elected in 1982.
Re-elected in 1984.
Re-elected in 1986.
Re-elected in 1988.
Re-elected in 1990.
Re-elected in 1992.
Re-elected in 1994.
Re-elected in 1996.
Re-elected in 1998.
Re-elected in 2000.
Redistricted to the 28th district .
Los Angeles (central San Fernando Valley)
January 3, 1993 –
January 3, 2003
103rd
104th
105th
106th
107th
Los Angeles (San Fernando)
DTDreier.jpg
David Dreier
(San Dimas)
Republican January 3, 2003 –
January 3, 2013
108th
109th
110th
111th
112th
Redistricted from the 28th district and re-elected in 2002.
Re-elected in 2004.
Re-elected in 2006.
Re-elected in 2008.
Re-elected in 2010.
Retired.
2003–2013
United States House of Representatives, California District 26.png
Los Angeles (eastern suburbs), San Bernardino (western suburbs)
Julia Brownley 113th Congress.jpg
Julia Brownley
(Westlake Village)
Democratic January 3, 2013 –
present
113th
114th
115th
116th
117th
118th
Elected in 2012.
Re-elected in 2014.
Re-elected in 2016.
Re-elected in 2018.
Re-elected in 2020.
Re-elected in 2022.
2013–2023
California US Congressional District 26 (since 2013).tif
Central Coast including Oxnard and
Thousand Oaks
2023–present
California's 26th congressional district (since 2023) (new version).svg

Election results

19521954195619581960196219641965 (Special)19661968197019721974197619781980198219841986198819901992199419961998200020022004200620082010201220142016201820202022

1952

United States House of Representatives elections, 1952 [16]
PartyCandidateVotes%
Democratic Sam Yorty (incumbent) 157,973 88
Progressive Horace V. Alexander21,46512
Total votes179,438 100.0
Turnout  
Democratic hold

1954

United States House of Representatives elections, 1954 [17]
PartyCandidateVotes%
Democratic James Roosevelt 94,261 60.1
Republican Theodore R. "Ted" Owings62,58539.9
Total votes156,856 100.0
Turnout  
Democratic hold

1956

United States House of Representatives elections, 1956 [18]
PartyCandidateVotes%
Democratic James Roosevelt (incumbent) 133,036 68.8
Republican Edward H. Gibbons60,23031.2
Total votes193,266 100.0
Turnout  
Democratic hold

1958

United States House of Representatives elections, 1958 [19]
PartyCandidateVotes%
Democratic James Roosevelt (incumbent) 125,495 72.2
Republican Crispus Wright48,24827.8
Total votes173,743 100.0
Turnout  
Democratic hold

1960

United States House of Representatives elections, 1960 [20]
PartyCandidateVotes%
Democratic James Roosevelt (incumbent) 150,318 73.4
Republican William E. McIntyre54,54026.6
Total votes204,818 100.0
Turnout  
Democratic hold

1962

United States House of Representatives elections, 1962 [21]
PartyCandidateVotes%
Democratic James Roosevelt (incumbent) 112,162 68.3
Republican Daniel Beltz52,06331.7
Total votes164,225 100.0
Turnout  
Democratic hold

1964

United States House of Representatives elections, 1964 [22]
PartyCandidateVotes%
Democratic James Roosevelt (incumbent) 136,025 70.3
Republican Gil Seton57,20929.7
Total votes193,234 100.0
Turnout  
Democratic hold

1965 (Special)

1965 special election [23]
PartyCandidateVotes%
Democratic Thomas M. Rees 59.4
Republican Edward M. Marshall40.6
Total votes{{{votes}}} 100.0
Turnout  
Democratic hold

1966

United States House of Representatives elections, 1966 [24]
PartyCandidateVotes%
Democratic Thomas M. Rees (incumbent) 103,289 62.3
Republican Irving Teichner62,44137.7
Total votes165,730 100.0
Turnout  
Democratic hold

1968

United States House of Representatives elections, 1968 [25]
PartyCandidateVotes%
Democratic Thomas M. Rees (incumbent) 132,447 65.5
Republican Irving Teichner63,39331.3
Peace and Freedom Jack Weinberg 6,3943.2
Total votes202,234 100.0
Turnout  
Democratic hold

1970

United States House of Representatives elections, 1970 [26]
PartyCandidateVotes%
Democratic Thomas M. Rees (incumbent) 130,499 71.3
Republican Nathaniel Jay Friedman47,26025.8
Peace and Freedom Lewis B. McCammon3,6772.0
American Independent Howard E. Hallinan1,6390.9
Total votes183,075 100.0
Turnout  
Democratic hold

1972

United States House of Representatives elections, 1972 [27]
PartyCandidateVotes%
Democratic Thomas M. Rees (incumbent) 160,932 68.6
Republican Philip Robert Rutta65,47327.9
Peace and Freedom Mike Timko8,0943.5
Total votes234,499 100.0
Turnout  
Democratic hold

1974

United States House of Representatives elections, 1974 [28]
PartyCandidateVotes%
Republican John H. Rousselot (inc.) 80,782 58.9
Democratic Paul A. Conforti56,48741.1
Total votes137,269 100.0
Turnout  
Republican hold

1976

United States House of Representatives elections, 1976 [29]
PartyCandidateVotes%
Republican John H. Rousselot (inc.) 112,619 65.6
Democratic Latta Bruce59,09334.4
Total votes171,712 100.0
Turnout  
Republican hold

1978

United States House of Representatives elections, 1978 [30]
PartyCandidateVotes%
Republican John H. Rousselot (inc.) 113,059 100.0
Turnout  
Republican hold

1980

United States House of Representatives elections, 1980 [31]
PartyCandidateVotes%
Republican John H. Rousselot (inc.) 116,715 70.9
Democratic Joseph Louis Lisoni40,09924.4
Libertarian William "B. J." Wagener7,7004.7
Total votes164,514 100.0
Turnout  
Republican hold

1982

United States House of Representatives elections, 1982 [32]
PartyCandidateVotes%
Democratic Howard Berman 97,383 59.6
Republican Hal Phillips66,07240.4
Total votes163,455 100.0
Turnout  
Democratic gain from Republican

1984

United States House of Representatives elections, 1984 [33]
PartyCandidateVotes%
Democratic Howard Berman (incumbent) 117,080 62.8
Republican Miriam Ojeda69,37237.2
Total votes186,452 100.0
Turnout  
Democratic hold

1986

United States House of Representatives elections, 1986 [34]
PartyCandidateVotes%
Democratic Howard Berman (incumbent) 98,091 65.1
Republican Robert M. Kerns52,66234.9
Total votes150,753 100.0
Turnout  
Democratic hold

1988

United States House of Representatives elections, 1988 [35]
PartyCandidateVotes%
Democratic Howard Berman (incumbent) 126,930 70.3
Republican Gerald C. "Brodie" Broderson53,51829.7
Total votes180,448 100.0
Turnout  
Democratic hold

1990

United States House of Representatives elections, 1990 [36]
PartyCandidateVotes%
Democratic Howard Berman (incumbent) 78,031 61.1
Republican Roy Dahlson44,49234.8
Libertarian Bernard Zimring5,2684.1
Total votes127,791 100.0
Turnout  
Democratic hold

1992

United States House of Representatives elections, 1992 [37]
PartyCandidateVotes%
Democratic Howard Berman (incumbent) 73,807 61.0
Republican Gary E. Forsch36,45330.2
Peace and Freedom Margery Hinds7,1805.9
Libertarian Bernard Zimring3,4682.9
Total votes120,908 100.0
Turnout  
Democratic hold

1994

United States House of Representatives elections, 1994 [38]
PartyCandidateVotes%
Democratic Howard Berman (incumbent) 55,145 62.57
Republican Gary E. Forsch28,42332.25
Libertarian Erich D. Miller4,5705.19
Total votes88,138 100.0
Turnout  
Democratic hold

1996

United States House of Representatives elections, 1996 [39]
PartyCandidateVotes%
Democratic Howard Berman (incumbent) 67,525 65.9
Republican Bill Glass29,33228.7
Libertarian Scott Fritschler3,5393.4
Natural Law Gary Hearne2,1192.0
Total votes195,545 100.0
Turnout  
Democratic hold

1998

United States House of Representatives elections, 1998 [40]
PartyCandidateVotes%
Democratic Howard Berman (incumbent) 69,000 82.47
Libertarian Juan Carlos Ros6,5567.84
Green Maria Armoudian 4,8585.81
Natural Law David L. Cossak3,2483.88
Total votes83,662 100.0
Turnout  
Democratic hold

2000

United States House of Representatives elections, 2000 [41]
PartyCandidateVotes%
Democratic Howard Berman (incumbent) 96,500 84.1
Libertarian Bill Farley13,05211.4
Natural Law David L. Cossak5,2294.5
No partyRobert Edwards (write-in)50.0
Total votes114,786 100.0
Turnout  
Democratic hold

2002

United States House of Representatives elections, 2002 [42]
PartyCandidateVotes%
Republican David Dreier (incumbent) 95,360 63.8
Democratic Marjorie Musser Mikels50,08133.5
Libertarian Randall Weissbuch4,0892.7
Total votes149,530 100.0
Turnout  
Republican hold

2004

United States House of Representatives elections, 2004 [43]
PartyCandidateVotes%
Republican David Dreier (incumbent) 134,596 51.6
Democratic Cynthia Matthews107,52246.8
Libertarian Randall Weissbuch9,0891.6
Total votes251,207 100.0
Turnout  
Republican hold

2006

United States House of Representatives elections, 2006 [44]
PartyCandidateVotes%
Republican David Dreier (incumbent) 102,028 48.29%
Democratic Cynthia Matthews99,87847.27%
Libertarian Ted Brown5,8872.79%
American Independent Elliott Graham3,5031.65%
Total votes211,296 100.0
Turnout  
Republican hold

2008

United States House of Representatives elections, 2008 [45]
PartyCandidateVotes%
Republican David Dreier (incumbent) 140,615 52.7
Democratic Russ Warner108,03940.4
Libertarian Ted Brown18,4766.9
Total votes267,130 100.0
Turnout  
Republican hold

2010

United States House of Representatives elections, 2010 [46]
PartyCandidateVotes%
Republican David Dreier (incumbent) 112,774 54.13
Democratic Russ Warner76,09336.52
American Independent David L. Miller12,7846.14
Libertarian Randall Weissbuch6,6963.21
Total votes208,347 100.00
Turnout  
Republican hold

2012

United States House of Representatives elections in California, 2012
Primary election
PartyCandidateVotes%
Republican Tony Strickland 49,04344.1
Democratic Julia Brownley 29,89226.9
No party preference Linda Parks 20,30118.3
Democratic Jess Herrera7,2446.5
Democratic David Cruz Thayne2,8092.5
Democratic Alex Maxwell Goldberg1,8801.7
Total votes111,169 100.0
General election
Democratic Julia Brownley 139,072 53%
Republican Tony Strickland 124,86347%
Total votes263,935 100%
Democratic gain from Republican

2014

United States House of Representatives elections, 2014 [47]
PartyCandidateVotes%
Democratic Julia Brownley (incumbent) 87,176 51%
Republican Jeff Gorell 82,65349%
Total votes169,829 100%
Democratic hold

2016

United States House of Representatives elections, 2016
PartyCandidateVotes%
Democratic Julia Brownley (incumbent) 169,248 60%
Republican Rafael A. Dagnesses111,05940%
Total votes280,307 100%
Democratic hold

2018

United States House of Representatives elections, 2018 [48]
PartyCandidateVotes%
Democratic Julia Brownley (incumbent) 110,804 60%
Republican Antonio Sabato Jr. 73,41639%
Total votes184,220 100%
Democratic hold

2020

2020 United States House of Representatives elections in California
PartyCandidateVotes%
Democratic Julia Brownley (incumbent) 208,856 60.6
Republican Ronda Baldwin-Kennedy135,87739.4
Total votes344,733 100.0

2022

2022 United States House of Representatives elections in California
PartyCandidateVotes%
Democratic Julia Brownley (incumbent) 134,575 54.5
Republican Matt Jacobs112,21445.5
Total votes246,789 100.0

Historical district boundaries

2003 - 2013 United States House of Representatives, California District 26.png
2003 - 2013
2013 - 2023 California US Congressional District 26 (since 2013).tif
2013 - 2023

See also

Related Research Articles

California's 9th congressional district is a congressional district in the U.S. state of California. Josh Harder, a Democrat, has represented the district since January 2023.

California's 11th congressional district is a congressional district in the U.S. state of California and is represented by Nancy Pelosi.

California's 18th congressional district is a congressional district located in the U.S. state of California. The district is currently represented by Democrat Zoe Lofgren. Since the 2022 election, the district is landlocked and includes all of San Benito County and parts of Santa Clara and Monterey counties, including Salinas, Hollister, Watsonville, Gilroy, Soledad, and downtown and eastern San Jose.

California's 5th congressional district is a U.S. congressional district in California.

California's 8th congressional district is a congressional district in the U.S. state of California. As of 2023, Democrat John Garamendi represents the district. Currently, the 8th district includes parts of the Bay Area counties of Contra Costa County and Solano County, including the cities of Vallejo, Fairfield, Richmond and parts of Martinez.

California's 7th congressional district is a United States congressional district in California. Doris Matsui, a Democrat, has represented the district since January 2023.

California's 1st congressional district is a U.S. congressional district in California. Doug LaMalfa, a Republican, has represented the district since January 2013. Currently, it encompasses the northeastern part of the state. Since the 2022 election, it includes the counties of Butte, Colusa, Glenn, Lassen, Modoc, Shasta, Siskiyou, Sutter, and Tehama, and most of Yuba County. The largest cities in the district are Chico, Redding, and Yuba City.

California's 3rd congressional district is a U.S. congressional district in California. It includes the northern Sierra Nevada and northeastern suburbs of Sacramento, stretching south to Death Valley. It encompasses Alpine, Inyo, Mono, Nevada, Placer, Plumas, and Sierra counties, as well as parts of El Dorado, Sacramento, and Yuba counties. It includes the Sacramento suburbs of Roseville, Folsom, Orangevale, Rocklin, and Lincoln, and the mountain towns of Quincy, South Lake Tahoe, Truckee, Mammoth Lakes, and Bishop. The district is represented by Republican Kevin Kiley.

California's 14th congressional district is a congressional district in the U.S. state of California. Eric Swalwell, a Democrat, has represented the district since January 2023.

California's 16th congressional district is a congressional district in the U.S. state of California. It includes portions of Santa Clara, San Mateo, and Santa Cruz counties, extending from the southwestern San Francisco Bay Area through the Santa Cruz Mountains to the Pacific coast. The district is currently represented by Democrat Anna Eshoo.

California's 23rd congressional district is a congressional district in the U.S. state of California. The district is represented in the 118th United States Congress by Jay Obernolte.

California's 24th congressional district is a congressional district in the U.S. state of California. The district is currently represented by Salud Carbajal. It contains all of Santa Barbara County, most of San Luis Obispo County, and part of Ventura County. Cities in the district include Santa Barbara, Ventura, San Luis Obispo, Santa Maria, and Ojai.

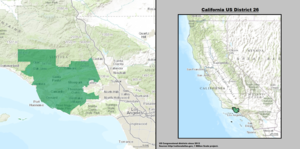
California's 27th congressional district is a congressional district in the U.S. state of California. The district is currently represented by Republican Mike Garcia. It was one of 18 districts that would have voted for Joe Biden in the 2020 presidential election had they existed in their current configuration while being won or held by a Republican in 2022, and the only Republican-held congressional district to include portions of the actual city of Los Angeles.

<span class="mw-page-title-main">California's 29th congressional district</span> U.S. House district for California

California's 29th congressional district is a congressional district in the U.S. state of California based in the north central San Fernando Valley. The district is represented by Democrat Tony Cárdenas.

<span class="mw-page-title-main">California's 30th congressional district</span> U.S. House district for California

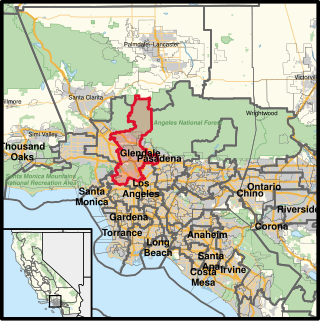
California's 30th congressional district is a congressional district in the U.S. state of California. The 30th district takes in all of Burbank and Glendale, the Linda Vista neighborhood of Pasadena, and the Los Angeles communities of Tujunga, Hollywood, West Hollywood, Edendale, Park La Brea, Hancock Park, and westside Echo Park. The district is currently represented by Democrat Adam Schiff.

California's 31st congressional district is a congressional district in Los Angeles County, in the U.S. state of California. The district is located in the San Gabriel Valley.

<span class="mw-page-title-main">California's 32nd congressional district</span> U.S. House district for California

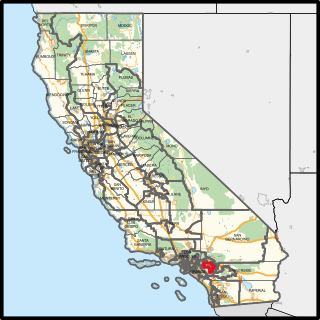
California's 32nd congressional district is a congressional district in the U.S. state of California based in Los Angeles County. The 32nd district takes in the city of Malibu and the Los Angeles neighborhoods of Pacific Palisades, Beverly Glen, Bel Air, Studio City, Sherman Oaks, Woodland Hills, West Hills, Canoga Park, Winnetka, Reseda, Encino, Chatsworth, Northridge, Brentwood, North Hills, as well as the south side of Granada Hills.

<span class="mw-page-title-main">California's 35th congressional district</span> U.S. House district for California

California's 35th congressional district is a U.S. congressional district in California. The district is currently represented by Democrat Norma Torres.

<span class="mw-page-title-main">California's 39th congressional district</span> U.S. House district for California

California's 39th congressional district is a congressional district in the U.S. state of California. The district includes parts of Riverside County, including Jurupa Valley, Riverside, Moreno Valley, and Perris. The district has been represented by Democrat Mark Takano ever since he was redistricted from the 41st congressional district in 2022.

<span class="mw-page-title-main">Julia Brownley</span> American politician (born 1952)

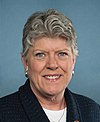
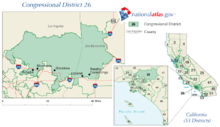
Julia Andrews Brownley is an American businesswoman and politician who has been the United States representative for California's 26th congressional district since 2013. A Democrat, she served in the California State Assembly from 2006 to 2012. Before her political career, she worked in marketing and sales.

References

  1. "My Congressional District".
  2. "2022 Cook PVI: District Map and List". Cook Political Report. Retrieved January 10, 2023.
  3. "CA 2022 Congressional". Dave's Redistricting. January 4, 2022. Retrieved November 14, 2022.
  4. Statement of Vote (2000 President) Archived June 11, 2007, at the Wayback Machine
  5. Statement of Vote (2000 Senator) Archived June 11, 2007, at the Wayback Machine
  6. Statement of Vote (2002 Governor) Archived November 11, 2010, at the Wayback Machine
  7. Statement of Vote (2003 Recall Question) Archived May 20, 2011, at the Wayback Machine
  8. Statement of Vote (2003 Governor) Archived May 20, 2011, at the Wayback Machine
  9. Statement of Vote (2004 President) Archived August 1, 2010, at the Wayback Machine
  10. Statement of Vote (2004 Senator) Archived August 10, 2011, at the Wayback Machine
  11. Statement of Vote (2006 Governor) Archived August 10, 2011, at the Wayback Machine
  12. Statement of Vote (2006 Senator) Archived August 10, 2011, at the Wayback Machine
  13. (2008 President) Archived February 11, 2009, at the Wayback Machine
  14. "Counties by Congressional District for Recall Question" (PDF). sos.ca.gov. September 14, 2021. Retrieved May 2, 2022.
  15. Statement of Vote – 2005 Special Statewide Election Archived 2006-02-12 at the Wayback Machine
  16. 1952 election results
  17. 1954 election results
  18. 1956 election results
  19. 1958 election results
  20. 1960 election results
  21. 1962 election results
  22. 1964 election results
  23. 1965 special election results
  24. 1966 election results
  25. 1968 election results
  26. 1970 election results
  27. 1972 election results
  28. 1974 election results
  29. 1976 election results
  30. 1978 election results
  31. 1980 election results
  32. 1982 election results
  33. 1984 election results
  34. 1986 election results
  35. 1988 election results
  36. 1990 election results
  37. 1992 election results
  38. 1994 election results
  39. 1996 election results
  40. 1998 election results
  41. 2000 election results
  42. 2002 general election results Archived February 3, 2009, at the Wayback Machine
  43. 2004 general election results [ permanent dead link ]
  44. 2006 general election results Archived November 27, 2008, at the Wayback Machine
  45. 2008 general election results Archived December 21, 2008, at the Wayback Machine
  46. 2010 general election results [ permanent dead link ]
  47. 2010 general election results [ permanent dead link ]
  48. U.S. Representative District 26 - Districtwide Results

34°12′N117°48′W / 34.2°N 117.8°W / 34.2; -117.8