Critical point may refer to:

A statistical hypothesis test is a method of statistical inference used to decide whether the data sufficiently support a particular hypothesis. A statistical hypothesis test typically involves a calculation of a test statistic. Then a decision is made, either by comparing the test statistic to a critical value or equivalently by evaluating a p-value computed from the test statistic. Roughly 100 specialized statistical tests have been defined.

In probability and statistics, Student's t distribution is a continuous probability distribution that generalizes the standard normal distribution. Like the latter, it is symmetric around zero and bell-shaped.
In statistical hypothesis testing, a result has statistical significance when a result at least as "extreme" would be very infrequent if the null hypothesis were true. More precisely, a study's defined significance level, denoted by , is the probability of the study rejecting the null hypothesis, given that the null hypothesis is true; and the p-value of a result, , is the probability of obtaining a result at least as extreme, given that the null hypothesis is true. The result is statistically significant, by the standards of the study, when . The significance level for a study is chosen before data collection, and is typically set to 5% or much lower—depending on the field of study.

In statistical physics and mathematics, percolation theory describes the behavior of a network when nodes or links are added. This is a geometric type of phase transition, since at a critical fraction of addition the network of small, disconnected clusters merge into significantly larger connected, so-called spanning clusters. The applications of percolation theory to materials science and in many other disciplines are discussed here and in the articles Network theory and Percolation.

An F-test is any statistical test used to compare the variances of two samples or the ratio of variances between multiple samples. The test statistic, random variable F, is used to determine if the tested data has an F-distribution under the true null hypothesis, and true customary assumptions about the error term (ε). It is most often used when comparing statistical models that have been fitted to a data set, in order to identify the model that best fits the population from which the data were sampled. Exact "F-tests" mainly arise when the models have been fitted to the data using least squares. The name was coined by George W. Snedecor, in honour of Ronald Fisher. Fisher initially developed the statistic as the variance ratio in the 1920s.
The flicker fusion threshold, also known as critical flicker frequency or flicker fusion rate, is the frequency at which a flickering light appears steady to the average human observer. It is a concept studied in vision science, more specifically in the psychophysics of visual perception. A traditional term for "flicker fusion" is "persistence of vision", but this has also been used to describe positive afterimages or motion blur. Although flicker can be detected for many waveforms representing time-variant fluctuations of intensity, it is conventionally, and most easily, studied in terms of sinusoidal modulation of intensity.
In null-hypothesis significance testing, the -value is the probability of obtaining test results at least as extreme as the result actually observed, under the assumption that the null hypothesis is correct. A very small p-value means that such an extreme observed outcome would be very unlikely under the null hypothesis. Even though reporting p-values of statistical tests is common practice in academic publications of many quantitative fields, misinterpretation and misuse of p-values is widespread and has been a major topic in mathematics and metascience. In 2016, the American Statistical Association (ASA) made a formal statement that "p-values do not measure the probability that the studied hypothesis is true, or the probability that the data were produced by random chance alone" and that "a p-value, or statistical significance, does not measure the size of an effect or the importance of a result" or "evidence regarding a model or hypothesis". That said, a 2019 task force by ASA has issued a statement on statistical significance and replicability, concluding with: "p-values and significance tests, when properly applied and interpreted, increase the rigor of the conclusions drawn from data".
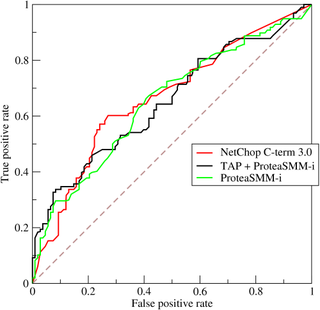
A receiver operating characteristic curve, or ROC curve, is a graphical plot that illustrates the performance of a binary classifier model at varying threshold values.

In thermodynamics, a critical point is the end point of a phase equilibrium curve. One example is the liquid–vapor critical point, the end point of the pressure–temperature curve that designates conditions under which a liquid and its vapor can coexist. At higher temperatures, the gas cannot be liquefied by pressure alone; at lower pressures, it cannot be liquefied by temperature alone. At the critical point, defined by a critical temperatureTc and a critical pressurepc, phase boundaries vanish. Other examples include the liquid–liquid critical points in mixtures, and the ferromagnet–paramagnet transition in the absence of an external magnetic field.
In statistical hypothesis testing, a type I error, or a false positive, is the rejection of the null hypothesis when it is actually true. For example, an innocent person may be convicted. A type II error, or a false negative, is the failure to reject a null hypothesis that is actually false. For example: a guilty person may be not convicted.
Tipping point or TippingPoint or The Tipping Point may refer to:
Extinction threshold is a term used in conservation biology to explain the point at which a species, population or metapopulation, experiences an abrupt change in density or number because of an important parameter, such as habitat loss. It is at this critical value below which a species, population, or metapopulation, will go extinct, though this may take a long time for species just below the critical value, a phenomenon known as extinction debt.
The percolation threshold is a mathematical concept in percolation theory that describes the formation of long-range connectivity in random systems. Below the threshold a giant connected component does not exist; while above it, there exists a giant component of the order of system size. In engineering and coffee making, percolation represents the flow of fluids through porous media, but in the mathematics and physics worlds it generally refers to simplified lattice models of random systems or networks (graphs), and the nature of the connectivity in them. The percolation threshold is the critical value of the occupation probability p, or more generally a critical surface for a group of parameters p1, p2, ..., such that infinite connectivity (percolation) first occurs.
In statistical quality control, the CUSUM is a sequential analysis technique developed by E. S. Page of the University of Cambridge. It is typically used for monitoring change detection. CUSUM was announced in Biometrika, in 1954, a few years after the publication of Wald's sequential probability ratio test (SPRT).
More colloquially, a first passage time in a stochastic system, is the time taken for a state variable to reach a certain value. Understanding this metric allows one to further understand the physical system under observation, and as such has been the topic of research in very diverse fields, from economics to ecology.
Seed-based d mapping or SDM is a statistical technique created by Joaquim Radua for meta-analyzing studies on differences in brain activity or structure which used neuroimaging techniques such as fMRI, VBM, DTI or PET. It may also refer to a specific piece of software created by the SDM Project to carry out such meta-analyses.
A false positive is an error in binary classification in which a test result incorrectly indicates the presence of a condition, while a false negative is the opposite error, where the test result incorrectly indicates the absence of a condition when it is actually present. These are the two kinds of errors in a binary test, in contrast to the two kinds of correct result. They are also known in medicine as a false positivediagnosis, and in statistical classification as a false positiveerror.
Misuse of p-values is common in scientific research and scientific education. p-values are often used or interpreted incorrectly; the American Statistical Association states that p-values can indicate how incompatible the data are with a specified statistical model. From a Neyman–Pearson hypothesis testing approach to statistical inferences, the data obtained by comparing the p-value to a significance level will yield one of two results: either the null hypothesis is rejected, or the null hypothesis cannot be rejected at that significance level. From a Fisherian statistical testing approach to statistical inferences, a low p-value means either that the null hypothesis is true and a highly improbable event has occurred or that the null hypothesis is false.