
A commodity market is a market that trades in the primary economic sector rather than manufactured products, such as cocoa, fruit and sugar. Hard commodities are mined, such as gold and oil. Futures contracts are the oldest way of investing in commodities. Commodity markets can include physical trading and derivatives trading using spot prices, forwards, futures, and options on futures. Farmers have used a simple form of derivative trading in the commodity market for centuries for price risk management.
A commodity price index is a fixed-weight index or (weighted) average of selected commodity prices, which may be based on spot or futures prices. It is designed to be representative of the broad commodity asset class or a specific subset of commodities, such as energy or metals. It is an index that tracks a basket of commodities to measure their performance. These indexes are often traded on exchanges, allowing investors to gain easier access to commodities without having to enter the futures market. The value of these indexes fluctuates based on their underlying commodities, and this value can be traded on an exchange in much the same way as stock index futures.

West Texas Intermediate (WTI) is a grade or mix of crude oil; the term is also used to refer to the spot price, the futures price, or assessed price for that oil. In colloquial usage, WTI usually refers to the WTI Crude Oil futures contract traded on the New York Mercantile Exchange (NYMEX). The WTI oil grade is also known as Texas light sweet. Oil produced from any location can be considered WTI if the oil meets the required qualifications. Spot and futures prices of WTI are used as a benchmark in oil pricing. This grade is described as light crude oil because of its low density and sweet because of its low sulfur content.

Brent Crude may refer to any or all of the components of the Brent Complex, a physically and financially traded oil market based around the North Sea of Northwest Europe; colloquially, Brent Crude usually refers to the price of the ICE Brent Crude Oil futures contract or the contract itself. The original Brent Crude referred to a trading classification of sweet light crude oil first extracted from the Brent oilfield in the North Sea in 1976. As production from the Brent oilfield declined to zero in 2021, crude oil blends from other oil fields have been added to the trade classification. The current Brent blend consists of crude oil produced from the Forties, Oseberg, Ekofisk, Troll oil fields and oil drilled from Midland, Texas in the Permian Basin.
The Standard & Poor's Commodity Index (SPCI) is a commodity price index that measures the price changes in a cross section of agricultural and industrial commodities with actively traded U.S. futures contracts, stretching across five sectors - Energy, Metals, Grains, Livestock, and Fibers & Softs. Only commodities that are consumed for industrial use are included in the index. Weights in the index are determined by the dollar value of Commercial Open Interest (COI) for each component commodity, and rebalanced annually each February.
The S&P GSCI serves as a benchmark for investment in the commodity markets and as a measure of commodity performance over time. It is a tradable index that is readily available to market participants of the Chicago Mercantile Exchange. The index was originally developed in 1991, by Goldman Sachs. In 2007, ownership transferred to Standard & Poor's, who currently own and publish it. Futures of the S&P GSCI use a multiple of 250. The index contains a much higher exposure to energy than other commodity price indices such as the Bloomberg Commodity Index.
The Bloomberg Commodity Index (BCOM) is a broadly diversified commodity price index distributed by Bloomberg Index Services Limited. The index was originally launched in 1998 as the Dow Jones-AIG Commodity Index (DJ-AIGCI) and renamed to Dow Jones-UBS Commodity Index (DJ-UBSCI) in 2009, when UBS acquired the index from AIG. On July 1, 2014, the index was rebranded under its current name.
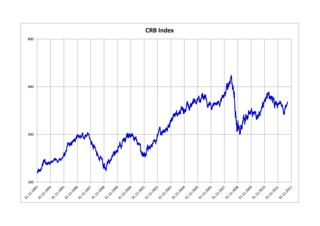
The FTSE/CoreCommodity CRB Index is a commodity futures price index. It was first calculated by Commodity Research Bureau, Inc. in 1957 and made its inaugural appearance in the 1958 CRB Commodity Year Book.

A benchmark crude or marker crude is a crude oil that serves as a reference price for buyers and sellers of crude oil. There are three primary benchmarks, West Texas Intermediate (WTI), Brent Blend, and Dubai Crude. Other well-known blends include the OPEC Reference Basket used by OPEC, Tapis Crude which is traded in Singapore, Western Canadian Select used in Canada, Bonny Light used in Nigeria, Urals oil used in Russia and Mexico's Isthmus. Energy Intelligence Group publishes a handbook which identified 195 major crude streams or blends in its 2011 edition.

Multi Commodity Exchange of India Ltd (MCX) is a commodity exchange based in India. It was established in 2003 by the Government of India and is currently based in Mumbai. It is India's largest commodity derivatives exchange. The average daily turnover of commodity futures contracts increased by 26% to ₹32,424 crore during FY2019-20, as against ₹25,648 crore in FY2018-19. The total turnover of commodity futures traded on the Exchange stood at ₹83.98 lakh crore in FY2019-20. MCX offers options trading in gold and futures trading in non-ferrous metals, bullion, energy, and a number of agricultural commodities.
In May 2006, Deutsche Bank launched a new set of commodity index products called the Deutsche Bank Liquid Commodities Indices Optimum Yield, or DBLCI-OY'. The DBLCI-OY indices are available for 24 commodities drawn from the energy, precious metals, industrial metals, agricultural and livestock sectors. A DBLCI-OY index based on the DBLCI benchmark weights is also available and the optimum yield technology has also been applied to the energy, precious metals, industrial metals and agricultural sector indices. Like the DBLCI, the DBLCI-OY is available in USD, EUR, GBP and JPY on a hedged and un-hedge basis. The DBLCI-OY is rebalanced on the fifth index business day of November when each commodity is adjusted to its base weight. The DBLCI-OY is also listed as an exchange-traded fund (ETF) on the American Stock Exchange.
The DBLCI Mean Reversion Index is a commodity index published by the Deutsche Bank. Launched at the same time as the Deutsche Bank Liquid Commodity Index (DBLCI) in February 2003, the DBLCI-Mean Reversion has the same underlying assets. The listed instruments are also rolled using the same mechanism as the DBLCI, namely energy contracts are rolled monthly and the metal and grain contracts are rolled annually. This occurs between the second and sixth business day of the month. The DBLCI-MR is also quoted in both total returns and excess returns terms in US dollars as well as EUR, JPY and GBP.
The DBLCI-OY Balanced has the same underlying 14 commodities as the DBLCI-OY Broad, but, the energy sector weight is reduced from 55% of the broad index to 35%. The DBLCI-OY Balanced is designed to be UCITS III compliant, that is the weight of no single commodity or strongly correlated securities exceed 35%. The DBLCI-OY Balanced is listed as an ETF on the Deutsche Börse.

S&P Dow Jones Indices LLC is a joint venture between S&P Global, the CME Group, and News Corp that was announced in 2011 and later launched in 2012. It produces, maintains, licenses, and markets stock market indices as benchmarks and as the basis of investable products, such as exchange-traded funds (ETFs), mutual funds, and structured products. The company currently has employees in 15 cities worldwide, including New York, London, Frankfurt, Singapore, Hong Kong, Sydney, Beijing, and Dubai.
The Refinitiv Equal Weight Commodity Index is a major US barometer of commodity prices. The index comprises 17 commodity futures that are continuously rebalanced: cocoa, coffee, copper, corn, cotton, crude oil, gold, heating oil, live cattle, live hogs, natural gas, orange juice, platinum, silver, soybeans, Sugar No. 11, and wheat.
The Canadian Crude Oil Index (CCI) serves as a benchmark for oil produced in Canada. It allows investors to track the price, risk, and volatility of the Canadian commodity.
LME Aluminium stands for a group of spot, forward, and futures contracts, trading on the London Metal Exchange (LME), for delivery of primary Aluminium that can be used for price hedging, physical delivery of sales or purchases, investment, and speculation. Producers, semi-fabricators, consumers, recyclers, and merchants can use Aluminium futures contracts to hedge Aluminium price risks and to reference prices. Notable companies that use LME Aluminium contracts to hedge Aluminium prices include General Motors, Boeing, and Alcoa.
LME Copper stands for a group of spot, forward, and futures contracts, trading on the London Metal Exchange (LME), for delivery of Copper, that can be used for price hedging, physical delivery of sales or purchases, investment, and speculation.
LME Nickel stands for a group of spot, forward, and futures contracts, trading on the London Metal Exchange (LME), for delivery of primary Nickel that can be used for price hedging, physical delivery of sales or purchases, investment, and speculation. Producers, semi-fabricators, consumers, recyclers, and merchants can use Nickel futures contracts to hedge Nickel price risks and to reference prices. As of December 31, 2019, LME Nickel is associated with 153,318 tonnes of physical Nickel stored in 500 LME approved warehouses around the world. This is 5.67% of the 2019 global estimated mined Nickel production of 2.7 million tonnes. Despite the low share of physical Nickel associated with LME Nickel contracts, global physical Nickel transactions are usually based on LME Nickel prices. This practice began in the 1970s to 1982, when producer Nickel prices, especially Canadian producer prices collapsed, and the industry switched to LME prices.
LME Zinc stands for a group of spot, forward, and futures contracts traded on the London Metal Exchange (LME), for delivery of special high-grade Zinc with a 99.995% purity minimum that can be used for price hedging, physical delivery of sales or purchases, investment, and speculation. Producers, semi-fabricators, consumers, recyclers, and merchants can use Zinc futures contracts to hedge Zinc price risks and to reference prices.