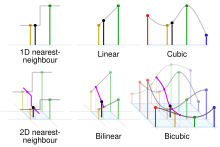
In the mathematical field of numerical analysis, interpolation is a type of estimation, a method of constructing (finding) new data points based on the range of a discrete set of known data points.
Computational geometry is a branch of computer science devoted to the study of algorithms which can be stated in terms of geometry. Some purely geometrical problems arise out of the study of computational geometric algorithms, and such problems are also considered to be part of computational geometry. While modern computational geometry is a recent development, it is one of the oldest fields of computing with a history stretching back to antiquity.

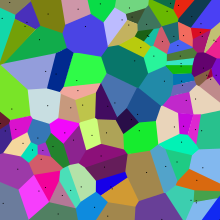
In mathematics, a Voronoi diagram is a partition of a plane into regions close to each of a given set of objects. It can be classified also as a tessellation. In the simplest case, these objects are just finitely many points in the plane. For each seed there is a corresponding region, called a Voronoi cell, consisting of all points of the plane closer to that seed than to any other. The Voronoi diagram of a set of points is dual to that set's Delaunay triangulation.

Nonlinear dimensionality reduction, also known as manifold learning, refers to various related techniques that aim to project high-dimensional data onto lower-dimensional latent manifolds, with the goal of either visualizing the data in the low-dimensional space, or learning the mapping itself. The techniques described below can be understood as generalizations of linear decomposition methods used for dimensionality reduction, such as singular value decomposition and principal component analysis.
The scale-invariant feature transform (SIFT) is a computer vision algorithm to detect, describe, and match local features in images, invented by David Lowe in 1999. Applications include object recognition, robotic mapping and navigation, image stitching, 3D modeling, gesture recognition, video tracking, individual identification of wildlife and match moving.
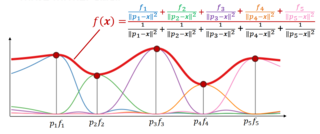
Inverse distance weighting (IDW) is a type of deterministic method for multivariate interpolation with a known scattered set of points. The assigned values to unknown points are calculated with a weighted average of the values available at the known points. This method can also be used to create spatial weights matrices in spatial autocorrelation analyses.

In computer science, a k-d tree is a space-partitioning data structure for organizing points in a k-dimensional space. K-dimensional is that which concerns exactly k orthogonal axes or a space of any number of dimensions. k-d trees are a useful data structure for several applications, such as:
In statistics, the k-nearest neighbors algorithm (k-NN) is a non-parametric supervised learning method first developed by Evelyn Fix and Joseph Hodges in 1951, and later expanded by Thomas Cover. It is used for classification and regression. In both cases, the input consists of the k closest training examples in a data set. The output depends on whether k-NN is used for classification or regression:

Marching tetrahedra is an algorithm in the field of computer graphics to render implicit surfaces. It clarifies a minor ambiguity problem of the marching cubes algorithm with some cube configurations. It was originally introduced in 1991.
A vantage-point tree is a metric tree that segregates data in a metric space by choosing a position in the space and partitioning the data points into two parts: those points that are nearer to the vantage point than a threshold, and those points that are not. By recursively applying this procedure to partition the data into smaller and smaller sets, a tree data structure is created where neighbors in the tree are likely to be neighbors in the space.
In computer graphics, marching squares is an algorithm that generates contours for a two-dimensional scalar field. A similar method can be used to contour 2D triangle meshes.
Nearest neighbor search (NNS), as a form of proximity search, is the optimization problem of finding the point in a given set that is closest to a given point. Closeness is typically expressed in terms of a dissimilarity function: the less similar the objects, the larger the function values.

The closest pair of points problem or closest pair problem is a problem of computational geometry: given points in metric space, find a pair of points with the smallest distance between them. The closest pair problem for points in the Euclidean plane was among the first geometric problems that were treated at the origins of the systematic study of the computational complexity of geometric algorithms.
In numerical analysis, multivariate interpolation is interpolation on functions of more than one variable ; when the variates are spatial coordinates, it is also known as spatial interpolation.
In computer science, the Bx tree is a query that is used to update efficient B+ tree-based index structures for moving objects.

The Point Cloud Library (PCL) is an open-source library of algorithms for point cloud processing tasks and 3D geometry processing, such as occur in three-dimensional computer vision. The library contains algorithms for filtering, feature estimation, surface reconstruction, 3D registration, model fitting, object recognition, and segmentation. Each module is implemented as a smaller library that can be compiled separately. PCL has its own data format for storing point clouds - PCD, but also allows datasets to be loaded and saved in many other formats. It is written in C++ and released under the BSD license.
In computer science, a ball tree, balltree or metric tree, is a space partitioning data structure for organizing points in a multi-dimensional space. A ball tree partitions data points into a nested set of balls. The resulting data structure has characteristics that make it useful for a number of applications, most notably nearest neighbor search.
In the theory of cluster analysis, the nearest-neighbor chain algorithm is an algorithm that can speed up several methods for agglomerative hierarchical clustering. These are methods that take a collection of points as input, and create a hierarchy of clusters of points by repeatedly merging pairs of smaller clusters to form larger clusters. The clustering methods that the nearest-neighbor chain algorithm can be used for include Ward's method, complete-linkage clustering, and single-linkage clustering; these all work by repeatedly merging the closest two clusters but use different definitions of the distance between clusters. The cluster distances for which the nearest-neighbor chain algorithm works are called reducible and are characterized by a simple inequality among certain cluster distances.
This page is based on this
Wikipedia article Text is available under the
CC BY-SA 4.0 license; additional terms may apply.
Images, videos and audio are available under their respective licenses.