Related Research Articles
IDL, short for Interactive Data Language, is a programming language used for data analysis. It is popular in particular areas of science, such as astronomy, atmospheric physics and medical imaging. IDL shares a common syntax with PV-Wave and originated from the same codebase, though the languages have subsequently diverged in detail. There are also free or costless implementations, such as GNU Data Language (GDL) and Fawlty Language (FL).
Solarsoft is a collaborative software development system created at Lockheed-Martin to support solar data analysis and spacecraft operation activities. It is widely recognized in the solar physics community as having revolutionized solar data analysis starting in the early 1990s. Solarsoft is in active development and use by research groups on all seven continents.
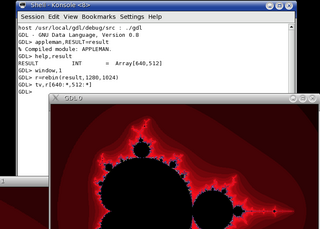
The GNU Data Language (GDL) is a free alternative to IDL, achieving full compatibility with IDL 7 and partial compatibility with IDL 8. Together with its library routines, GDL is developed to serve as a tool for data analysis and visualization in such disciplines as astronomy, geosciences, and medical imaging. GDL is licensed under the GPL. Other open-source numerical data analysis tools similar to GDL include Julia, Jupyter Notebook, GNU Octave, NCAR Command Language (NCL), Perl Data Language (PDL), R, Scilab, SciPy, and Yorick.

Multispectral imaging captures image data within specific wavelength ranges across the electromagnetic spectrum. The wavelengths may be separated by filters or detected with the use of instruments that are sensitive to particular wavelengths, including light from frequencies beyond the visible light range, i.e. infrared and ultra-violet. It can allow extraction of additional information the human eye fails to capture with its visible receptors for red, green and blue. It was originally developed for military target identification and reconnaissance. Early space-based imaging platforms incorporated multispectral imaging technology to map details of the Earth related to coastal boundaries, vegetation, and landforms. Multispectral imaging has also found use in document and painting analysis.
JMP is a suite of computer programs for statistical analysis developed by JMP, a subsidiary of SAS Institute. It was launched in 1989 to take advantage of the graphical user interface introduced by the Macintosh operating systems. It has since been significantly rewritten and made available also for the Windows operating system. JMP is used in applications such as Machine Learning, Six Sigma, quality control, design of experiments, as well as for research in science, engineering, biotechnologies, and social sciences.
Software visualization or software visualisation refers to the visualization of information of and related to software systems—either the architecture of its source code or metrics of their runtime behavior—and their development process by means of static, interactive or animated 2-D or 3-D visual representations of their structure, execution, behavior, and evolution.
Tracing in software engineering refers to the process of capturing and recording information about the execution of a software program. This information is typically used by programmers for debugging purposes, and additionally, depending on the type and detail of information contained in a trace log, by experienced system administrators or technical-support personnel and by software monitoring tools to diagnose common problems with software. Tracing is a cross-cutting concern.
GemIdent is an interactive image recognition program that identifies regions of interest in images and photographs. It is specifically designed for images with few colors, where the objects of interest look alike with small variation. For example, color image segmentation of:
Requirements traceability is a sub-discipline of requirements management within software development and systems engineering. Traceability as a general term is defined by the IEEE Systems and Software Engineering Vocabulary as (1) the degree to which a relationship can be established between two or more products of the development process, especially products having a predecessor-successor or primary-subordinate relationship to one another; (2) the identification and documentation of derivation paths (upward) and allocation or flowdown paths (downward) of work products in the work product hierarchy; (3) the degree to which each element in a software development product establishes its reason for existing; and (4) discernible association among two or more logical entities, such as requirements, system elements, verifications, or tasks.
Opticks is a remote sensing application that supports imagery, video, synthetic aperture radar (SAR), multi-spectral, hyper-spectral, and other types of remote sensing data. Opticks supports processing remote sensing video in the same manner as it supports imagery, which differentiates it from other remote sensing applications. Opticks was initially developed by Ball Aerospace & Technologies Corp. and other organizations for the United States Intelligence Community. Ball Aerospace open sourced Opticks hoping to increase the demand for remote sensing data and broaden the features available in existing remote sensing software. The Opticks software and its extensions are developed by over twenty different organizations, and over two hundred users are registered users at http://opticks.org. Future planned enhancements include adding the ability to ingest and visualize lidar data, as well as a three-dimensional (3-D) visualization capability.

RemoteView is the family name of a group of software programs designed by Textron Systems Geospatial Solutions to aid in analyzing satellite or aerial images of the Earth's surface for the purpose of collecting and disseminating geospatial intelligence. The National Geospatial-Intelligence Agency (NGA) was a user of RemoteView software.
SPICE is a NASA ancillary information system used to compute geometric information used in planning and analyzing science observations obtained from robotic spacecraft. It is also used in planning missions and conducting numerous engineering functions needed to carry out those missions.
TracePro is a commercial optical engineering software program for designing and analyzing optical and illumination systems. The program's graphical user interface (GUI) is 3D CAD-based creating a virtual prototyping environment to perform software simulation before manufacture.
NV5 Geospatial Solutions develops products for the visualization, analysis, and management of geospatial imagery and scientific data. The company develops products such as IDL, ENVI, Jagwire, and Helios which are used in a variety of industries including defense and intelligence, environmental, engineering, aerospace, medical imaging, federal and civil governments, precision agriculture and academia worldwide.
Biological data visualization is a branch of bioinformatics concerned with the application of computer graphics, scientific visualization, and information visualization to different areas of the life sciences. This includes visualization of sequences, genomes, alignments, phylogenies, macromolecular structures, systems biology, microscopy, and magnetic resonance imaging data. Software tools used for visualizing biological data range from simple, standalone programs to complex, integrated systems.

SPEDAS is an open-source data analysis tool intended for Space Physics users. It was developed using Interactive Data Language (IDL).

Carsen Stringer is an American computational neuroscientist and Group Leader at the Howard Hughes Medical Institute Janelia Research Campus. Stringer uses machine learning and deep neural networks to visualize large scale neural recordings and then probe the neural computations that give rise to visual processing in mice. Stringer has also developed several novel software packages that enable cell segmentation and robust analyses of neural recordings and mouse behavior.
References
- ↑ Title, A. M.; Tarbell, T. D.; Topka, K. P.; Ferguson, S. H.; Shine, R. A.; SOUP Team (January 1989). "Statistical properties of solar granulation derived from the SOUP instrument on Spacelab 2". The Astrophysical Journal. 336: 475. Bibcode:1989ApJ...336..475T. doi: 10.1086/167026 . eISSN 1538-4357. ISSN 0004-637X.
- ↑ Hurlbert, Neal E.; Shine, Richard A.; Tarbell, Theodore D. (9 April 1997), Grinstein, Georges G.; Erbacher, Robert F. (eds.), Interactive interface for visualizing and analyzing multispectral solar images, Visual Data Exploration and Analysis IV, vol. 3017, SPIE, pp. 165–173, Bibcode:1997SPIE.3017..165H, doi:10.1117/12.270325, ISSN 0277-786X, S2CID 61026169