AHP stands for analytic hierarchy process – a multi-criteria decision-making (MCDM) method. In AHP, values like price, weight, or area, or even subjective opinions such as feelings, preferences, or satisfaction, can be translated into measurable numeric relations. The core of AHP is the comparison of pairs instead of sorting (ranking), voting (e.g. assigning points) or the free assignment of priorities. Teachers and users of the AHP know that the best way to understand it is to work through an example. The example below shows how a broad range of considerations can be managed through the use of the analytic hierarchy process. The decision at hand requires a reasonably complex hierarchy to describe. It involves factors from the tangible and precisely measurable (purchase price, passenger capacity, cargo capacity), through the tangible but difficult to measure (maintenance costs, fuel costs, resale value) to the intangible and totally subjective (style). (https://bpmsg.com/ahp-introduction)
In the end, there is a clear decision whose development can be seen, traced, and understood by all concerned.
A practical example: choosing an automobile
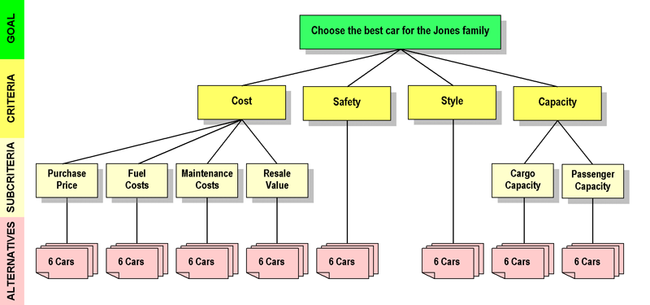
In an AHP hierarchy for a family buying a vehicle, the goal might be to choose the best car for the Jones family. The family might decide to consider cost, safety, style, and capacity as the criteria for making their decision. They might subdivide the cost criterion into purchase price, fuel costs, maintenance costs, and resale value. They might separate Capacity into cargo capacity and passenger capacity. The family, which for personal reasons always buys Hondas, might decide to consider as alternatives the Accord Sedan, Accord Hybrid Sedan, Pilot SUV, CR-V SUV, Element SUV, and Odyssey Minivan.
Constructing the hierarchy
The Jones' hierarchy could be diagrammed as shown below:
AHP hierarchy for the car buying decision. The goal is green, the criteria and subcriteria are yellow, and the alternatives are pink. All the alternatives (three different models of Honda) are shown below the lowest level of each criterion. Later in the process, each alternative (each model) will be rated with respect to the criterion or subcriterion directly above it.Alternatives for the car buying decision. To save space in the diagrams, we have represented them as stacks of papers.
As they build their hierarchy, the buyer should investigate the values or measurements of the different elements that make it up. If there are published safety ratings, for example, or manufacturer's specs for cargo capacity, they should be gathered as part of the process. This information will be needed later, when the criteria and alternatives are evaluated.
Note that the measurements for some criteria, such as purchase price, can be stated with absolute certainty. Others, such as resale value, must be estimated, so must be stated with somewhat less confidence. Still others, such as style, are really in the eye of the beholder and are hard to state quantitatively at all. The AHP can accommodate all these types of criteria, even when they are present in a single problem.
Also note that the structure of the vehicle-buying hierarchy might be different for other families (ones who don't limit themselves to Hondas, or who care nothing about style, or who drive less than 5,000 miles (8,000km) a year, etc.). It would definitely be different for a 25-year-old playboy who doesn't care how much his cars cost, knows he will never wreck one, and is intensely interested in speed, handling, and the numerous aspects of style.[1]
Pairwise comparing the criteria with respect to the goal
To incorporate their judgments about the various elements in the hierarchy, decision makers compare the elements two by two. How they are compared will be shown later on. Right now, let's see which items are compared. Our example will begin with the four criteria in the second row of the hierarchy, though we could begin elsewhere if we wanted to. The criteria will be compared as to how important they are to the decision makers, with respect to the goal.
Each pair of items in this row will be compared; there are a total of six pairs (cost/safety, cost/style, cost/capacity, safety/style, safety/capacity, and style/capacity). You can use the diagram below to see these pairs more clearly.
AHP hierarchy for the Jones family car buying decision. Can you see the six possible comparisons in the Criteria row?Alternatives for the Jones family car buying decision. These six models are pairwise compared with each of the covering criteria. First do them with respect to purchase price, then with respect to fuel costs, and so on until the end, with passenger capacity.
In the next row, there is a group of four subcriteria under the cost criterion, and a group of two subcriteria under the capacity criterion.
In the Cost subgroup, each pair of subcriteria will be compared regarding their importance with respect to the Cost criterion. (As always, their importance is judged by the decision makers.) Once again, there are six pairs to compare (Purchase Price/Fuel Costs, Purchase Price/Maintenance Costs, Purchase Price/Resale Value, Fuel Costs/Maintenance Costs, Fuel Costs/Resale Value, and Maintenance Costs/Resale Value).
In the Capacity subgroup, there is only one pair of subcriteria. They are compared as to how important they are with respect to the Capacity criterion.
Things change a bit when we get to the alternatives row. Here, the cars in each group of alternatives are compared pair-by-pair with respect to the covering criterion of the group, which is the node directly above them in the hierarchy. What we are doing here is evaluating the models under consideration with respect to Purchase Price, then with respect to fuel costs, then maintenance costs, resale value, safety, style, cargo capacity, and passenger capacity. Because there are six cars in the group of alternatives, there will be fifteen comparisons for each of the eight covering criteria.
When the pairwise comparisons are as numerous as those in our example, specialized AHP software can help in making them quickly and efficiently. We will assume that the Jones family has access to such software, and that it allows the opinions of various family members to be combined into an overall opinion for the group.
The family's first pairwise comparison is cost vs. safety. They need to decide which of these is more important in choosing the best car for them all. This can be a difficult decision. On the one hand, "You can't put a price on safety. Nothing is more important than the life of a family member." But on the other hand, the family has a limited amount of money to spend, no member has ever had a major accident, and Hondas are known as very safe cars. In spite of the difficulty in comparing money to potential injury or death, the Jones family needs to determine its judgment about cost vs. safety in the car they are about to buy. They have to say which criterion is more important to them in reaching their goal, and how much more important it is (to them) than the other one. In making this judgment, they should remember that since the AHP is a flexible process, they can change their judgment later on.
You can imagine that there might be heated family discussion about cost vs. safety. It is the nature of the AHP to promote focused discussions about difficult aspects of the decisions to which it is applied. Such discussions encourage the communication of differences, which in turn encourages cooperation, compromise, and agreement among the members of the group.
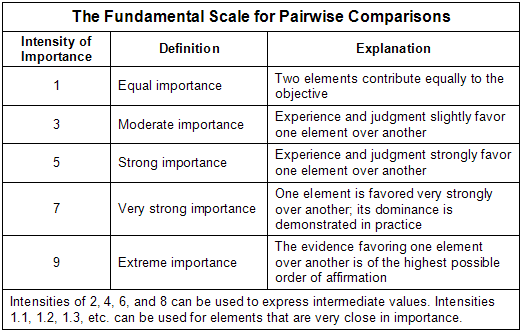
Let's say that the family decides that in this case, cost is moderately more important to them than safety. The software requires them to express this judgment by entering a number. They can use this table to determine it; in this case they would enter a 3 in favor of cost:
Continuing our example, let's say they make the following judgments about all the comparisons of criteria, entering them into the software as numbers gotten from the table: as stated, cost is moderately important (3) over safety; also, cost is very strongly important (7) over style, and is moderately important (3) over capacity. Safety is extremely more important (9) than style, and of equal importance (1) to capacity. Capacity is very strongly important (7) over style.
We could show those judgments in a table like this:
Judgments made by the Jones family and entered into the AHP software. Throughout this article, the family's judgments are shown with a green background. The orange and yellow colors show which alternative predominates.
The AHP software uses mathematical calculations to convert these judgments to priorities for each of the four criteria. The details of the calculations are beyond the scope of this article, but are readily available elsewhere.[2][3][4][5] The software also calculates a consistency ratio that expresses the internal consistency of the judgments that have been entered.
In this case the judgments showed acceptable consistency, and the software used the family's inputs to assign these new priorities to the criteria:
AHP hierarchy for the Jones family car buying decision. The Criteria have been pairwise compared, and their new priorities are shown. (Before the comparisons, each Criterion had a default priority of 0.250.) Note that the priorities still total 1.000, and the priorities for the subcriteria have not changed. The family has said that Cost is quite important to them, Style is relatively unimportant, and Safety and Capacity are each roughly half as important as Cost, with Safety having a slight edge over Capacity. Family members can look at these priorities and see how they feel about them. If they are uncomfortable about something, they can redo their pairwise comparisons.
You can duplicate this analysis at this online demonstration site; use the Line by Line Method by clicking its button, and don't forget to enter a negative number if the Criterion on the left is less important than the one on the right. If you are having trouble, click here for help. IMPORTANT: The demo site is designed for convenience, not accuracy. The priorities it returns may differ somewhat from those returned by rigorous AHP calculations. Nevertheless, it is useful in showing the mechanics of the pairwise comparison process. Once you are comfortable with the demo, you can experiment by entering your own judgments for the criteria in question. If your judgments are different from those of the Jones family, your priorities will possibly be quite different from theirs.[6]
Look again at the above diagram and note that the Subcriteria still show their default priorities. This is because the decision makers haven't entered any judgments about them. So next on the family's agenda is to pairwise compare the four Subcriteria under Cost, then the two Subcriteria under Capacity. They will compare them following the same pattern as they did for the Criteria.
We could imagine the result of their comparisons yielding the priorities shown here:[7]
AHP hierarchy for the Jones family car buying decision, showing LOCAL priorities. The items in each group of Subcriteria have been pairwise compared, and their resulting priorities are shown. The priorities in each group total 1.000. These are called local priorities.
At this point, all the comparisons for Criteria and Subcriteria have been made, and the AHP software has derived the local priorities for each group at each level. One more step can be made here. We know how much the priority of each Criterion contributes to the priority of the Goal. Since we also know how much the priority of each Subcriterion contributes to the priority of its parent, we (and the AHP software) can calculate the global priority of each Subcriterion. That will show us the priority of each Subcriterion with respect to the Goal. The global priorities throughout the hierarchy will add up to 1.000, like this:
AHP hierarchy for the Jones family car buying decision, showing GLOBAL priorities. The priority of the Goal is 1.000, as always. The global priorities shown in red for the Criteria and Subcriteria also add up to 1.000. Each item with a red global priority contributes that amount to the priority of the Goal.
Based on the judgments entered by the family, the AHP has derived the priorities for the factors against which each of the six cars will be compared. They are shown, from highest to lowest, in the table below. Notice that Cost and Capacity will not be evaluated directly, but that each of their Subcriteria will be evaluated on its own:
Factor
Priority
Purchase Price
0.246
Safety
0.237
Passenger Capacity
0.181
Fuel Costs
0.127
Resale Value
0.081
Maintenance Costs
0.050
Style
0.042
Cargo Capacity
0.036
The next step is to evaluate each of the cars with respect to these factors. In the technical language of AHP, we will pairwise compare the alternatives with respect to their covering criteria.
Pairwise comparing the Alternatives with respect to the Criteria
The family can evaluate alternatives against their covering criteria in any order they choose. In this case, they choose the order of decreasing priority of the covering criteria. That means Purchase Price first.
Purchase price
The family has established a budget of $25,000 for buying the new car, but they are willing to consider alternatives whose price exceeds their budget. To refresh your mind, here are the six cars they are considering—in AHP terminology, the six alternatives—along with their purchase prices:
The Jones Family's alternatives, with purchase prices.
Knowing that they will have a lot of pairwise comparisons to make, the family prepared this worksheet to help them. It shows comparative information about the price and budget status of each pair of cars:
The Jones family's purchase price worksheet.
Now, what do they do?
First they might compare the purchase price of the Accord Sedan to that of the Accord Hybrid. If they stick purely to arithmetic, they could say that the Sedan is favored by 1.5, since the Hybrid's price is about 1.5 times that of the Sedan, and a lower price is better. They could follow that pattern through all 15 of the comparisons, and it would give a mathematically consistent set of comparisons.
But merely entering the numbers wouldn't take into account things like the $25,000 budget, or the value to the family of saving, say, $5,000 vs. $1,000 on a purchase. Things like that can be highly important in making decisions, and their importance can vary greatly with the situation and the people involved. Some families might never want to exceed their budget. Others might be willing to exceed it by a few dollars or a few per cent, but very unwilling to go further. Still others might not care much if they spend double their budget on the car. Because the AHP allows decision-makers to enter their judgments about the data, rather than just the data themselves, it can deal with all these situations and more.
Let's say that the Jones family is willing to exceed their budget by up to $1,000, but anything more is unacceptable. They "never say never," however—budget-busting cars will score as low as possible on the purchase price, but won't be removed from the list of alternatives. And for cars priced under budget, a $1,000 difference in price doesn't matter much to the Joneses, but a $5,000 difference is strongly important, and a $10,000 difference is extreme. They might enter the following intensities into the AHP software (throughout this example, the judgments of decision-makers are shaded in green):
Purchase price judgments entered by the Jones family, with the rationale for their choices. From the Fundamental Scale, 1 expresses that A and B are equally preferred, 3 that A is moderately preferred to B, 5 that A is strongly preferred, 7 that A is very strongly preferred, and 9 that A is extremely preferred to B. Intensities 2, 4, 6, and 8 express intermediate values.
You can follow the family's thinking by looking at the rationale for each judgment. Whenever a car that is under budget is compared with one that is over budget by more than $1,000, the former is extremely preferred. For cars under budget, a $1,000 less expensive car is slightly preferred, a $5,000 one is strongly preferred, and a $6,000 one is even more strongly preferred. When both cars are well over budget (comparison #6), they are equally preferred, which is to say they are equally undesirable. Because budget status and absolute price difference are enough to make each comparison, the ratio of prices never enters into the judgments.
When the judgments shown above are entered, the AHP software returns the following priorities for the six alternatives with respect to Purchase Price:
Alternative
Local
Priority
Global
Priority
Element
0.362
0.089
Accord
0.242
0.060
CR-V
0.242
0.060
Odyssey
0.100
0.025
Pilot
0.027
0.007
Accord Hybrid
0.027
0.007
TOTAL
1.000
0.246
The local priorities show how much the purchase price of each model contributes to the subcriterion of Purchase Price. The global priorities show how much the purchase price of each model contributes to the overall goal of choosing the best car for the Jones family.
Safety
Comparing the alternatives on the basis of Safety is much less objective than comparing them on Purchase Price. Purchase prices are measured in dollars and can be determined to the penny. People can easily agree on the meaning of a $20,360 purchase price, and can rationally compare it to all the other prices, using methods and calculations that are understood and accepted by all.
But "safety" eludes our efforts even to define it in an objective way. Not only that, but the objective measurements of safety are limited and not readily comparable from car to car.
The government conducts objective crash tests, but they are incomplete measures of the "safety" of a given car. Also, the crash tests only compare the members of a single class of cars, such as Midsize Cars or Minivans. Is a midsize car with 100% 5-star safety ratings equally as safe as a minivan with the same ratings? It's not exactly clear. And when evaluating minivans that have 5-star ratings in all categories but one, who can say if the one with four stars for "Frontal Impact, Driver's Side" is safer than the one whose four stars are in "Side Impact, Rear Occupant?" There's really no way to tell.
In spite of these difficulties, the AHP provides a rational way to evaluate the relative safety of different cars.
Let's assume that the Jones family has researched the Safety of the six Hondas they are considering. They will have found that all of them are among the safest cars on the road. All six are "Top Safety Picks" of the IIHS safety standards organization. All of them do very well in the crash testing programs of the National Highway Traffic Safety Administration. But there are differences between them, and the family wants to factor the differences into their decision. "Your car can never be too safe."
The worksheet below includes the data that the family has decided to evaluate. They believe that a heavier car is a safer car, so they've documented the curb weights of their alternatives. They have investigated the results of government crash tests, and they've summarized the results on the worksheet:
Safety data to be evaluated by the Jones family. Curb Weight is from manufacturer's literature. Crash Ratings are from NHTSA and are given for various classes of vehicle. For each class, they include Frontal Impact, Driver's Side; Frontal Impact, Passenger's Side; Side Impact, Front Occupant; Side Impact, Rear Occupant; and Rollover Rating. Ratings are from one to five stars, with five stars being the best.
The family will consider everything in the worksheet as they compare their alternatives. They are not safety experts, but they can apply their life experience to making decisions about the safety ratings. They all feel safer when driving a car that is significantly heavier than another one. One family member has seen two gruesome rollover accidents, and is terrified of a vehicle rolling over with her inside. She insists that the family car has the highest possible Rollover Rating.
Here are the weights that the Jones family enters for the alternatives regarding Safety (throughout this example, orange shading is used for judgments where A is favored; yellow shading is used for B):
Safety judgments entered by the Jones family, with the intensity and rationale for each. From the Fundamental Scale, 1 expresses that A and B are equally preferred, 3 that the better of the pair is moderately preferred to the worse, 5 that the better is strongly preferred, 7 that the better is very strongly preferred, and 9 that the better is extremely preferred to the worse. Intensities 2, 4, 6, and 8 express intermediate values.
When the judgments shown above are entered, the AHP software returns the following priorities for the six alternatives with respect to Safety:
Alternative
Local
Priority
Global
Priority
Odyssey
0.424
0.100
Accord
0.215
0.051
Accord Hybrid
0.215
0.051
Pilot
0.083
0.020
CR-V
0.038
0.009
Element
0.025
0.006
TOTAL
1.000
0.237
The local priorities show how much the safety of each model contributes to the Criterion of Safety. The global priorities show how much the Safety of each model contributes to the overall goal of choosing the best car for the Jones family.
Passenger capacity
This characteristic is easy to evaluate. The alternatives can carry either four or five or eight passengers. Here are the figures:
Passenger Capacity of the Jones family's alternatives.
The family has decided that four is barely enough, five is perfect for their needs, and eight is just a little bit better than five. Here are their judgments:
Passenger Capacity judgments entered by the Jones family. The rationale is that four passengers is barely enough, five is perfect for their needs, and eight is just a little bit better than five.
When the judgments shown above are entered, the AHP software returns the following priorities for the six alternatives with respect to Passenger Capacity:
Alternative
Local
Priority
Global
Priority
Pilot
0.273
0.049
Odyssey
0.273
0.049
Accord
0.136
0.025
Accord Hybrid
0.136
0.025
CR-V
0.136
0.025
Element
0.046
0.008
TOTAL
1.000
0.181
The local priorities show how much the passenger capacity of each model contributes to the Subcriterion of Passenger Capacity. The global priorities show how much the passenger capacity of each model contributes to the overall goal of choosing the best car for the Jones family.
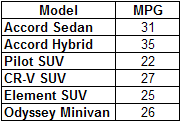
Fuel costs
After careful consideration, the Jones family believes that no matter which car they buy, they will drive it the same number of miles per year. In other words, there is nothing about any of the alternatives, including the price of fuel or the car's fuel consumption per mile, that would cause it to be driven more or fewer miles than any other alternative. They also believe that the government MPG rating is an accurate basis on which to compare the fuel consumption of the cars. Here is a worksheet showing the government MPG ratings of the Jones family alternatives:
Fuel consumption figures for the Jones family's alternatives.
They believe, therefore, that the fuel cost of any alternative vs. any other depends exclusively on the MPG ratings of the two cars. So the pairwise judgments they enter for any two cars will be inversely proportional to their MPG ratings. In other words, if car A has exactly twice the MPG rating of car B, the Fuel Cost for car B will be exactly twice that of car A. This table shows the judgments they will enter for all the comparisons:
Fuel Cost judgments entered by the Jones family. Judgments are inversely proportional to the MPG ratings of the cars being compared.
When the judgments shown above are entered, the AHP software returns the following priorities for the six alternatives with respect to Fuel Cost:
Alternative
Local
Priority
Global
Priority
Accord Hybrid
0.212
0.027
Accord
0.188
0.024
CR-V
0.160
0.020
Odyssey
0.156
0.020
Element
0.151
0.019
Pilot
0.133
0.017
TOTAL
1.000
0.127
The local priorities show how much the fuel cost of each model contributes to the subcriterion of Fuel Costs. The global priorities show how much the fuel cost of each model contributes to the overall goal of choosing the best car for the Jones family.
Resale value
When the family researched Resale Value, they learned that lending institutions keep statistics on the market value of different models after various time periods. These estimated "residual values" are used for leasing, and are typically based on a limit of 12,000 miles (19,000km) driven per year. Actual residual values depend on the condition of the car, and can vary with market conditions.
The Joneses are going to buy their car, not lease it, and they expect to drive it more than 12,000 miles per year, but they agree among themselves that the leasing figures are a good basis on which to compare the alternatives under consideration. Their bank gave them this table showing the residual value of each alternative after four years and 48,000 miles (77,000km):
Four-year residual values. A value of 0.52 means that this model is worth 52% of its original price.
Model
Residual Value
Accord Sedan
0.52
Accord Hybrid
0.46
Pilot SUV
0.44
CR-V SUV
0.55
Element SUV
0.48
Odyssey Minivan
0.48
As they look at the table of residual values, they see that the residual value of a CR-V is 25% higher than that of a Pilot (0.55 is 125% of 0.44). They reason that such a greatly higher residual value is an indication of a better or more desirable car, so they want to place a premium on cars with relatively high residual value. After some thought and discussion, they decide that, when comparing residual values, they want to look at the higher one as a percentage of the lower, and assign their intensities on that basis. Where one model has a residual value that is less than 105% of another, they consider the residual values as equal for all practical purposes. Where one model has a residual value that is 125% of the residual value of another, they consider the former model as quite strongly more important, desirable, valuable, etc., as indicated by its much higher resale value. With a bit more thought and discussion, they decide to make their judgments on this basis:
The Jones rationale for comparing residual values. It is based on the higher residual value as a percentage of the lower one.
They realize that not every family would do it this way, but this way seems best for them. This table shows the judgments they will enter for their Resale Value comparisons:
Resale Value comparisons entered by the Jones family. They are based on the rationale shown above.
When the judgments shown above are entered, the AHP software returns the following priorities for the six alternatives with respect to Resale Value:
Alternative
Local Priority
Global Priority
CR-V
0.415
0.034
Accord
0.225
0.018
Element
0.105
0.009
Odyssey
0.105
0.009
Accord Hybrid
0.095
0.008
Pilot
0.055
0.004
Total
1.000
0.081
The local priorities show how much the resale value of each model contributes to the Subcriterion of Resale Value. The global priorities show how much the resale value of each model contributes to the overall goal of choosing the best car for the Jones family.
Maintenance costs
The Jones family researched maintenance costs for the cars under consideration, but they didn't find any hard figures. The closest they got was Consumer Reports magazine, which publishes 17 separate maintenance ratings for every car on the market. Their Hondas ranked very well, with all ratings "Much Better Than Average," except for a few on the Pilot and Odyssey. The Pilot got "Better Than Average" for its audio system and the user rating, and "Average" for body integrity. The Odyssey got "Better Than Average" for body hardware and power equipment, and "Average" for brakes, body integrity, and user rating.
The Joneses also asked their favorite mechanic to evaluate the maintenance costs for their six cars. Using tire prices and mileage estimates, he came up with figures for tire costs over 60,000 miles (97,000km) of driving. He didn't have figures for brake costs, but he said they'd be about twice as much for the SUVs and minivans as they would for the sedans. He also cautioned them that the battery in the Accord Hybrid was an expensive repair item, and that the engine placement on the Odyssey made it a more expensive car to work on.
The family created this worksheet to keep track of all their information about maintenance costs:
Jones family worksheet for Maintenance Costs. Plus signs indicate good maintenance history; the more plus signs, the lower the maintenance costs.
Even though every column on the worksheet contains a different type of information, the Joneses can use it to make reasonable, rational judgments about Maintenance Costs. Here are the judgments they will enter:
Maintenance Cost judgments entered by the Jones family. From the Fundamental Scale, 1 means that A and B are equally preferred, 3 that A is moderately preferred, and 5 that A is strongly preferred. Intermediate numbers express intermediate preferences.
When the judgments shown above are entered, the AHP software returns the following priorities for the six alternatives with respect to Maintenance Costs:
Alternative
Local
Priority
Global
Priority
Accord
0.357
0.018
Accord Hybrid
0.312
0.016
CR-V
0.100
0.005
Element
0.089
0.004
Pilot
0.084
0.004
Odyssey
0.058
0.003
TOTAL
1.000
0.050
The local priorities show how much the projected maintenance cost of each model contributes to the subcriterion of Maintenance Costs. The global priorities show how much the maintenance cost of each model contributes to the overall goal of choosing the best car for the Jones family.
Style
The family decided that Style is important to them, but how can they determine the "style" of each of the six alternatives? "Style" is a pretty subjective concept—it can truly be said that "style is in the eye of the beholder." Yet through the method of pairwise comparison, the AHP gives the Jones family a way to evaluate the "style" of the cars they are considering.
Honda's web site provides photos of each of the alternatives. It also has videos, commercials, rotatable 360° views, color chips, and more, all available to help family members evaluate the Style of each car. The family can compare their alternatives two-by-two on Style, using the tools on the web site to help them make their judgments. They did just that, and here is the record of their judgments:
Style judgments entered by the Jones family. The family looked at each pair of cars as shown in detail on a web site, decided which of the two they preferred, then entered the intensity of their preference according to the Fundamental Scale.
When the judgments shown above are entered, the AHP software returns the following local priorities for the six alternatives with respect to Style:
Alternative
Local
Priority
Global
Priority
Accord
0.346
0.015
Accord Hybrid
0.346
0.015
CR-V
0.160
0.007
Odyssey
0.078
0.003
Pilot
0.045
0.002
Element
0.025
0.001
TOTAL
1.000
0.042
The local priorities show how much the style of each model contributes to the Style Criterion. The global priorities show how much the Style of each model contributes to the overall goal of choosing the best car for the Jones family.
Cargo capacity
The Cargo Capacity of each alternative, measured in cubic feet, is listed in the manufacturer's specifications for each vehicle. The Joneses don't really know how it is calculated, but they trust that it's a good indication of how much cargo can be packed into a vehicle. This worksheet shows the cargo capacities of the Jones' alternatives:
Cargo Capacity of the Jones' alternatives.
Cargo capacities for the alternatives vary from 14 to 148 cubic feet (4.2m3). If they wanted to, the Jones family could enter these capacities directly into the AHP software. But that would mean that, when considering Cargo Capacity, a car with 148cuft (4.2m3). of it would be over ten times as desirable as one with only 14. Given the car's use as a family vehicle, that doesn't seem quite right. So the family looks at the available capacities and determines that a 14cuft (0.40m3). trunk is perfectly fine for their needs, that something about five times larger is slightly better, and that something about ten times larger is moderately so. These judgments correspond to values of 1, 2, and 3 on the AHP's Fundamental Scale.
Here are the judgments they would enter into the AHP software:
Cargo Capacity judgments entered by the Jones family. The rationale is that 14 cubic feet (0.40m) is totally satisfactory, five times that much (70 cu. ft.) is slightly better, and ten times that much (140 cu. ft.) is moderately better than 14.
When the judgments shown above are entered, the AHP software returns the following local priorities for the six alternatives with respect to Cargo Capacity:
Alternative
Local
Priority
Global
Priority
Odyssey
0.310
0.011
Pilot
0.170
0.006
CR-V
0.170
0.006
Element
0.170
0.006
Accord
0.090
0.003
Accord Hybrid
0.090
0.003
TOTAL
1.000
0.036
The local priorities show how much the cargo capacity of each model contributes to the subcriterion of Cargo Capacity. The global priorities show how much the cargo capacity of each model contributes to the overall goal of choosing the best car for the Jones family.
Making the decision
In the end, the AHP software arranges and totals the global priorities for each of the alternatives. Their grand total is 1.000, which is identical to the priority of the goal. Each alternative has a global priority corresponding to its "fit" to all the family's judgments about all those aspects of Cost, Safety, Style and Capacity. Here is a summary of the global priorities of the alternatives:
Global priorities for the Jones family car buying decision. Note that the priorities for each group of children total that of their parent.
The Odyssey Minivan, with a global priority of 0.220, is the alternative that contributes the most to the goal of choosing the best car for the Jones family. The Accord Sedan is a close second, with a priority of 0.213. The other models have considerably less priority than those two. In descending order, they are CR-V SUV, Accord Hybrid, Element SUV, and Pilot SUV.
The Analytic Hierarchy Process has shown the Joneses that the Odyssey Minivan best satisfies all their criteria and judgments, followed closely by the Accord Sedan. The other alternatives fall significantly short of meeting their criteria. The family's next step is up to them. They might just go out and buy an Odyssey, or they might use the AHP or other means to refine their decision between the Odyssey and the Accord Sedan.
↑Meixner, Oliver; Reiner Haas (2002). Computergestützte Entscheidungs-findung: Expert Choice und AHP – innovative Werkzeuge zur Lösung komplexer Probleme (in German). Frankfurt/Wien: Redline Wirtschaft bei Ueberreuter. ISBN3-8323-0909-8.
↑Note that the demo site expresses priorities in percentages rather than decimal fractions as we do. It also uses different numbers to represent the verbal descriptions presented here. It's only a demo, but you should use our numbers, not theirs, and you should convert the percentages to decimal fractions. IMPORTANT: The demo site is designed for convenience, not accuracy. The priorities it returns may be significantly different from those returned by rigorous AHP calculations.
↑Their comparisons under Cost were Purchase Price 2 over Fuel Cost, 5 over Maintenance Cost, and 3 over Resale Value; Fuel Cost 2 over Maintenance Cost and 2 over Resale Value; Maintenance Cost -2 vs. Resale Value. Their comparisons under Capacity were Cargo Capacity -5 vs. Passenger Capacity.
External links
R ahp package – The R open source ahp package provides an implementation of this example.
AHPy – AHPy provides a worked example of this problem in its README
AHP with Microsoft Excel – A worked example for choosing a smartphone using a Microsoft Excel workbook
This page is based on this Wikipedia article Text is available under the CC BY-SA 4.0 license; additional terms may apply. Images, videos and audio are available under their respective licenses.