The Barron's 400 Index or B400 is a stock market index of 400 public companies in the United States, as selected by editors and associates of Barron's magazine. Established in 2007, the Barron's 400 has tended to outperform certain other major indexes at least through the first half of 2013.[1]
The index is equal-weighted, aiming to hold each of 400 companies in equal proportion of about a quarter percent of the overall index. The index selects companies based on fundamental analysis criteria such as Return on investment, growth, market value, profits and cash flow. The Barron's 400 employs a consistent “growth-at-a-reasonable price” (GARP) selection strategy.
The index differs from other major indexes in that it is equal-weighted, unlike the Dow Jones US Total Stock Market Index, the NASDAQ Composite and the Standard & Poor's 500 (S&P 500), which are capitalization-weighted. In that respect it also differs from the Dow Jones Industrial Average, which is calculated as the average of the share prices of the underlying components.
The Barron's 400 (also known as the B400) is compiled, maintained and updated by MarketGrader.com Corp. MarketGrader developed the Barron's 400 in consultation with editors at Barron's, a financial news magazine.[2][3] The two companies continue to maintain an ongoing partnership for the index. The index is calculated by NYSE/Euronext.[4]
History
The B400 was first calculated on June 25, 2007. Its estimated back-tested history availability dates to December 31, 1997, which is also the index's base value date.[5] The index was first published in Barron's on September 3, 2007, and was the subject of the magazine's cover story on that date.[6]
The B400 hit an all-time closing high of 451.40 on July 22, 2013 during an extended broader bull market that commenced in March, 2009.[7]
The B400's peak annual return through 2012, excluding its back-tested history, came in 2009, when the index gained 39.1%. The B400's worst annual performance through 2012 came in 2008, when it sank 40.0% during a general broad market meltdown provoked by the collapse of the U.S. real estate market that spread to the wider economy.
As of July 5, 2013, the B400 had a cumulative 10-year price-only return (excluding dividends) of 153.0%, compared to a Dow Jones Industrial Average (DJIA) cumulative return of 62.6%, an S&P 500 return of 60.8%, a NASDAQ return of 100.1% and the Dow Jones Total Stock Market (DJUSTSM) return of 75.2%.for the same time period.
As of July 5, 2013, the B400 had a 10-year annualized return of 9.9%, compared to a DJIA annualized return of 5.2%, an S&P500 return of 5.1%, a NASDAQ return of 7.5% and a DJUSTSM return of 6.0% for the same time period.
An updated chart of the B400 has appeared in The Trader section of Barron's magazine since the index's inception.
Selection
The components of the Barron's 400, a rules-based index, are selected primarily based on proprietary analytics supplied by MarketGrader that evaluate stocks based on their growth, value, profitability and cash flow.[8]
Stocks under evaluation are assigned a grade based on those four fundamentals.[9][bettersourceneeded] MarketGrader employs a stock-selection process that employs 24 variables to judge the health of a company and the valuation of its shares.[10] It also analyzes a company according to its growth trajectory, whether its stock is cheap or expensive relative to the company's underlying fundamentals, its profit margins, leverage, return on shareholder equity, and the way it grows and manages the cash it generates from operations. The selection process also measure a stock's reaction to the latest earnings reports and the degree to which it may be overlooked by analysts.
REITS, although covered by MarketGrader, are excluded from B400. Also excluded companies that have not reported quarterly or annual results within the past six months. Each stock selected for the B400 must have a minimum three-month average daily dollar-trading volume of $2 million. The minimum float-adjusted capitalization of a component is $250 million, and at least 25% of the components must have a market value of at least $3 billion.
All components must be U.S. companies publicly listed on either the New York Stock Exchange or NASDAQ. The components are drawn from the MarketGrader universe of about 6,000 North American stocks. Turnover in the components tends to be high. The median historical turnover pace is 43.5%. The average “holding period” for a component in the B400 is less than two years.
Equal weighting
All 400 components of the B400 are equally weighted in the index at each semi-annual rebalance. The result prevents a small minority of huge companies from steering the index, while giving smaller issues equal opportunity to contribute to the B400's overall performance. By definition, each stock represents one quarter of one percent of the overall index.
Components
The Barron's 400 Index is updated semi-annually, in March and September. As of March, 2013, only 16 companies had been in the index for at least five years.[11]
The B400 index value is updated every 15 seconds during trading sessions and is disseminated by NYSE Euronext.
Every six months, on the third Friday of March and September, the B400 component stocks are updated to incorporate recent financial results and market action, and to revise the index – some stocks are removed and some are added at those times.
The Barron's 400 Index is managed by MarketGrader, led by Founder Carlos Diez, who founded the stock research firm in 1999. MarketGrader rates 39,000 equities across 92 countries and 1,500 U.S. listed equity ETFs. MarketGrader also created and publishes a family of equally weighted indexes in addition to the Barron's 400 Index. In May, 2013, MarketGrader named former Dow Jones Indexes executive John Prestbo as a senior adviser for the growth and development of the B400.[14][15]
Related investment product
The Barron's 400 Index is the basis for the Barron's 400 ETF (NYSE Arca: BFOR), an exchange-traded fund (ETF) launched June 4, 2013 under the ALPS ETF Trust.[16][17] The ETF tracks the index and seeks results corresponding to the underlying B400 index of 400 stocks. ALPS, headquartered in Denver CO, provides asset servicing and gathering to the financial services industry.[18][19]
NYSE American, formerly known as the American Stock Exchange (AMEX), and more recently as NYSE MKT, is an American stock exchange situated in New York City. AMEX was previously a mutual organization, owned by its members. Until 1953, it was known as the New York Curb Exchange.
The New York Stock Exchange is an American stock exchange in the Financial District of Lower Manhattan in New York City. It is the largest stock exchange in the world by market capitalization.
The Dow Jones Industrial Average (DJIA), Dow Jones, or simply the Dow, is a stock market index of 30 prominent companies listed on stock exchanges in the United States.
A stock market crash is a sudden dramatic decline of stock prices across a major cross-section of a stock market, resulting in a significant loss of paper wealth. Crashes are driven by panic selling and underlying economic factors. They often follow speculation and economic bubbles.
In 2001, stock prices took a sharp downturn in stock markets across the United States, Canada, Asia, and Europe. After recovering from lows reached following the September 11 attacks, indices slid steadily starting in March 2002, with dramatic declines in July and September leading to lows last reached in 1997 and 1998. The U.S. dollar increased in value relative to the euro, reaching a 1-to-1 valuation not seen since the euro's introduction.
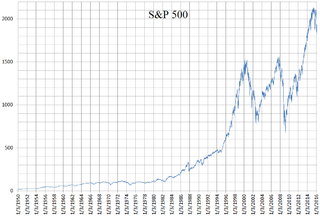
The Standard and Poor's 500, or simply the S&P 500, is a stock market index tracking the stock performance of 500 of the largest companies listed on stock exchanges in the United States. It is one of the most commonly followed equity indices and includes approximately 80% of the total market capitalization of U.S. public companies, with an aggregate market cap of more than $43 trillion as of January 2024.
The Nasdaq-100 (^NDX) is a stock market index made up of equity securities issued by 100 of the largest non-financial companies listed on the Nasdaq stock exchange. It is a modified capitalization-weighted index. The stocks' weights in the index are based on their market capitalizations, with certain rules capping the influence of the largest components. It is limited to companies from a single exchange, and it does not have any financial companies. The financial companies are in a separate index, the Nasdaq Financial-100.
An exchange-traded fund (ETF) is a type of investment fund that is also an exchange-traded product, i.e., it is traded on stock exchanges. ETFs own financial assets such as stocks, bonds, currencies, debts, futures contracts, and/or commodities such as gold bars. Many ETFs provide some level of diversification compared to owning an individual stock.
The Dow Jones Transportation Average is a U.S. stock market index from S&P Dow Jones Indices of the transportation sector, and is the most widely recognized gauge of the American transportation sector. It is the oldest stock index still in use, even older than its better-known relative, the Dow Jones Industrial Average (DJIA).
The Russell 1000 Index is a U.S. stock market index that tracks the highest-ranking 1,000 stocks in the Russell 3000 Index, which represent about 93% of the total market capitalization of that index.
The Russell Midcap Index is a stock market index that measures performance of the 800 smallest companies in the Russell 1000 Index.
A capitalization-weightedindex, also called a market-value-weighted index is a stock market index whose components are weighted according to the total market value of their outstanding shares. Every day an individual stock's price changes and thereby changes a stock index's value. The impact that individual stock's price change has on the index is proportional to the company's overall market value, in a capitalization-weighted index. In other types of indices, different ratios are used.
The Nasdaq Composite is a stock market index that includes almost all stocks listed on the Nasdaq stock exchange. Along with the Dow Jones Industrial Average and S&P 500, it is one of the three most-followed stock market indices in the United States. The composition of the NASDAQ Composite is heavily weighted towards companies in the information technology sector. The Nasdaq-100, which includes 100 of the largest non-financial companies in the Nasdaq Composite, accounts for about 80% of the index weighting of the Nasdaq Composite.
An inverse exchange-traded fund is an exchange-traded fund (ETF), traded on a public stock market, which is designed to perform as the inverse of whatever index or benchmark it is designed to track. These funds work by using short selling, trading derivatives such as futures contracts, and other leveraged investment techniques.
The S&P MidCap 400 Index, more commonly known as the S&P 400, is a stock market index from S&P Dow Jones Indices.
The S&P SmallCap 600 Index is a stock market index established by S&P Global Ratings. It covers roughly the small-cap range of American stocks, using a capitalization-weighted index.
The NYSE Arca Major Market Index, previously the AMEX Major Market Index, is the American price-weighted stock market index made up of 20 Blue Chip industrial stocks of major U.S. corporations. Several of the stocks are also components of the Dow Jones Industrial Average (DJIA).
In finance, a stock index, or stock market index, is an index that measures the performance of a stock market, or of a subset of a stock market. It helps investors compare current stock price levels with past prices to calculate market performance.
This page is based on this Wikipedia article Text is available under the CC BY-SA 4.0 license; additional terms may apply. Images, videos and audio are available under their respective licenses.