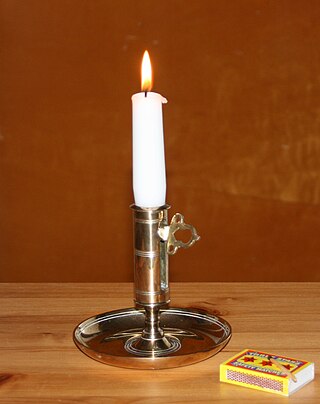
A candle is an ignitable wick embedded in wax, or another flammable solid substance such as tallow, that provides light, and in some cases, a fragrance. A candle can also provide heat or a method of keeping time.
Wick most often refers to:
A candle is a source of light, typically made of wax.

A candlestick chart is a style of financial chart used to describe price movements of a security, derivative, or currency.

Dikirion and trikirion are liturgical candlesticks, used by a bishop of the Eastern Orthodox and the Eastern Catholic Churches to bless the clergy and faithful. The words mean "dual candle" and "triple candle", respectively, and may collectively be called by the Greek plural form, "δικηροτρίκηρα", dikērotríkēra.

A sconce is a lamp-holder – either a candlestick or lantern with a handle, or a lamp fixed to a wall. In the latter case the light is usually, but not always, directed upwards and outwards, rather than down. The sconce is a very old form of fixture, historically used with candles and oil lamps.

Altar candles are candles set on or near altars for religious ceremonies. Various religions have regulations or traditions regarding the number and type of candles used, and when they are lit or extinguished, for example during the liturgies.
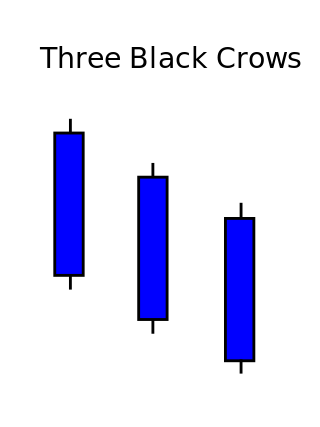
Three crows is a term used by stock market analysts to describe a market downturn. It appears on a candlestick chart in the financial markets. It unfolds across three trading sessions, and consists of three long candlesticks that trend downward like a staircase. Each candle should open below the previous day's open, ideally in the middle price range of that previous day. Each candlestick should also close progressively downward to establish a new near-term low. The pattern indicates a strong price reversal from a bull market to a bear market.
Candle holder or candleholder may refer to:
The doji is a commonly found pattern in a candlestick chart of financially traded assets in technical analysis. It is characterized by being small in length—meaning a small trading range—with an opening and closing price that are virtually equal. The efficacy of technical analysis is disputed by the efficient-market hypothesis, which states that stock market prices are essentially unpredictable.
Spinning top is a Japanese candlesticks pattern with a short body found in the middle of two long wicks. A spinning top is indicative of a situation where neither the buyers nor the sellers have won for that time period, as the market has closed relatively unchanged from where it opened; the market is indecisive regarding its trend. The upper and lower long wicks, however, tell us that both the buyers and the sellers had the upper hand at some point during the time period the candle represents. When a spinning top forms after a run up or run down in the market, it can be an indication of a pending reversal, as the indecision in the market is representative of the buyers losing momentum when this occurs after an uptrend and the sellers losing momentum after a downtrend.

A hammer is a type of bullish reversal candlestick pattern, made up of just one candle, found in price charts of financial assets. The candle looks like a hammer, as it has a long lower wick and a short body at the top of the candlestick with little or no upper wick. In order for a candle to be a valid hammer, most traders say the lower wick must be two times greater than the size of the body portion of the candle, and the body of the candle must be at the upper end of the trading range.

The Morning Star is a pattern seen in a candlestick chart, a popular type of a chart used by technical analysts to anticipate or predict price action of a security, derivative, or currency over a short period of time.
Marubozu is the name of a Japanese candlesticks formation used in technical analysis to indicate a stock has traded strongly in one direction throughout the session and closed at its high or low price of the day. A marubozu candle is represented only by a body; it has no wicks or shadows extending from the top or bottom of the candle. A white marubozu candle has a long white body and is formed when the open equals the low and the close equals the high.
Paschal is a surname and given name.
In financial technical analysis, a candlestick pattern is a movement in prices shown graphically on a candlestick chart that some believe can predict a particular market movement. The recognition of the pattern is subjective and programs that are used for charting have to rely on predefined rules to match the pattern. There are 42 recognized patterns that can be split into simple and complex patterns.

A hanging man is a type of candlestick pattern in financial technical analysis. It is a bearish reversal pattern made up of just one candle. It has a long lower wick and a short body at the top of the candlestick with little or no upper wick. In order for a candle to be a valid hanging man most traders say the lower wick must be two times greater than the size of the body portion of the candle, and the body of the candle must be at the upper end of the trading range.
Heikin-Ashi is a Japanese trading indicator and financial chart that means "average pace". Heikin-Ashi charts resemble candlestick charts, but have a smoother appearance as they track a range of price movements, rather than tracking every price movement as with candlesticks. Heikin-Ashi was created in the 1700s by Munehisa Homma, who also created the candlestick chart. These charts are used by traders and investors to help determine and predict price movements.
Triple candlestick may refer to:
This page is based on this
Wikipedia article Text is available under the
CC BY-SA 4.0 license; additional terms may apply.
Images, videos and audio are available under their respective licenses.