
C is a general-purpose, procedural computer programming language supporting structured programming, lexical variable scope, and recursion, with a static type system. By design, C provides constructs that map efficiently to typical machine instructions. It has found lasting use in applications previously coded in assembly language. Such applications include operating systems and various application software for computer architectures that range from supercomputers to PLCs and embedded systems.
Common Lisp (CL) is a dialect of the Lisp programming language, published in ANSI standard document ANSI INCITS 226-1994 (S20018). The Common Lisp HyperSpec, a hyperlinked HTML version, has been derived from the ANSI Common Lisp standard.
VBScript is an Active Scripting language developed by Microsoft that is modeled on Visual Basic. It allows Microsoft Windows system administrators to generate powerful tools for managing computers with error handling, subroutines, and other advanced programming constructs. It can give the user complete control over many aspects of their computing environment.
Java and C++ are two prominent object-oriented programming languages. By many language popularity metrics, the two languages have dominated object-oriented and high-performance software development for much of the 21st century, and are often directly compared and contrasted. Java appeared about 10 years later and its syntax was based on C/C++.
In computing, a core dump, memory dump, crash dump, system dump, or ABEND dump consists of the recorded state of the working memory of a computer program at a specific time, generally when the program has crashed or otherwise terminated abnormally. In practice, other key pieces of program state are usually dumped at the same time, including the processor registers, which may include the program counter and stack pointer, memory management information, and other processor and operating system flags and information. A snapshot dump is a memory dump requested by the computer operator or by the running program, after which the program is able to continue. Core dumps are often used to assist in diagnosing and debugging errors in computer programs.

Memory management is a form of resource management applied to computer memory. The essential requirement of memory management is to provide ways to dynamically allocate portions of memory to programs at their request, and free it for reuse when no longer needed. This is critical to any advanced computer system where more than a single process might be underway at any time.
In software development, Make is a build automation tool that automatically builds executable programs and libraries from source code by reading files called Makefiles which specify how to derive the target program. Though integrated development environments and language-specific compiler features can also be used to manage a build process, Make remains widely used, especially in Unix and Unix-like operating systems.

The C preprocessor is the macro preprocessor for the C, Objective-C and C++ computer programming languages. The preprocessor provides the ability for the inclusion of header files, macro expansions, conditional compilation, and line control.
The Common Object File Format (COFF) is a format for executable, object code, and shared library computer files used on Unix systems. It was introduced in Unix System V, replaced the previously used a.out format, and formed the basis for extended specifications such as XCOFF and ECOFF, before being largely replaced by ELF, introduced with SVR4. COFF and its variants continue to be used on some Unix-like systems, on Microsoft Windows, in UEFI environments and in some embedded development systems.
A programming tool or software development tool is a computer program that software developers use to create, debug, maintain, or otherwise support other programs and applications. The term usually refers to relatively simple programs, that can be combined to accomplish a task, much as one might use multiple hands to fix a physical object. The most basic tools are a source code editor and a compiler or interpreter, which are used ubiquitously and continuously. Other tools are used more or less depending on the language, development methodology, and individual engineer, often used for a discrete task, like a debugger or profiler. Tools may be discrete programs, executed separately – often from the command line – or may be parts of a single large program, called an integrated development environment (IDE). In many cases, particularly for simpler use, simple ad hoc techniques are used instead of a tool, such as print debugging instead of using a debugger, manual timing instead of a profiler, or tracking bugs in a text file or spreadsheet instead of a bug tracking system.
A memory debugger is a debugger for finding software memory problems such as memory leaks and buffer overflows. These are due to bugs related to the allocation and deallocation of dynamic memory. Programs written in languages that have garbage collection, such as managed code, might also need memory debuggers, e.g. for memory leaks due to "living" references in collections.
CodeView is a standalone debugger created by David Norris at Microsoft in 1985 as part of its development toolset. It originally shipped with Microsoft C 4.0 and later. It also shipped with Visual Basic for MS-DOS, Microsoft BASIC PDS, and a number of other Microsoft language products. It was one of the first debuggers for MS-DOS to be full-screen oriented, rather than line-oriented.
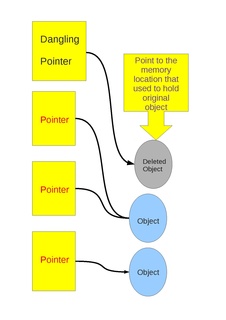
Dangling pointers and wild pointers in computer programming are pointers that do not point to a valid object of the appropriate type. These are special cases of memory safety violations. More generally, dangling references and wild references are references that do not resolve to a valid destination, and include such phenomena as link rot on the internet.
Open-source software development is the process by which open-source software, or similar software whose source code is publicly available, is developed by an open-source software project. These are software products available with its source code under an open-source license to study, change, and improve its design. Examples of some popular open-source software products are Mozilla Firefox, Google Chromium, Android, LibreOffice and the VLC media player.
Libcwd is a C++ library, written by Carlo Wood, to add run-time debugging support for C++ applications, particularly for code developed with the GNU Compiler Collection. The functionality that the library adds to an application can be divided into three categories:
- Ostream-based debug output.
- Run-time access to debug information.
- Run-time access to memory allocation administration.
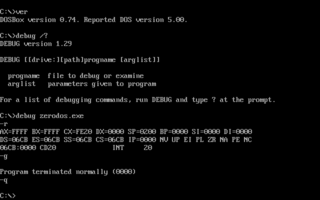
The line-oriented debugger DEBUG is an external command in operating systems such as DOS, OS/2 and Windows.
The Windows software trace preprocessor is a preprocessor that simplifies the use of WMI event tracing to implement efficient software tracing in drivers and applications that target Windows 2000 and later operating systems. WPP was created by Microsoft and is included in the Windows DDK. Although WPP is wide in its applicability, it is not included in the Windows SDK, and therefore is primarily used for drivers and driver support software produced by software vendors that purchase the Windows DDK.
In the C++ programming language, placement syntax allows programmers to explicitly specify the memory management of individual objects — i.e. their "placement" in memory. Normally, when an object is created dynamically, an allocation function is invoked in such a way that it will both allocate memory for the object, and initialize the object within the newly allocated memory. The placement syntax allows the programmer to supply additional arguments to the allocation function. A common use is to supply a pointer to a suitable region of storage where the object can be initialized, thus separating memory allocation from object construction.
In computer programming and software development, debugging is the process of finding and resolving bugs within computer programs, software, or systems.