Related Research Articles
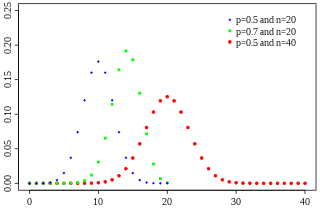
In probability theory and statistics, the binomial distribution with parameters n and p is the discrete probability distribution of the number of successes in a sequence of n independent experiments, each asking a yes–no question, and each with its own Boolean-valued outcome: success or failure. A single success/failure experiment is also called a Bernoulli trial or Bernoulli experiment, and a sequence of outcomes is called a Bernoulli process; for a single trial, i.e., n = 1, the binomial distribution is a Bernoulli distribution. The binomial distribution is the basis for the popular binomial test of statistical significance.

In mathematics, the binomial coefficients are the positive integers that occur as coefficients in the binomial theorem. Commonly, a binomial coefficient is indexed by a pair of integers n ≥ k ≥ 0 and is written It is the coefficient of the xk term in the polynomial expansion of the binomial power (1 + x)n; this coefficient can be computed by the multiplicative formula
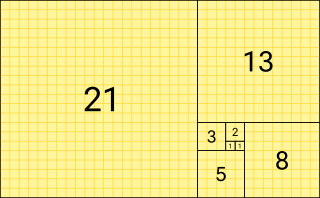
In mathematics, the Fibonacci sequence is a sequence in which each number is the sum of the two preceding ones. Numbers that are part of the Fibonacci sequence are known as Fibonacci numbers, commonly denoted Fn . The sequence commonly starts from 0 and 1, although some authors start the sequence from 1 and 1 or sometimes from 1 and 2. Starting from 0 and 1, the sequence begins

A histogram is a visual representation of the distribution of numeric data. The term was first introduced by Karl Pearson. To construct a histogram, the first step is to "bin" the range of values— divide the entire range of values into a series of intervals—and then count how many values fall into each interval. The bins are usually specified as consecutive, non-overlapping intervals of a variable. The bins (intervals) must be adjacent and are often of equal size.

In physics, the kinetic energy of an object is the form of energy that it possesses due to its motion.

Oscillation is the repetitive or periodic variation, typically in time, of some measure about a central value or between two or more different states. Familiar examples of oscillation include a swinging pendulum and alternating current. Oscillations can be used in physics to approximate complex interactions, such as those between atoms.

In mathematics, a divisor of an integer also called a factor of is an integer that may be multiplied by some integer to produce In this case, one also says that is a multiple of An integer is divisible or evenly divisible by another integer if is a divisor of ; this implies dividing by leaves no remainder.

The ideal gas law, also called the general gas equation, is the equation of state of a hypothetical ideal gas. It is a good approximation of the behavior of many gases under many conditions, although it has several limitations. It was first stated by Benoît Paul Émile Clapeyron in 1834 as a combination of the empirical Boyle's law, Charles's law, Avogadro's law, and Gay-Lussac's law. The ideal gas law is often written in an empirical form:

The pascal is the unit of pressure in the International System of Units (SI). It is also used to quantify internal pressure, stress, Young's modulus, and ultimate tensile strength. The unit, named after Blaise Pascal, is a SI coherent derived unit defined as one newton per square metre (N/m2). It is also equivalent to 10 barye in the CGS system. Common multiple units of the pascal are the hectopascal, which is equal to one millibar, and the kilopascal, which is equal to one centibar.
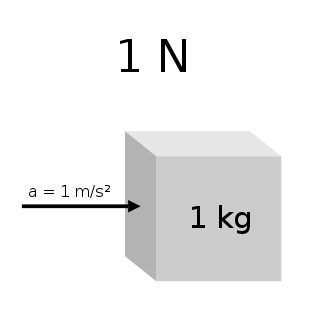
The newton is the unit of force in the International System of Units (SI). It is defined as , the force which gives a mass of 1 kilogram an acceleration of 1 metre per second per second. It is named after Isaac Newton in recognition of his work on classical mechanics, specifically his second law of motion.
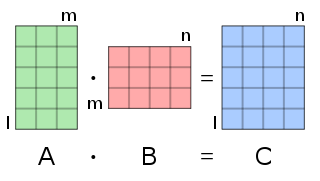
In mathematics, particularly in linear algebra, matrix multiplication is a binary operation that produces a matrix from two matrices. For matrix multiplication, the number of columns in the first matrix must be equal to the number of rows in the second matrix. The resulting matrix, known as the matrix product, has the number of rows of the first and the number of columns of the second matrix. The product of matrices A and B is denoted as AB.
The moment of inertia, otherwise known as the mass moment of inertia, angular mass, second moment of mass, or most accurately, rotational inertia, of a rigid body is a quantity that determines the torque needed for a desired angular acceleration about a rotational axis, akin to how mass determines the force needed for a desired acceleration. It depends on the body's mass distribution and the axis chosen, with larger moments requiring more torque to change the body's rate of rotation by a given amount.
Inductance is the tendency of an electrical conductor to oppose a change in the electric current flowing through it. The electric current produces a magnetic field around the conductor. The magnetic field strength depends on the magnitude of the electric current, and follows any changes in the magnitude of the current. From Faraday's law of induction, any change in magnetic field through a circuit induces an electromotive force (EMF) (voltage) in the conductors, a process known as electromagnetic induction. This induced voltage created by the changing current has the effect of opposing the change in current. This is stated by Lenz's law, and the voltage is called back EMF.

In statistics, the logistic model is a statistical model that models the log-odds of an event as a linear combination of one or more independent variables. In regression analysis, logistic regression is estimating the parameters of a logistic model. Formally, in binary logistic regression there is a single binary dependent variable, coded by an indicator variable, where the two values are labeled "0" and "1", while the independent variables can each be a binary variable or a continuous variable. The corresponding probability of the value labeled "1" can vary between 0 and 1, hence the labeling; the function that converts log-odds to probability is the logistic function, hence the name. The unit of measurement for the log-odds scale is called a logit, from logistic unit, hence the alternative names. See § Background and § Definition for formal mathematics, and § Example for a worked example.
In mathematics, summation is the addition of a sequence of numbers, called addends or summands; the result is their sum or total. Beside numbers, other types of values can be summed as well: functions, vectors, matrices, polynomials and, in general, elements of any type of mathematical objects on which an operation denoted "+" is defined.

In biochemistry, Michaelis–Menten kinetics, named after Leonor Michaelis and Maud Menten, is the simplest case of enzyme kinetics, applied to enzyme-catalysed reactions of one substrate and one product. It takes the form of a differential equation describing the reaction rate to , the concentration of the substrate A. Its formula is given by the Michaelis–Menten equation:
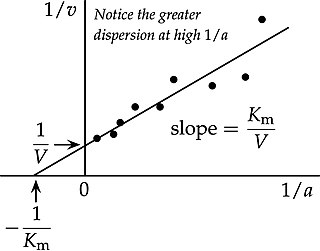
In biochemistry, the Lineweaver–Burk plot is a graphical representation of the Michaelis–Menten equation of enzyme kinetics, described by Hans Lineweaver and Dean Burk in 1934.

In biochemistry, a Hanes–Woolf plot, Hanes plot, or plot of against is a graphical representation of enzyme kinetics in which the ratio of the initial substrate concentration to the reaction velocity is plotted against . It is based on the rearrangement of the Michaelis–Menten equation shown below:
Temperature is a physical quantity that quantitatively expresses the attribute of hotness or coldness. Temperature is measured with a thermometer. It reflects the average kinetic energy of the vibrating and colliding atoms making up a substance.

In probability theory and statistics, the Poisson distribution is a discrete probability distribution that expresses the probability of a given number of events occurring in a fixed interval of time if these events occur with a known constant mean rate and independently of the time since the last event. It can also be used for the number of events in other types of intervals than time, and in dimension greater than 1.
References
| | This article about a German canoeist is a stub. You can help Wikipedia by expanding it. |