
A mind map is a diagram used to visually organize information. A mind map is hierarchical and shows relationships among pieces of the whole. It is often created around a single concept, drawn as an image in the center of a blank page, to which associated representations of ideas such as images, words and parts of words are added. Major ideas are connected directly to the central concept, and other ideas branch out from those major ideas.

A tree structure or tree diagram is a way of representing the hierarchical nature of a structure in a graphical form. It is named a "tree structure" because the classic representation resembles a tree, even though the chart is generally upside down compared to a biological tree, with the "stem" at the top and the "leaves" at the bottom.

A parse tree or parsing tree or derivation tree or concrete syntax tree is an ordered, rooted tree that represents the syntactic structure of a string according to some context-free grammar. The term parse tree itself is used primarily in computational linguistics; in theoretical syntax, the term syntax tree is more common.

In mathematics, and especially in category theory, a commutative diagram is a diagram such that all directed paths in the diagram with the same start and endpoints lead to the same result. It is said that commutative diagrams play the role in category theory that equations play in algebra.

A phylogenetic tree is a branching diagram or a tree showing the evolutionary relationships among various biological species or other entities based upon similarities and differences in their physical or genetic characteristics. All life on Earth is part of a single phylogenetic tree, indicating common ancestry.
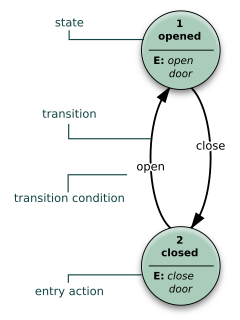
A state diagram is a type of diagram used in computer science and related fields to describe the behavior of systems. State diagrams require that the system described is composed of a finite number of states; sometimes, this is indeed the case, while at other times this is a reasonable abstraction. Many forms of state diagrams exist, which differ slightly and have different semantics.

In the mathematical field of Lie theory, a Dynkin diagram, named for Eugene Dynkin, is a type of graph with some edges doubled or tripled. The multiple edges are, within certain constraints, directed.

Graph drawing is an area of mathematics and computer science combining methods from geometric graph theory and information visualization to derive two-dimensional depictions of graphs arising from applications such as social network analysis, cartography, linguistics, and bioinformatics.

In computing, a visual programming language (VPL) is any programming language that lets users create programs by manipulating program elements graphically rather than by specifying them textually. A VPL allows programming with visual expressions, spatial arrangements of text and graphic symbols, used either as elements of syntax or secondary notation. For example, many VPLs are based on the idea of "boxes and arrows", where boxes or other screen objects are treated as entities, connected by arrows, lines or arcs which represent relations.

Laboratory Virtual Instrument Engineering Workbench (LabVIEW) is a system-design platform and development environment for a visual programming language from National Instruments.

Infographics are graphic visual representations of information, data, or knowledge intended to present information quickly and clearly. They can improve cognition by utilizing graphics to enhance the human visual system's ability to see patterns and trends. Similar pursuits are information visualization, data visualization, statistical graphics, information design, or information architecture. Infographics have evolved in recent years to be for mass communication, and thus are designed with fewer assumptions about the readers' knowledge base than other types of visualizations. Isotypes are an early example of infographics conveying information quickly and easily to the masses.
An influence diagram (ID) is a compact graphical and mathematical representation of a decision situation. It is a generalization of a Bayesian network, in which not only probabilistic inference problems but also decision making problems can be modeled and solved.

Autodesk Softimage, or simply Softimage is a discontinued 3D computer graphics application, for producing 3D computer graphics, 3D modeling, and computer animation. Now owned by Autodesk and formerly titled Softimage|XSI, the software has been predominantly used in the film, video game, and advertising industries for creating computer generated characters, objects, and environments.
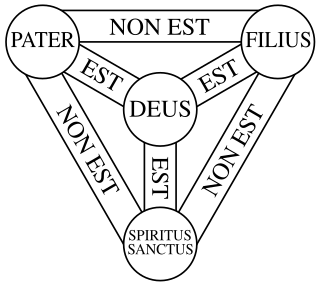
The Shield of the Trinity or Scutum Fidei is a traditional Christian visual symbol which expresses many aspects of the doctrine of the Trinity, summarizing the first part of the Athanasian Creed in a compact diagram. In late medieval Europe, this emblem was considered to be the heraldic arms of God.

Idit R. Harel is an Israeli-American entrepreneur and CEO of Globaloria. She is a learning sciences researcher and pioneer of Constructionist learning-based EdTech interventions.

Diagrammatic reasoning is reasoning by means of visual representations. The study of diagrammatic reasoning is about the understanding of concepts and ideas, visualized with the use of diagrams and imagery instead of by linguistic or algebraic means.
A signal-flow graph or signal-flowgraph (SFG), invented by Claude Shannon, but often called a Mason graph after Samuel Jefferson Mason who coined the term, is a specialized flow graph, a directed graph in which nodes represent system variables, and branches represent functional connections between pairs of nodes. Thus, signal-flow graph theory builds on that of directed graphs, which includes as well that of oriented graphs. This mathematical theory of digraphs exists, of course, quite apart from its applications.
Node graph architecture is a software design structured around the notion of a node graph. Both the source code as well as the user interface is designed around the editing and composition of atomic functional units.

VisualFEA is a finite element analysis program running on MS Windows and Mac OS X platforms. The program is being developed and distributed by Intuition Software, Inc. in South Korea, and is used chiefly for structural and geotechnical analysis. The strongest point of the program is its intuitive and user-friendly usage based on graphical pre- and postprocessing capabilities. VisualFEA has educational functions for teaching and learning structural mechanics and finite element analysis through graphical simulation. Thus, this program is widely used in college courses related to structural mechanics and finite element method.

Parametric design is a process based on algorithmic thinking that enables the expression of parameters and rules that, together, define, encode and clarify the relationship between design intent and design response.