
Autocorrelation, sometimes known as serial correlation in the discrete time case, is the correlation of a signal with a delayed copy of itself as a function of delay. Informally, it is the similarity between observations of a random variable as a function of the time lag between them. The analysis of autocorrelation is a mathematical tool for finding repeating patterns, such as the presence of a periodic signal obscured by noise, or identifying the missing fundamental frequency in a signal implied by its harmonic frequencies. It is often used in signal processing for analyzing functions or series of values, such as time domain signals.
Linear prediction is a mathematical operation where future values of a discrete-time signal are estimated as a linear function of previous samples.
Filter design is the process of designing a signal processing filter that satisfies a set of requirements, some of which may be conflicting. The purpose is to find a realization of the filter that meets each of the requirements to a sufficient degree to make it useful.

In mathematics, a time series is a series of data points indexed in time order. Most commonly, a time series is a sequence taken at successive equally spaced points in time. Thus it is a sequence of discrete-time data. Examples of time series are heights of ocean tides, counts of sunspots, and the daily closing value of the Dow Jones Industrial Average.
In signal processing, a finite impulse response (FIR) filter is a filter whose impulse response is of finite duration, because it settles to zero in finite time. This is in contrast to infinite impulse response (IIR) filters, which may have internal feedback and may continue to respond indefinitely.

In mathematics, a Boolean function is a function whose arguments and result assume values from a two-element set. Alternative names are switching function, used especially in older computer science literature, and truth function, used in logic. Boolean functions are the subject of Boolean algebra and switching theory.
Harmonic Vector Excitation Coding, abbreviated as HVXC is a speech coding algorithm specified in MPEG-4 Part 3 standard for very low bit rate speech coding. HVXC supports bit rates of 2 and 4 kbit/s in the fixed and variable bit rate mode and sampling frequency 8 kHz. It also operates at lower bitrates, such as 1.2 - 1.7 kbit/s, using a variable bit rate technique. The total algorithmic delay for the encoder and decoder is 36 ms.
The Green–Kubo relations give the exact mathematical expression for transport coefficients in terms of integrals of time correlation functions:
A maximum length sequence (MLS) is a type of pseudorandom binary sequence.
A pitch detection algorithm (PDA) is an algorithm designed to estimate the pitch or fundamental frequency of a quasiperiodic or oscillating signal, usually a digital recording of speech or a musical note or tone. This can be done in the time domain, the frequency domain, or both.
In time series analysis, the Box–Jenkins method, named after the statisticians George Box and Gwilym Jenkins, applies autoregressive moving average (ARMA) or autoregressive integrated moving average (ARIMA) models to find the best fit of a time-series model to past values of a time series.
In statistics, the Durbin–Watson statistic is a test statistic used to detect the presence of autocorrelation at lag 1 in the residuals from a regression analysis. It is named after James Durbin and Geoffrey Watson. The small sample distribution of this ratio was derived by John von Neumann. Durbin and Watson applied this statistic to the residuals from least squares regressions, and developed bounds tests for the null hypothesis that the errors are serially uncorrelated against the alternative that they follow a first order autoregressive process. Note that the distribution of this test statistic does not depend on the estimated regression coefficients and the variance of the errors.

In the analysis of data, a correlogram is a chart of correlation statistics. For example, in time series analysis, a plot of the sample autocorrelations versus is an autocorrelogram. If cross-correlation is plotted, the result is called a cross-correlogram.

Dynamic light scattering (DLS) is a technique in physics that can be used to determine the size distribution profile of small particles in suspension or polymers in solution. In the scope of DLS, temporal fluctuations are usually analyzed using the intensity or photon auto-correlation function. In the time domain analysis, the autocorrelation function (ACF) usually decays starting from zero delay time, and faster dynamics due to smaller particles lead to faster decorrelation of scattered intensity trace. It has been shown that the intensity ACF is the Fourier transform of the power spectrum, and therefore the DLS measurements can be equally well performed in the spectral domain. DLS can also be used to probe the behavior of complex fluids such as concentrated polymer solutions.
Maximum entropy spectral estimation is a method of spectral density estimation. The goal is to improve the spectral quality based on the principle of maximum entropy. The method is based on choosing the spectrum which corresponds to the most random or the most unpredictable time series whose autocorrelation function agrees with the known values. This assumption, which corresponds to the concept of maximum entropy as used in both statistical mechanics and information theory, is maximally non-committal with regard to the unknown values of the autocorrelation function of the time series. It is simply the application of maximum entropy modeling to any type of spectrum and is used in all fields where data is presented in spectral form. The usefulness of the technique varies based on the source of the spectral data since it is dependent on the amount of assumed knowledge about the spectrum that can be applied to the model.
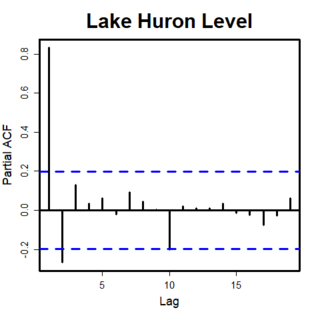
In time series analysis, the partial autocorrelation function (PACF) gives the partial correlation of a stationary time series with its own lagged values, regressed the values of the time series at all shorter lags. It contrasts with the autocorrelation function, which does not control for other lags.
In probability theory and related fields, the life-time of correlation measures the timespan over which there is appreciable autocorrelation or cross-correlation in stochastic processes.
The Blackman–Tukey transformation is a digital signal processing method to transform data from the time domain to the frequency domain. It was originally programmed around 1953 by James Cooley for John Tukey at John von Neumann's Institute for Advanced Study as a way to get "good smoothed statistical estimates of power spectra without requiring large Fourier transforms." It was published by Ralph Beebe Blackman and John Tukey in 1958.
Multidimension spectral estimation is a generalization of spectral estimation, normally formulated for one-dimensional signals, to multidimensional signals or multivariate data, such as wave vectors.