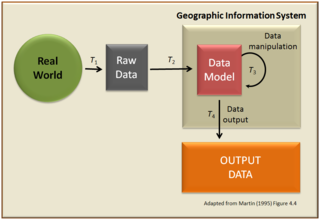
A geographic information system (GIS) consists of integrated computer hardware and software that store, manage, analyze, edit, output, and visualize geographic data. Much of this often happens within a spatial database, however, this is not essential to meet the definition of a GIS. In a broader sense, one may consider such a system also to include human users and support staff, procedures and workflows, the body of knowledge of relevant concepts and methods, and institutional organizations.
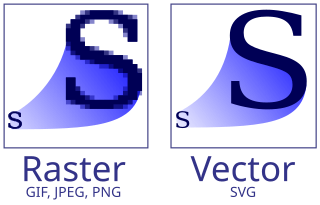
Vector graphics are a form of computer graphics in which visual images are created directly from geometric shapes defined on a Cartesian plane, such as points, lines, curves and polygons. The associated mechanisms may include vector display and printing hardware, vector data models and file formats, as well as the software based on these data models. Vector graphics is an alternative to raster or bitmap graphics, with each having advantages and disadvantages in specific situations.

In vector computer graphics, CAD systems, and geographic information systems, geometric primitive is the simplest geometric shape that the system can handle. Sometimes the subroutines that draw the corresponding objects are called "geometric primitives" as well. The most "primitive" primitives are point and straight line segment, which were all that early vector graphics systems had.
A GIS file format is a standard for encoding geographical information into a computer file, as a specialized type of file format for use in geographic information systems (GIS) and other geospatial applications. Since the 1970s, dozens of formats have been created based on various data models for various purposes. They have been created by government mapping agencies, GIS software vendors, standards bodies such as the Open Geospatial Consortium, informal user communities, and even individual developers.

Scientific visualization is an interdisciplinary branch of science concerned with the visualization of scientific phenomena. It is also considered a subset of computer graphics, a branch of computer science. The purpose of scientific visualization is to graphically illustrate scientific data to enable scientists to understand, illustrate, and glean insight from their data. Research into how people read and misread various types of visualizations is helping to determine what types and features of visualizations are most understandable and effective in conveying information.
TerraLib is an open-source geographic information system (GIS) software library. It extends object-relational database management systems (DBMS) to handle spatiotemporal data types.
A GIS software program is a computer program to support the use of a geographic information system, providing the ability to create, store, manage, query, analyze, and visualize geographic data, that is, data representing phenomena for which location is important. The GIS software industry encompasses a broad range of commercial and open-source products that provide some or all of these capabilities within various information technology architectures.
GRIB is a concise data format commonly used in meteorology to store historical and forecast weather data. It is standardized by the World Meteorological Organization's Commission for Basic Systems, known under number GRIB FM 92-IX, described in WMO Manual on Codes No.306. Currently there are three versions of GRIB. Version 0 was used to a limited extent by projects such as TOGA, and is no longer in operational use. The first edition is used operationally worldwide by most meteorological centers, for Numerical Weather Prediction output (NWP). A newer generation has been introduced, known as GRIB second edition, and data is slowly changing over to this format. Some of the second-generation GRIB is used for derived products distributed in the Eumetcast of Meteosat Second Generation. Another example is the NAM model.
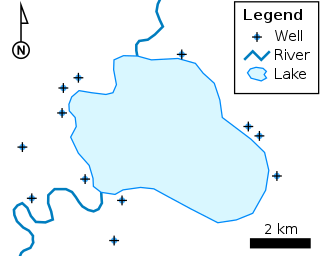
The shapefile format is a geospatial vector data format for geographic information system (GIS) software. It is developed and regulated by Esri as a mostly open specification for data interoperability among Esri and other GIS software products. The shapefile format can spatially describe vector features: points, lines, and polygons, representing, for example, water wells, rivers, and lakes. Each item usually has attributes that describe it, such as name or temperature.

In computer graphics, a heightmap or heightfield is a raster image used mainly as Discrete Global Grid in secondary elevation modeling. Each pixel stores values, such as surface elevation data, for display in 3D computer graphics. A heightmap can be used in bump mapping to calculate where this 3D data would create shadow in a material, in displacement mapping to displace the actual geometric position of points over the textured surface, or for terrain where the heightmap is converted into a 3D mesh.

gvSIG, geographic information system (GIS), is a desktop application designed for capturing, storing, handling, analyzing and deploying any kind of referenced geographic information in order to solve complex management and planning problems. gvSIG is known for having a user-friendly interface, being able to access the most common formats, both vector and raster ones. It features a wide range of tools for working with geographic-like information.
Geomorphometry, or geomorphometrics, is the science and practice of measuring the characteristics of terrain, the shape of the surface of the Earth, and the effects of this surface form on human and natural geography. It gathers various mathematical, statistical and image processing techniques that can be used to quantify morphological, hydrological, ecological and other aspects of a land surface. Common synonyms for geomorphometry are geomorphological analysis, terrain morphometry, terrain analysis, and land surface analysis. Geomorphometrics is the discipline based on the computational measures of the geometry, topography and shape of the Earth's horizons, and their temporal change. This is a major component of geographic information systems (GIS) and other software tools for spatial analysis.

MeshLab is a 3D mesh processing software system that is oriented to the management and processing of unstructured large meshes and provides a set of tools for editing, cleaning, healing, inspecting, rendering, and converting these kinds of meshes. MeshLab is free and open-source software, subject to the requirements of the GNU General Public License (GPL), version 2 or later, and is used as both a complete package and a library powering other software. It is well known in the more technical fields of 3D development and data handling.
Integrated Land and Water Information System (ILWIS) is a geographic information system (GIS) and remote sensing software for both vector and raster processing. Its features include digitizing, editing, analysis and display of data, and production of quality maps. ILWIS was initially developed and distributed by ITC Enschede in the Netherlands for use by its researchers and students. Since 1 July 2007, it has been released as free software under the terms of the GPL-2.0-only license. Having been used by many students, teachers and researchers for more than two decades, ILWIS is one of the most user-friendly integrated vector and raster software programmes currently available. ILWIS has some very powerful raster analysis modules, a high-precision and flexible vector and point digitizing module, a variety of very practical tools, as well as a great variety of user guides and training modules all available for downloading. The current version is ILWIS 3.8.6. Similar to the GRASS GIS in many respects, ILWIS is currently available natively only on Microsoft Windows. However, a Linux Wine manual has been released.

A 3D city model is digital model of urban areas that represent terrain surfaces, sites, buildings, vegetation, infrastructure and landscape elements in three-dimensional scale as well as related objects belonging to urban areas. Their components are described and represented by corresponding two- and three-dimensional spatial data and geo-referenced data. 3D city models support presentation, exploration, analysis, and management tasks in a large number of different application domains. In particular, 3D city models allow "for visually integrating heterogeneous geoinformation within a single framework and, therefore, create and manage complex urban information spaces."
A geographic data model, geospatial data model, or simply data model in the context of geographic information systems, is a mathematical and digital structure for representing phenomena over the Earth. Generally, such data models represent various aspects of these phenomena by means of geographic data, including spatial locations, attributes, change over time, and identity. For example, the vector data model represents geography as collections of points, lines, and polygons, and the raster data model represent geography as cell matrices that store numeric values. Data models are implemented throughout the GIS ecosystem, including the software tools for data management and spatial analysis, data stored in a variety of GIS file formats, specifications and standards, and specific designs for GIS installations.
HOOPS Visualize is a 3D computer graphics software designed to render graphics across both mobile and desktop platforms. HOOPS Visualize provides 3D Graphics API to render CAD models. It's part of the HOOPS 3D Application Framework SDK. Since June 2018 it's licensed via Siemens PLM Software.
Biosphere3D is an open-source project that targets interactive landscape scenery rendering based on a virtual globe. The software system supports multiple scales but focuses primarily on the creation of realistic views from eye-level or near ground level. The software is released under the MPL license and developed by Zuse Institute Berlin, Lenné3D and the open-source community for use on personal computers.

The Point Cloud Library (PCL) is an open-source library of algorithms for point cloud processing tasks and 3D geometry processing, such as occur in three-dimensional computer vision. The library contains algorithms for filtering, feature estimation, surface reconstruction, 3D registration, model fitting, object recognition, and segmentation. Each module is implemented as a smaller library that can be compiled separately. PCL has its own data format for storing point clouds - PCD, but also allows datasets to be loaded and saved in many other formats. It is written in C++ and released under the BSD license.
