Limerick County Council election, 2004

Last updated
Limerick County Council election, 2004
Flag of Ireland.svg
  1999 11 June 2004 2009  

All 28 seats to Limerick County Council

  First party Second party Third party
 
Party Fianna Fáil Fine Gael Progressive Democrats
Seats won 12 12 3
Seat change -2 +2 -

  Fourth party Fifth party
 
Party Labour Party Independent
Seats won 1 0
Seat change +1 -1

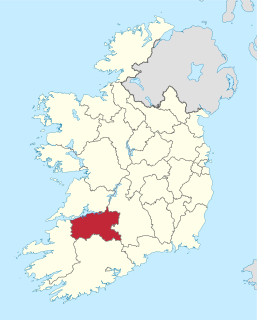
Limerick in Ireland.svg

Map showing the area of Limerick County Council

Council control after election

TBD

An election to Limerick County Council took place on 11 June 2004 as part of that year's Irish local elections. 28 councillors were elected from five electoral divisions by PR-STV voting for a five-year term of office.

Limerick County Council

Limerick County Council was the authority responsible for local government in County Limerick, Ireland. As a county council, it was governed by the Local Government Act 2001. The council had 28 elected members. Elections for the council were held every five years and were by single transferable vote. The head of the council had the title of Cathaoirleach (Chairperson).

Contents

Results by party

PartySeats±First Pref. votesFPv%±%
Fianna Fáil 12-223,15739.13%
Fine Gael 12+222,84138.60%
Progressive Democrats 3-4,6817.91%
Labour Party 1+12,2793.85%
Independent 0-14,1216.96%
Totals28-59,175100%

Results by Electoral Area

Bruff

Bruff - 7 seats
Party Candidate % 1st Pref Count 1 Count 2Count 3Count 4Count 5Count 6Count 7Count 8Count 9Count 10Count 11Count 12
Fine Gael Richard Butler* 14.041,954           
Fianna Fáil Niall Collins 11.49 1,6001,637 1,6481,6571,6731,6851,6981,768    
Fine Gael Cormac Hurley* 7.96 1,1081,144 1,1481,1751,2641,3621,4531,4571,4891,5551,744 
Fianna Fáil Leonard Enright * 7.72 1,0751,086 1,0961,1011,1081,1141,1231,1971,2981,3501,4381,510
Fianna Fáil John Clifford* 6.61 920922 1,0041,0091,0111,0171,0231,0861,1691,2071,2221,454
Progressive Democrats Rose Brennan* 6.49 904911 9219259299609651,1131,1961,4401,6621,855
Labour Party Deirdre Ní Chinneide 6.34 883908 9129389549701,2201,2251,2701,4071,4401,566
Fianna Fáil Sandra Marsh* 5.55 772778 7847988289359819991,0251,1001,1311,174
Fine Gael Gerard Murnane 4.76 663678 7367477827867928018608991,070 
Fine Gael Tom P. Healy 4.53 631665 668675694695704802848866  
Progressive Democrats Sinead Teefy 4.40 613631 659671676736762776817   
Independent Patrick Fitzgerald 3.99 556560 562623636642658680    
Fianna Fáil James Cavanagh 3.99 555557 559559559562563     
Labour Party Karan O'Loughlin 3.08 429432 437468508545      
Progressive Democrats Pat Hennessy* 2.79 388391 398413428       
Fine Gael Tina O'Gorman 2.41 335342 343351        
Independent Denis Riordan 1.95 271274 277         
Progressive Democrats George O'Leary 1.90 264264           
Electorate: 23,618  Valid: 13,921 (58.94%)  Spoilt: 253  Quota: 1,741  Turnout: 14,174 (60.01%)

    Castleconnell

    Castleconnell - 7 seats
    Party Candidate % 1st Pref Count 1 Count 2Count 3Count 4Count 5Count 6Count 7Count 8Count 9
    Fine Gael Mary Jackman * 14.602,119        
    Fianna Fáil Eddie Wade * 14.352,083        
    Progressive Democrats Brigid Teefy* 10.25 1,4871,516 1,5991,6061,6481,6751,7151,829 
    Fianna Fáil Joe Meagher* 9.08 1,3181,322 1,3471,3501,3661,4611,4701,4851,534
    Fianna Fáil Noel Gleeson 8.92 1,2941,300 1,3361,3441,3601,4141,4301,4671,692
    Fine Gael Kieran O'Donnell 8.01 1,1631,259 1,2741,2891,3161,3291,3901,5281,776
    Fianna Fáil Noreen Ryan* 8.01 1,1631,184 1,2201,2261,2891,3111,3421,4051,601
    Fine Gael Mary Harty* 7.43 1,0791,128 1,1431,1561,1631,2531,2931,4191,732
    Fine Gael Paddy Hourigan* 7.37 1,0691,111 1,1251,1311,1401,1541,1801,231 
    Green Party Trish Forde-Brennan 3.71 539564 569604619624842  
    Labour Party Manus Bree 3.27 474490 494522538546   
    Fianna Fáil Tim Long 2.24 325328 344347360    
    Fianna Fáil Ursula Stokes 1.62 235246 262266     
    Independent Seán Gilmour 1.14 166168 171      
    Electorate: 25,025  Valid: 14,514 (58.00%)  Spoilt: 253  Quota: 1,815  Turnout: 14,767 (59.01%)

      Kilmallock

      Kilmallock - 4 seats
      Party Candidate % 1st Pref Count 1 Count 2Count 3Count 4Count 5Count 6Count 7Count 8
      Fianna Fáil John Gallahue* 17.43 1,7151,725 1,8031,8351,8961,9162,196 
      Fine Gael Jim Houlihan* 14.25 1,4021,427 1,4681,7452,105   
      Fianna Fáil Pat McAuliffe* 13.78 1,3561,376 1,4241,4701,5621,6001,8581,928
      Progressive Democrats Eddie Creighton* 13.10 1,2891,296 1,3381,3861,4141,4351,6161,668
      Fianna Fáil Eddie Ryan 12.58 1,2381,242 1,2931,3271,3451,3671,5491,603
      Independent Pat Heffernan 9.32 917950 1,0731,1461,2661,301  
      Independent Brendan Danaher 7.17 706723 753813    
      Fine Gael Thomas Blackburne 5.73 564577 604     
      Sinn Féin Noel Hanley 2.91 286303       
      Labour Party Thomas Rea 2.03 200207       
      Independent James Coll 1.71 168       
      Electorate: 15,225  Valid: 9,841 (64.64%)  Spoilt: 161  Quota: 1,969  Turnout: 10,002 (65.69%)

        Newcastle West

        Newcastle West - 5 seats
        Party Candidate % 1st Pref Count 1 Count 2Count 3Count 4Count 5Count 6Count 7Count 8Count 9Count 10
        Fine Gael Patrick O'Donovan * 13.26 1,4851,492 1,5181,5521,5661,6541,7071,7571,932 
        Fine Gael Liam Galvin 11.74 1,3151,335 1,3461,4061,4121,4591,4891,5231,5761,959
        Fianna Fáil Michael J. Collins 10.72 1,2001,212 1,2331,2511,2841,3901,4601,6101,7621,818
        Fianna Fáil Seamus Ahern* 10.20 1,1421,149 1,1521,1611,1701,2001,2231,2751,3051,386
        Fianna Fáil Francis Foley 9.35 1,0471,056 1,0631,1021,1101,1531,1801,2611,3581,574
        Fine Gael Jerome Scanlan 9.24 1,0351,038 1,0451,0581,1601,2021,3271,4551,5571,681
        Fine Gael Maurice Hartnett 7.78 871890 8939439639961,0141,0361,075 
        Independent Joseph Mullane 5.19 581588 602617641720800842  
        Fianna Fáil Vincent Kiely 4.88 547548 551555606624661   
        Independent Marian Collins 4.47 501517 527542564     
        Independent John Leahy 3.78 423425 427433      
        Sinn Féin Coireall MacCurtain 3.66 410416 497510605623    
        Labour Party Denis Hobson 2.62 293310 311       
        Sinn Féin Mike MacDomhnaill 1.75 196201         
        Green Party Eamon Collins 1.37 153         
        Electorate: 17,522  Valid: 11,199 (63.91%)  Spoilt: 182  Quota: 1,867  Turnout: 11,381 (64.95%)

          Rathkeale

          Rathkeale- 5 seats
          Party Candidate % 1st Pref Count 1 Count 2Count 3Count 4
          Fine Gael Tom Neville* 24.712,599   
          Fine Gael David Naughton* 13.05 1,3731,595 1,761 
          Fianna Fáil Kevin Sheahan* 12.85 1,3521,434 1,5251,824
          Fianna Fáil John Griffin* 10.80 1,1361,208 1,2831,527
          Fianna Fáil John Cregan* 10.30 1,0841,131 1,252 
          Fine Gael John Sheahan 10.26 1,0791,205 1,3811,789
          Fine Gael Stephen Keary 9.48 9971,210 1,3461,408
          Green Party Pat Culhane 4.87 512576   
          Independent Paudie Mulvihil 3.69 388407   
          Electorate: 16,697  Valid: 10,520 (63.01%)  Spoilt: 174  Quota: 1,754  Turnout: 10,694 (64.05%)


            Preceded by
            Limerick County Council election, 1999
            Limerick County Council elections Succeeded by
            Limerick County Council election, 2009

            Related Research Articles

            Texas Legislature

            The Legislature of the state of Texas is the state legislature of Texas. The legislature is a bicameral body composed of a 31-member Senate and a 150-member House of Representatives. The state legislature meets at the Capitol in Austin. It is a powerful arm of the Texas government not only because of its power of the purse to control and direct the activities of state government and the strong constitutional connections between it and the Lieutenant Governor of Texas, but also due to Texas's plural executive.
            Ohio Supreme Court elections

            The U.S. state of Ohio has a Supreme Court of seven members, who are elected for six-year terms. See also:

            A presidential election is the election of any head of state whose official title is President.

            Canada holds elections for legislatures or governments in several jurisdictions: nationally (federally), provincially and territorially, and municipally. Elections are also held for self-governing First Nations and for many other public and private organizations including corporations and trade unions. Municipal elections can also be held for both upper-tier and lower-tier governments. Formal elections have occurred in Canada since at least 1792, when both Upper Canada and Lower Canada had their first elections.

            Elections in Sri Lanka gives information on election and election results in Sri Lanka.

            Elections in Georgia (country) elections in the country Georgia

            Elections in Georgia gives information on elections and election results in Georgia. An election is a process in which a vote is held to elect candidates to an office. It is the mechanism by which a democracy fills elective offices in the legislature, and sometimes the executive and judiciary, and in which electorates choose local government officials.

            Elections in the Central African Republic

            Elections in the Central African Republic gives information on election and election results in the Central African Republic.

            Elections in Portugal

            Elections in Portugal gives information on election and election results in Portugal.

            India is a federation with a parliamentary system governed under the Constitution of India, which defines the power distribution between the union, or central, government and the states.
            Elections in Mali

            Elections in Mali gives information on election and election results in Mali.

            The Isle of Man partially elects its legislature at the national level. The High Court of Tynwald consists of two chambers. The House of Keys has 24 members, elected in a general election for a five-year term in 12 two-seat constituencies. Each voter has two votes and in each constituency the two candidates with the most votes are elected. The Legislative Council has 11 members: three ex-officio members and eight other members who are elected by the House of Keys for a five-year term. Political parties do not play an important role on the Island. The Isle of Man lowered its voting age from 18 to 16 in 2006.

            Elections in Paraguay

            Elections in Paraguay gives information on election and election results in Paraguay.

            Elections in Senegal code electoral

            Senegal elects on national level a head of state - the president - and a legislature. The president is elected for a seven-year term by the people.

            Elections in Uruguay

            Uruguay elects on national level a head of state - the president - and a legislature.

            Elections in Zambia

            Elections in Zambia take place within the framework of a multi-party democracy and a presidential system. The President and National Assembly are simultaneously elected for five-year terms.

            A term of office is the length of time a person serves in a particular elected office. In many jurisdictions there is a defined limit on how long terms of office may be before the officeholder must be subject to re-election. Some jurisdictions exercise term limits, setting a maximum number of terms an individual may hold in a particular office.

            1957 Indian general election

            The Indian general election of 1957, held from 24 February to 9 June, was the second election to the Lok Sabha, the lower house of the Parliament of India. They were held five years after the first general election, according to the provisions of the Constitution of India. Elections to many state legislatures were held simultaneously.

            FiveThirtyEight, sometimes rendered as 538, is a website that focuses on opinion poll analysis, politics, economics and sports blogging. The website, which takes its name from the number of electors in the United States electoral college, was founded on March 7, 2008 as a polling aggregation website with a blog created by analyst Nate Silver. In August 2010, the blog became a licensed feature of The New York Times online. It was renamed FiveThirtyEight: Nate Silver's Political Calculus. In July 2013, ESPN announced that it would become the owner of the FiveThirtyEight brand and site and Silver was appointed as editor-in-chief. The ESPN-owned FiveThirtyEight began publication on March 17, 2014. The site was acquired by ABC News on April 17, 2018. In the ESPN/ABC News era, the FiveThirtyEight blog has covered a broad spectrum of subjects including politics, sports, science, economics and popular culture.

            November 2009 San Francisco general election

            The November 2009 San Francisco general elections were held on November 3, 2009 in San Francisco, California. The elections included those for San Francisco city attorney and treasurer, and five ballot measures.

            2022 United States elections

            The 2022 United States elections will be held on Tuesday, November 8, 2022 in the middle of the term of the President elected in 2020. During this mid-term election year, all 435 seats in the United States House of Representatives and 34 of the 100 seats in the United States Senate will be contested. 39 state and territorial governorships and numerous other state and local elections will also be contested. This will be the first election affected by the redistricting that will follow the 2020 United States Census.