This page is based on this
Wikipedia article Text is available under the
CC BY-SA 4.0 license; additional terms may apply.
Images, videos and audio are available under their respective licenses.
Multivariate statistics is a subdivision of statistics encompassing the simultaneous observation and analysis of more than one outcome variable. The application of multivariate statistics is multivariate analysis.

The method of least squares is a standard approach in regression analysis to approximate the solution of overdetermined systems, i.e., sets of equations in which there are more equations than unknowns. "Least squares" means that the overall solution minimizes the sum of the squares of the residuals made in the results of every single equation.

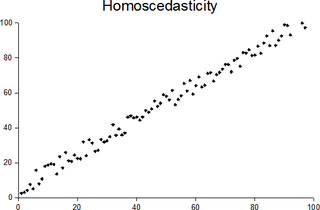
In statistics, a sequence or a vector of random variables is homoscedastic if all random variables in the sequence or vector have the same finite variance. This is also known as homogeneity of variance. The complementary notion is called heteroscedasticity. The spellings homoskedasticity and heteroskedasticity are also frequently used.

In statistics, a collection of random variables is heteroscedastic if there are sub-populations that have different variabilities from others. Here "variability" could be quantified by the variance or any other measure of statistical dispersion. Thus heteroscedasticity is the absence of homoscedasticity.
There are two main uses of the term calibration in statistics that denote special types of statistical inference problems. "Calibration" can mean

In statistical modeling, regression analysis is a set of statistical processes for estimating the relationships among variables. It includes many techniques for modeling and analyzing several variables, when the focus is on the relationship between a dependent variable and one or more independent variables. More specifically, regression analysis helps one understand how the typical value of the dependent variable changes when any one of the independent variables is varied, while the other independent variables are held fixed.

The general linear model or multivariate regression model is a statistical linear model. It may be written as

In statistics, nonlinear regression is a form of regression analysis in which observational data are modeled by a function which is a nonlinear combination of the model parameters and depends on one or more independent variables. The data are fitted by a method of successive approximations.

In machine learning and statistics, classification is the problem of identifying to which of a set of categories (sub-populations) a new observation belongs, on the basis of a training set of data containing observations whose category membership is known. Examples are assigning a given email to the "spam" or "non-spam" class, and assigning a diagnosis to a given patient based on observed characteristics of the patient. Classification is an example of pattern recognition.

In robust statistics, robust regression is a form of regression analysis designed to overcome some limitations of traditional parametric and non-parametric methods. Regression analysis seeks to find the relationship between one or more independent variables and a dependent variable. Certain widely used methods of regression, such as ordinary least squares, have favourable properties if their underlying assumptions are true, but can give misleading results if those assumptions are not true; thus ordinary least squares is said to be not robust to violations of its assumptions. Robust regression methods are designed to be not overly affected by violations of assumptions by the underlying data-generating process.

Nonparametric regression is a category of regression analysis in which the predictor does not take a predetermined form but is constructed according to information derived from the data. Nonparametric regression requires larger sample sizes than regression based on parametric models because the data must supply the model structure as well as the model estimates.
In statistics, the White test is a statistical test that establishes whether the variance of the errors in a regression model is constant: that is for homoskedasticity.

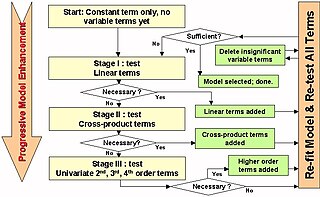
In statistics, stepwise regression is a method of fitting regression models in which the choice of predictive variables is carried out by an automatic procedure. In each step, a variable is considered for addition to or subtraction from the set of explanatory variables based on some prespecified criterion. Usually, this takes the form of a sequence of F-tests or t-tests, but other techniques are possible, such as adjusted R2, Akaike information criterion, Bayesian information criterion, Mallows's Cp, PRESS, or false discovery rate.

Segmented regression, also known as piecewise regression or broken-stick regression, is a method in regression analysis in which the independent variable is partitioned into intervals and a separate line segment is fit to each interval. Segmented regression analysis can also be performed on multivariate data by partitioning the various independent variables. Segmented regression is useful when the independent variables, clustered into different groups, exhibit different relationships between the variables in these regions. The boundaries between the segments are breakpoints.
The following outline is provided as an overview of and topical guide to regression analysis:

Linear least squares (LLS) is the least squares approximation of linear functions to data.
It is a set of formulations for solving statistical problems involved in linear regression, including variants for
ordinary (unweighted),
weighted, and
generalized (correlated) residuals.
Numerical methods for linear least squares include inverting the matrix of the normal equations and orthogonal decomposition methods.
In econometrics, the Park test is a test for heteroscedasticity. The test is based on the method proposed by Rolla Edward Park for estimating linear regression parameters in the presence of heteroscedastic error terms.


